|
Current Weather and Forecasts: The
current weather data is gathered by a network of weather stations; the
forecasts are produced by various governmental and private organizations.
SACRAMENTO <Int>
<NWS>
<NWS
disc> <WU>
<Accu>
SAN FRANCISCO <Int>
<NWS>
<WU>
<Accu>
TAHOE <Int>
<NWS>
<WU> <Accu>
US SURFACE
WEATHER MAP <Int>
<TWC> <WU> <Accu>
<NWS>
|
Temperature Maps: These
maps use various methods to depict temperature patterns, including isotherms,
chloropleth (color coding), and numeric data.
SAC / NOR CAL <Int>
UNITED STATES <Int>
<FSU>
|
|
Wind Maps: These
maps generally report both surface wind velocity (speed) and direction.
SAC / NOR CAL SURFACE <Int>
BAY AREA SURFACE <USGS>
BAY AREA SURFACE (animated)
<USGS>
UNITED STATES SURFACE <Int>
<FSU>
UNITED STATES
UPPER LEVEL (JET STREAM) <Int>
<WU> <Accu>
<SFSU>
EASTERN US /
ATLANTIC <WU>
|
Pressure Maps: These
maps show surface pressure in millibars, usually showing the low pressure
centers with an "L" and the high pressure centers with an
"H".
EASTERN PACIFIC <SFSU>
UNITED STATES <FSU>
|
|
Satellite Imagery: As you might guess, these images are
taken from satellites in space. A more detailed explanation can be found here.
|
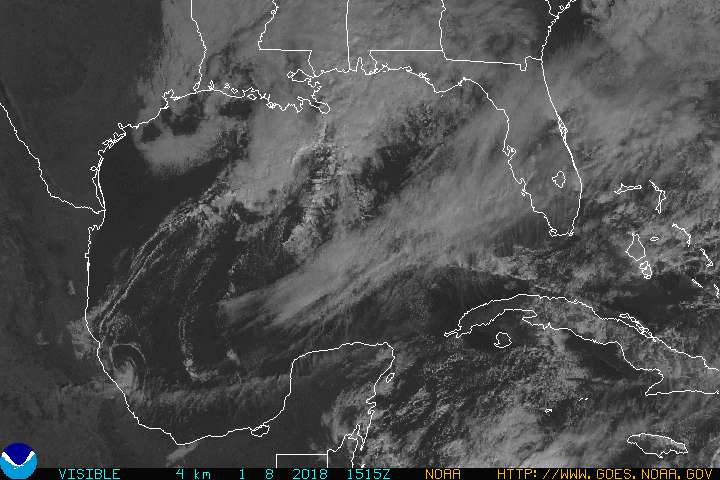
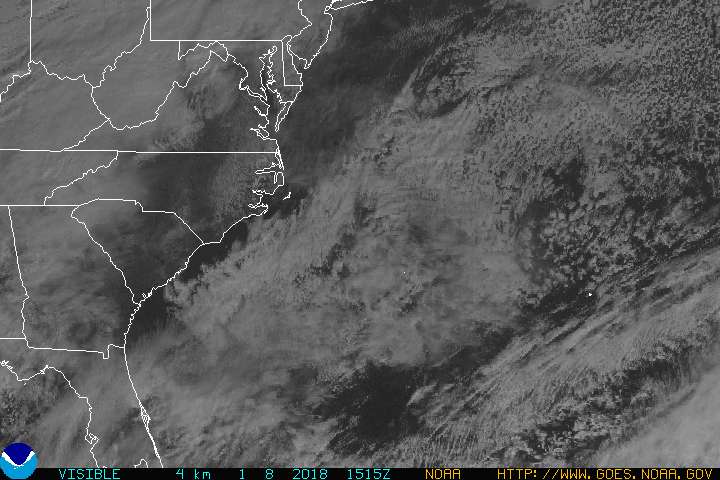
-Visible:
Visible images show
sunlight reflecting off Earth.
SAC / NOR CAL <Int>
<NWS>
<NRL>
CAL/WESTERN US <NOAA> <NWS>
EASTERN PACIFIC <NRL>
<UofWisc>
UNITED STATES <Int>
|
-Visible
Animation: Same as
visible, except that these are series of images shown in chronological order
(similar to a short movie). Some may not be viewable on your computer.
SAC / NOR CAL <Int>
<NRL**>
CAL/WESTERN US <NOAA> <NWS>
EASTERN PACIFIC <NRL**>
<OCS> <NOAA> <UofWisc>
UNITED STATES <Int>
**Once this page has
loaded, click on "Animate" at the top of the page and follow
instructions.
|
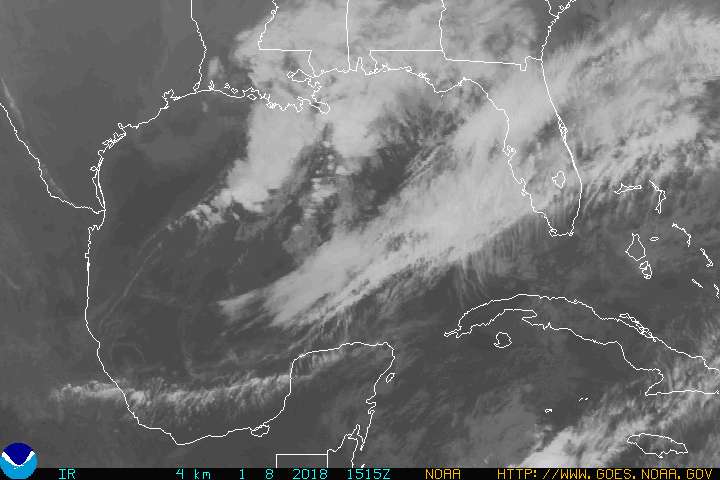
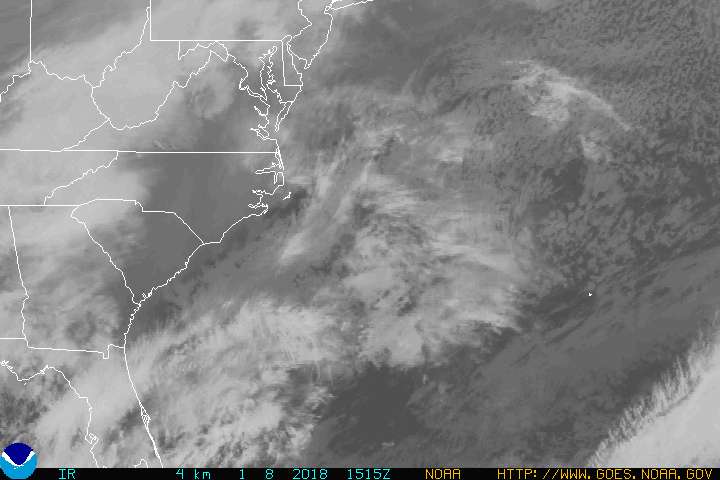
-Infrared:
Infrared images
"take a picture" of infrared (longwave) radiation emitted from the
atmosphere and Earth's surface.
SAC / NOR CAL <NWS>
CAL/WESTERN US <Int> <NOAA> <NWS>
EASTERN PACIFIC <NRL>
<UofWisc> <OCS
w/ fronts> <NWS>
UNITED STATES <Int>
<NRL>
|
-Infrared
Animation: Same as
infrared, except that these are series of images shown in chronological order
(similar to a short movie). Some may not be viewable on your computer.
SAC / NOR CAL <NWS>
CAL/WESTERN US <Int> <NOAA> <NWS>
EASTERN PACIFIC <Int> <NRL**>
<UofWisc> <NOAA> <NWS>
<OCS
w/ fronts
UNITED STATES <Int> <NRL**>
**Once this page has
loaded, click on "Animate" at the top of the page and follow
instructions.
|
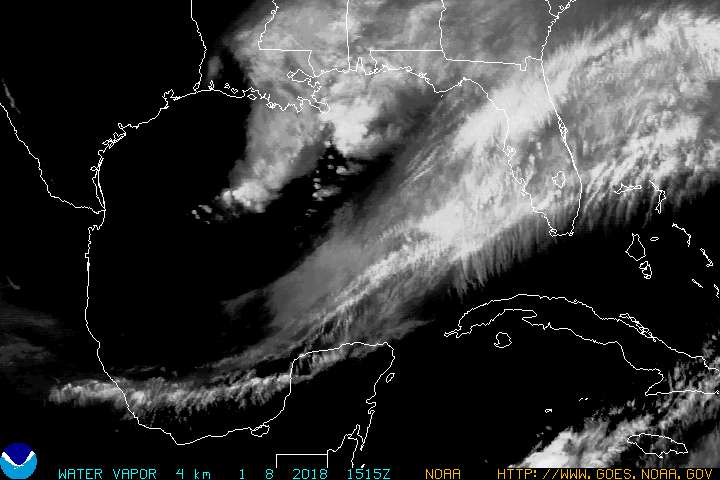
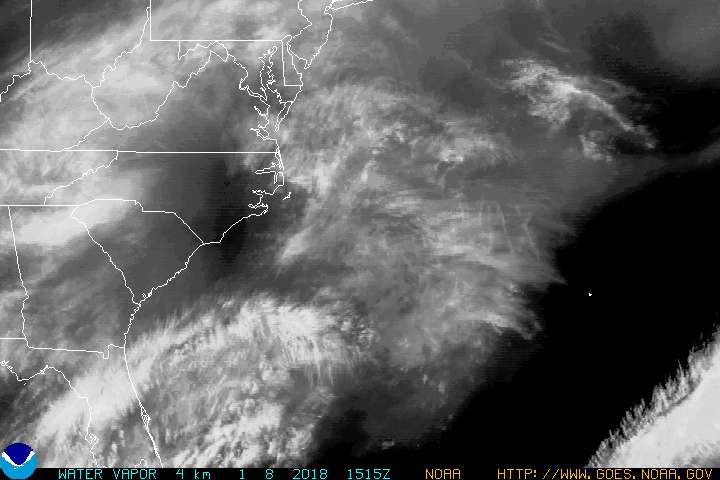
-Water
Vapor: These images
are similar to infrared, but they are able to show the specific "energy
signature" emitted by water vapor. Dry air shows up as dark areas,
while moist air shows up as light areas.
CAL/WESTERN US <NOAA> <NWS>
EASTERN PACIFIC <NRL>
<UofWisc> <NWS>
|
-Water
Vapor Animation: Same
as water vapor, except that these are series of images shown in chronological
order (similar to a short movie). Some may not be viewable on your computer.
CAL/WESTERN US <NOAA> <NWS>
EASTERN PACIFIC <NRL**>
<UofWisc> <NWS>
**Once this page has
loaded, click on "Animate" at the top of the page and follow
instructions.
|
|
Radar/Precipitation: These images are generated by ground-based
Doppler radar stations located around the country (see map here). Many
different types of images can be produced from radar data, and most have to
do with amount and type of precipitation. Radar is explained in more detail here.
|
-STILL IMAGES
SAC/METRO <Int**>
SAC / NOR CAL <Int**>
<KCRA> <NWS>
CAL/WESTERN US <WC> <Int**>
UNITED STATES <WC> <NWS>
<Int**>
**Zoom in or out to desired
area.
Precipitation
Totals Map for Western US
|
-ANIMATIONS
SAC/METRO <Int**>
SAC / NOR CAL <Int**>
<NWS>
CAL/WESTERN US <WC> <Int**>
UNITED STATES <WC> <NWS>
<Int**>
**Zoom in or out to desired area, then press play.
|
|
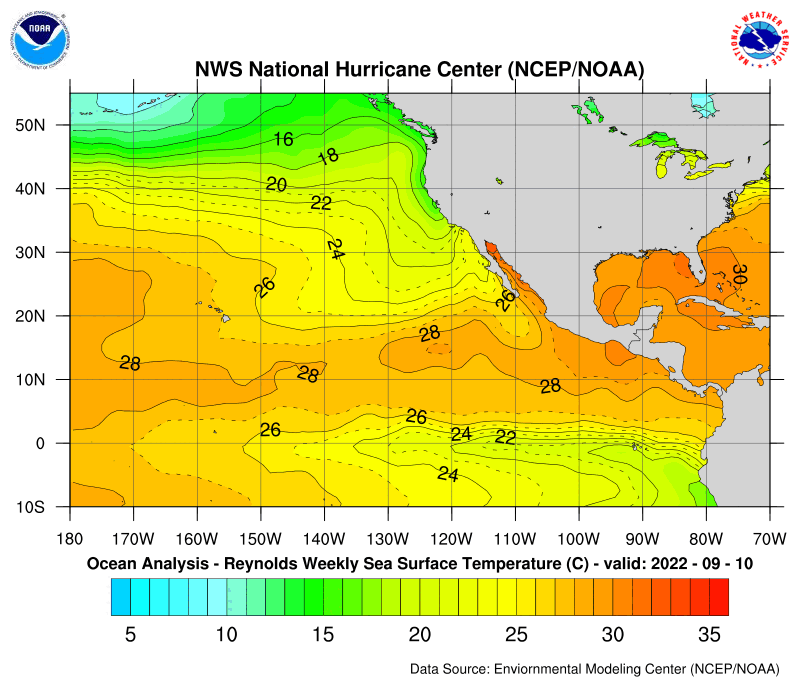
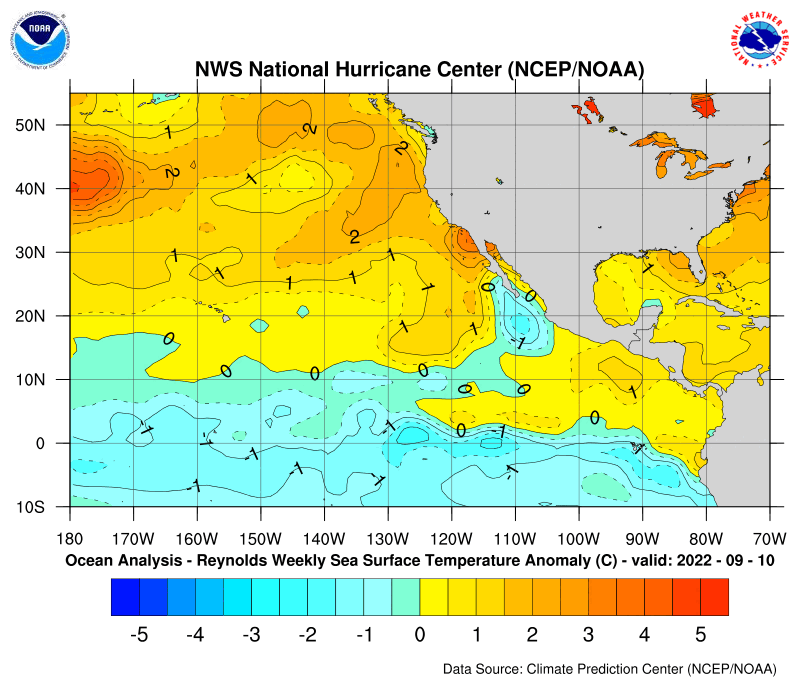
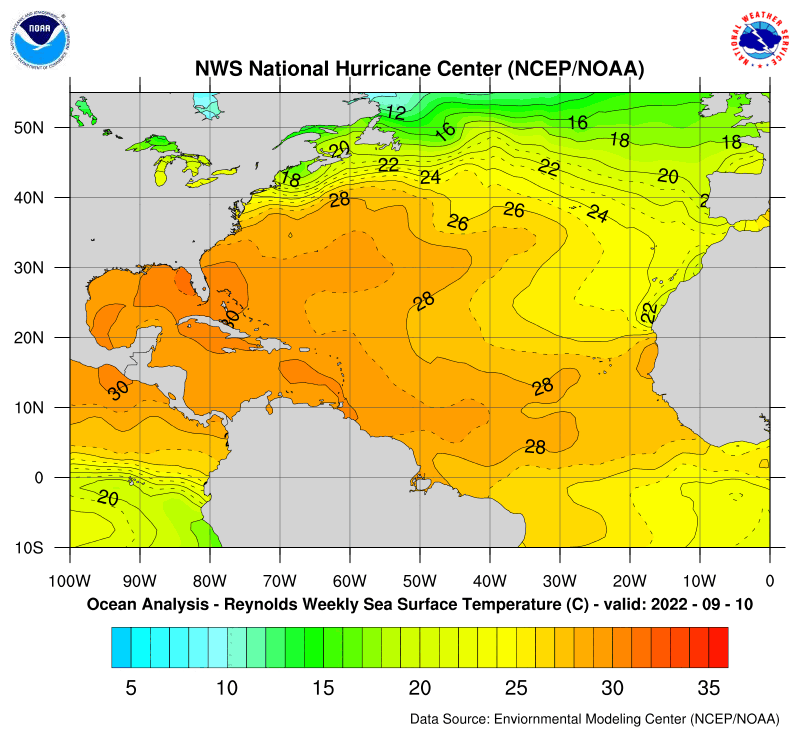
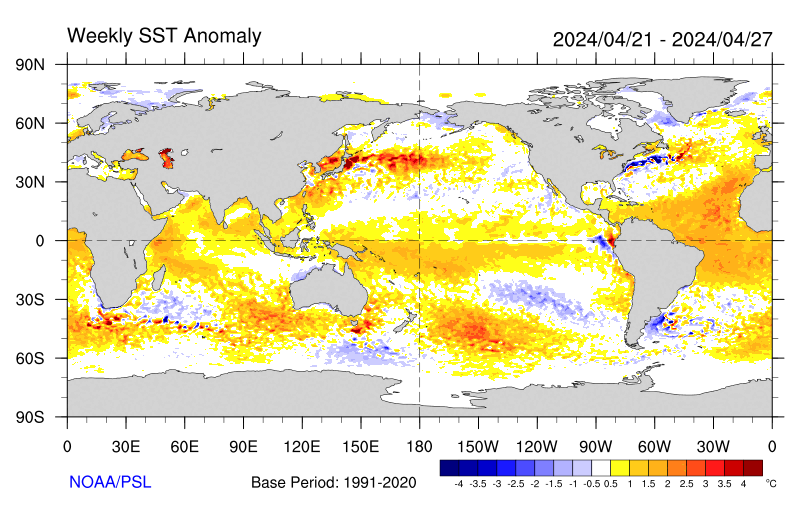
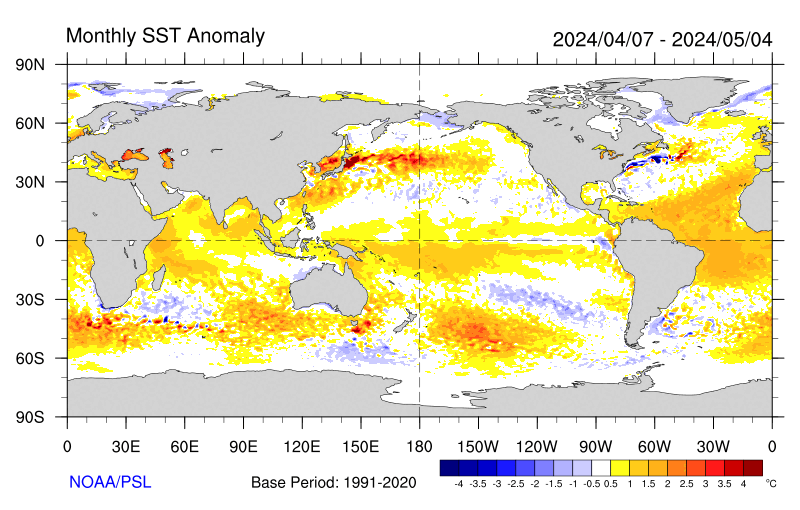
Sea Surface Temperature (SST)
Maps: These maps show sea surface temperatures and anomalies as
determined by floating buoys and by satellites. An anomaly is a deviation
(difference) from the average for a particular time and location.
COASTAL N.A. <WU> <NWS> weekly anomaly NWS
CARIBBEAN/ATLANTIC <WU> <NWS> weekly anomaly <NWS>
GLOBAL <UofWisc> weekly anomaly <NOAA><WU> monthly anomaly <NOAA>
PACIFIC ANOMALY ANIMATION
(for this year) <NOAA>
|
|
Active Tropical
Cyclones/Hurricanes: Tropical cyclones are storms which
form over warm, low-latitude ocean waters. In the Atlantic and Eastern
Pacific Oceans they "achieve" hurricane status once the sustained
winds reach 72 mph or higher. See the Saffir-Simpson Scale
for more information on rating the severity of tropical cyclones. For
information and history on the naming of storms, click here.
Active Storms NRL WU Unisys Hawaii.edu
Archives WU
Unisys NOAA
Satellite Pages NOAA main NOAA pacific
NOAA atlantic
NRL
QUCIKVIEW - GOES-East/West
Hurricane Sectors
|
|
Snow Cover and Depth: These links show
snow cover and depth data. This is especially important in California
for long term water planning.
North America Map Northern Hemisphere Map CAsnwpack
USsnwpack
CA Snow Page
|
|
Earthquake Reports: Here you will find
up to the minute reports (including time, magnitude, depth, and more) on even
the smallest quakes in Sacramento, the Bay Area, and beyond.
Sacramento / Bay
Area Quake Map - Click
on each quake to find more info. Scroll down to see detailed list.
California Quake Map -
Click on
each quake to find more info. Here's a list.
US Quake Map
Global Quake Map
|
|
Volcano Reports: Here you will find
selected links to both recent and ongoing volcanic activity.
Global
Volcanic Activity Map
Cascades Volcano Observatory
(Current
Activity Update)
Alaska Volcano Observatory
(Current Activity Update)
Hawaiian
Volcano Observatory (Current Kilauea Update)
(Current Mauna Loa
Update)
|
|
Sacramento Air Quality: The Air Quality
Index (AQI) is a measure of pollution as it relates to human health.
<Current AQI>
<Ozone Map> Once the page loads, set
"Pollutant" to "Ozone" and click "GO".
You can also click on the "Animate!" button to see how conditions
have progressed through the day. Lastly, click here for historical
archives.
<Particulate Matter Map>
Once the page loads, set
"Pollutant" to "Particulate Matter" and click
"GO". You can also click on the "Animate!" button
to see how conditions have progressed through the day. Lastly, click here for historical
archives.
<Pollen
Counts>
|
|
Sacramento Area River Levels and
Flood Warnings:
Here
you will find reports on exactly how much water is running in Sacramento Area
streams and rivers. Discharge (or streamflow) is a measure of the
amount of water flowing in the stream (measured in cubic feet per second).
One cubic foot is about the volume of a basketball. River stage is
basically the elevation of the water level in the river. These reports will indicate
whether the stream or river is at or above flood stage.
SACRAMENTO
RIVER**********
Sacramento
River at Colusa (USGS) - Stage and discharge.
Sacramento River at
Verona (USGS) - Stage
and discharge.
Sacramento River
at Bryte (CDEC) - Stage
and precipitation.
Sacramento River at I St. Bridge (CDEC) - Stage and discharge.
Sacramento
River at Freeport (USGS) - Stage and discharge.
AMERICAN RIVER**********
American River at N.
Fork Dam (USGS) - Stage
and discharge.
American River
at Folsom Dam (CDEC) - Discharge, stage, water temp, and more.
American River at Fair Oaks (CDEC) - Discharge, stage, and water temperature.
American River at
Fair Oaks (USGS) - Discharge
and stage compared to averages.
LOCAL CREEKS**********
Antelope Creek in Roseville (CDEC) - Stage.
Arcade Creek at American River College
(CDEC) - Stage and precipitation.
Dry Creek at Vernon St. (CDEC) - Stage.
Linda Creek in Rio Linda (CDEC) - Stage.
OTHER**********
Yolo Bypass (CDEC) - Stage and discharge.
Map
of Sacramento Area Monitoring Stations (CDEC)
Map of California Monitoring
Stations (USGS)
|
|
SACRAMENTO AREA WEB CAMS: The following photos from KXTV-10
TowerCams are updated every 10 minutes.
Downtown Looking West
Downtown Looking East
Downtown From KXTV-10 Studios
|