| Title Western States 100 Mile One Day Ride- The Tevis Cup and GIS | |||||||||||||||||||||||||||||||||||||||||||||||||||||||||||||||
|
Author Janice Sutherland American River College, Geography 350: Data Acquisition in GIS; Fall 2004 Contact Information: jchandle@aol.com | |||||||||||||||||||||||||||||||||||||||||||||||||||||||||||||||
|
Abstract The Western States 100 Mile One Day Ride celebrated its 50th anniversary this past July. Horse and rider teams ride from Squaw Valley, CA to Auburn, CA , making veterinarian and water stops along the way. The Tevis Cup web site shows statistics that have been collected through the years. I consolidated a four year section, from 2000 to 2003, covering pulls because of lameness, rider option, metabolic (heart/pulse count), and not making the time cut-off set for each check point. The goal was to determine if GIS could be a beneficial tool for the Tevis organizers and participants. Experimenting with GIS tools such as ArcExplorer, DeLorme Topo USA 4.0, VBGarmin, ArcMap, Waypoints+, and ExpertGPS as well as Excel charts, at least the charting of data was a valuable tool to visually present the data. Expanding on the capabilities of ArcMap/ArcView, I believe further benefit could be achieved for both the Western States Trail Foundation and the Tevis Cup participants. | |||||||||||||||||||||||||||||||||||||||||||||||||||||||||||||||
|
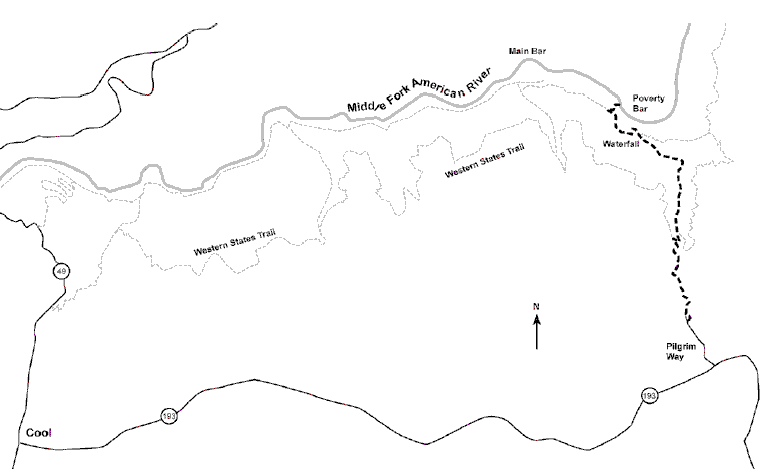
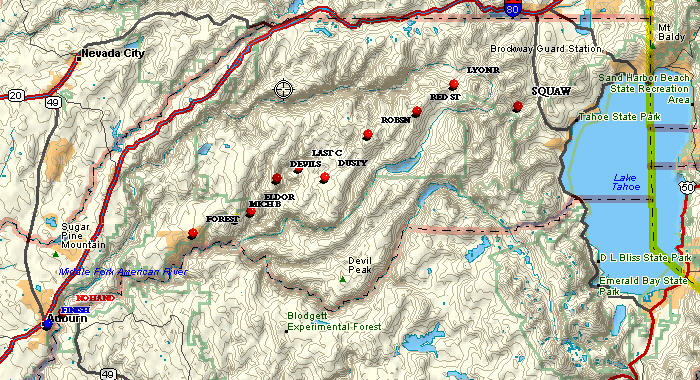
Introduction On July 31, 2004, the endurance community celebrated the 50th anniversary of the Western States 100 Miles One Day Trail Ride. The endurance ride is better known today as the Tevis Cup Ride, with its starting point being at Squaw Valley, CA and the finish at the Auburn, CA fairgrounds. The Western States Trail started out as being a commonly traveled route from California and Northern Nevada during the gold rush days. It was not an easy road to travel. Since 1955, horsemen from throughout America and from all over the world compete annually in the Western States 100 Mile One Day Ride. The ride challenges horse and rider strength and stamina. The Tevis Cup was the first of its kind and it the most challenging endurance riding event in the world. Every horse and rider who makes the 100 mile ride in under 24 hours receives a Tevis belt buckle. The first horse and rider crossing the finish line and passing the vet check wins the Tevis Cup. The best conditioned horse wins the Haggin Cup. There are approximately 13 points along the ride where a Veterinarian is available to check the respirations and condition of the horses. Most are mandatory vet check sites and some require the rider to hold at that check point for at least 1 hour. Horses are pulled if they do not pass the Vet checks. Statistics are collected regarding horses pulled, where they were pulled and why they were pulled. Generally 50% of the starting teams complete the ride. My intent is to apply Geographic Information Systems (GIS) to map the Tevis Cup Ride. The trail is treacherous in places and there is only one place a helicopter can be brought in if there is a need to evacuate a rider. Sweep Riders carry GPS units and communicate via Amateur Radio operators stationed at each check point. These check point coordinates will be used in the mapping process. GIS can be used to consolidate the data collected over the last 50 years and allow for modeling of that data. Would mapping the ride provide other information of critical or statistical importance to the coordinators at the Western States 100 Mile One Day Ride? | |||||||||||||||||||||||||||||||||||||||||||||||||||||||||||||||
|
Background In 1931 Robert Montgomery Watson and a few people from the Native Sons of The Golden West, Parlor 59, from Auburn, completed the task of marking the entire route between Auburn and Lake Tahoe. The trail had almost become unrecognizable as the shortcut between Northern California gold mine camps and the silver lodes of Nevada except for some of the old tree blazes. Wendell Robie, one of the men that helped Montgomery mark the Western States Trail and had brought snow skiing to the west coast, organized a three day ride along the trail with his friend Jack Shields. This ride became an annual event. Robie wanted to make the ride competitive and when a challenge was made by Bill Stewart of Miles City, Montana in the February 1950 Western Horseman magazine, Robie responded. Stewart challenged "Dr. Conn, Carl Raswan, and any other Arab enthusiast to an endurance race any distance from 50 to 200 miles for money, marbles, or chalk." Robie wrote to the magazine and accepted the challenge, and because he was the challenged party, selected the Auburn-Lake Tahoe horse trail in California for the race. The distance was 90 miles, west to east crossing of the Sierra Nevada starting at an elevation of 1400, crossing the Sierra in Squaw Pass at 8600 feet, and then dropping to Lake Tahoe at 6225 ft. Robie also set the bet at $250 and the weight limit at a minimum of 165 pounds. Mr. Stewart did not agree to Robie's terms and eventually the discussion died out, but the idea of the competition did not. Today the Western States Trail is one of only a few east-west trail routes from the eastern side of the Sierra Nevada mountains to the Sacramento Valley that is largely untouched by development. Forests and habitats for many types of wildlife lay along the trail. (Hall, Hal V., 1992 and Langer, Marnye, 2004) Tevis Cup Ride history and general information can be found at Auburn, CA - The Endurance Capitol of the World and The Official Tevis Cup Site. The Tevis Ride coordinators have kept statistics over the last 50 years relating to many aspects of the ride. Statistics on the number of horse and rider teams who actually finish compared to the number of starts. Statistics on pulled horse and rider teams and the location pulled from. A veterinarian could pull a horse for lameness or for not meeting the required respirations; ie metabolic rate. They've done tack and weight surveys as well as temperature and humidity research for each check point. | |||||||||||||||||||||||||||||||||||||||||||||||||||||||||||||||
|
Methods My plan was to consolidate some of the data published in various locations to determine if a GIS system could be of help to the Tevis Cup Ride coordinators. I used the GPS coordinates posted on the website of amateur radio operator K6DGW. The locations listed are check points where there is either a veterinary check or water stop for the horse and riders. Radio operators are stationed at these sites and coordinate the communication for the ride. Since I dont have access to the ArcView products away from school, I had intended to use ArcExplorer (a free ESRI product) for my mapping. I was able to download two backgrounds from the ESRI web site. One is a topo map and one is a city map that covers the trail area from Auburn to Squaw Valley. The metadata for these two maps includes the following: Data Information Name: ESRI World Basemap Data Provider: ESRI Coverage: World Scale: Variable Coordinate System: Geographic Coordinates (NAD 83) Units: Decimal degrees Delivery: Compressed shapefile download File size: A compressed file ranges between 10 KB and 1 MB Price: Free I was able to load these shapefiles into ArcExplorer with no problem. At this point I became stuck. I didn't know how to plot my points and have them georeferenced on my backgrounds. I looked into using Waypoints+, and VBGarmin (Department of Fish and Game). I had no luck with either of these. I finally was able to load the points into the Garmin GPS76 and download them into my DeLorme TOPO USA 4.0 mapping program. After some upgrades to the VBGarmin Software were made by the Department of Fish and Game, I was able to create output from the Garmin GPS 76 and plot my waypoints in ArcMap (NAD83 UTM10). To be able to see these waypoints, I needed to change their projection from UTM to decimal degrees. When this was done, all the map themes and waypoints were plotted correctly in ArcExplorer. Since the published GPS coordinates have been used for a number of years I believe they are generally correct. The points, where possible, were compared to USGS 7.5' quads according to the check point access web page for the Western States Run. I found a trail guide from the Auburn State Recreation Area that shows the Western States Trail. My map follows the same path as the park guide though it would be hard to determine that exactly because of the courseness of the maps. Some degree of inaccuracy can be allowed since the target point is fairly large. A ten foot difference would not cause a problem in finding a check point. The source GPS page states the accuracy of the coordinates is within +-100 meters (~300'). The elevation accuracy is about +-35 meters(~100'). I can personally verify the GPS location for Dusty Corners, since I was a radio volunteer there in 2003 and 2004. In 2004 I ended up needing to use my Garmin Rino 120 to find the spot in the dark. The coordinates took me right to the spot I remembered from 2003. I was not able to check each point along the 100 mile distance from Squaw Valley to Auburn. | |||||||||||||||||||||||||||||||||||||||||||||||||||||||||||||||
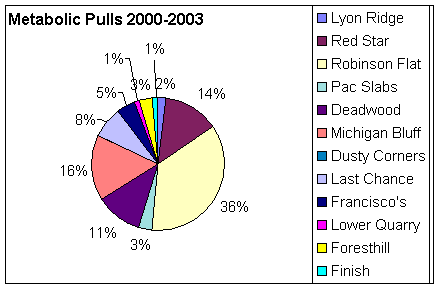
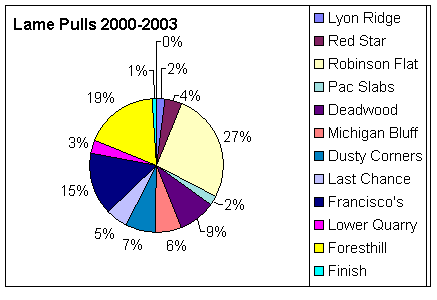
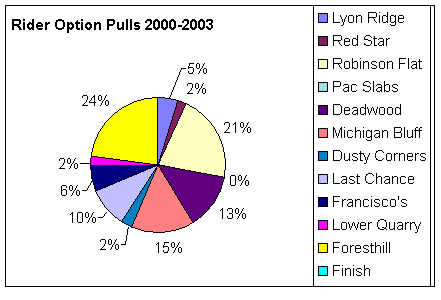
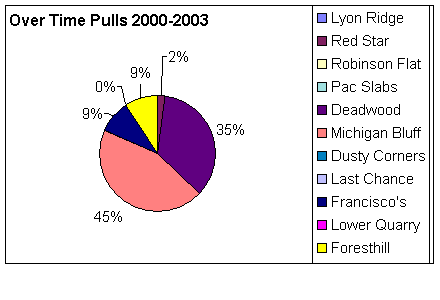
| For the information regarding the pull statistics, I used the Tevis Cup Official Web Site and the Tevis Forum paper published by the Western States Trail Foundation. I used Excel to create the pie charts depicting the number of pulls (non-finishers) that occurred at each check point between the years 2000 and 2003. The 2004 data on the web does not show the pull statisics by check point. Would there be any kind of a pattern that would emerge from analysis of the ride data that could help the ride coordinators or the riders? |
| ||||||||||||||||||||||||||||||||||||||||||||||||||||||||||||||
|
Results The following GPS data was collected by the North County Amateur Radio club in degrees, minutes
and seconds in NAD27.
Consolidated pull information for the years 2000 thru 2003 was collected from the Tevis web site and
The Forum publication. Results for 2004 have been posted on the
internet, but the pull data is not broken down by reason.
| |||||||||||||||||||||||||||||||||||||||||||||||||||||||||||||||