Preliminary Exploration of Chinook Salmon Redd Distributions
in a Central Valley River
Morgan Neal
American River College
Geography 350
Fall 2012
Abstract
It has been hypothesized that the observed trend of Chinook salmon redd construction in the lower Yuba River occurring in upstream areas, and subsequently moving downstream as the spawning season progresses, may be related to water temperature. The goal of this study was to conduct a preliminary, exploratory investigation of the spatial distribution of Chinook salmon redd construction in the Yuba River over the course of the Chinook salmon spawning season during 2009, and whether the spatial and temporal distributions of redd construction were related to water temperatures. I utilized various tools in ArcGIS to evaluate measures of central tendency of redd construction during different time periods throughout the Chinook salmon spawning season, and I specifically explored the spatial and temporal distributions, and abundances of redds constructed in the vicinity of the Timbuctoo Bend Reach.
As the Chinook salmon spawning season progressed, the relative number of fresh redds constructed increased in a downstream direction, and appeared to correspond to the reduction in water temperatures both upstream of Daguerre Point Dam, and downstream of Daguerre Point Dam over the course of the spawning season. Accordingly, suitable Chinook salmon spawning water temperatures, often indicated as less than 60 °F, increased in area as the spawning season progressed. Therefore, the hypothesis that Chinook salmon redd construction occurring in a downstream direction as the spawning season progresses due to lower water temperatures occurring in a downstream direction, may be true based on this preliminary exploration of Chinook salmon redd data and water temperatures during September through December of 2009.
Introduction
For the lower Yuba River, the combined spring-run and fall-run Chinook salmon spawning period has been reported to extend from September through December (YCWA et al., 2007). Historical Chinook salmon redd surveys in the lower Yuba River indicate a slow build-up of Chinook salmon redd construction starting in early September and continuing into October, November, and December (YCWA et al., 2007; Campos and Massa, 2011; Campos and Massa, 2012). Additionally, Chinook salmon redd surveys indicate that spawning activity is initiated in the more upstream reaches of the lower Yuba River, and progresses downstream over the course of the spawning season (Campos and Massa, 2011; Campos and Massa, 2012). It has been hypothesized by the RMT that this downstream progression in spawning may be related to water temperatures.
The goal of this study was to conduct a preliminary, exploratory investigation of the spatial distribution of Chinook salmon redd construction in the Yuba River over the course of the Chinook salmon spawning season during 2009, and whether the spatial and temporal distributions of redd construction were related to water temperatures.
Background
Information regarding spring-run Chinook salmon spawning activity can be inferred from observations of phenotypic spring-run Chinook salmon that were acoustically-tagged during the spring months of 2009 (Massa et al., 2012). Examination of the acoustically-tagged spring-run Chinook salmon data revealed a consistent pattern in fish movement. In general, acoustically-tagged spring-run Chinook salmon exhibited an extended holding period below Daguerre Point Dam into as late as approximately the end of September, followed by a rapid movement into upstream areas (upper Timbuctoo Reach, Narrows Reach, and Englebright Reach) generally during September.
The earliest Chinook salmon spawning in the lower Yuba River, presumed to be spring-run Chinook salmon, generally occurs in the upper reaches (i.e., below the Narrows pool) and progressively moves downstream throughout the fall-run Chinook salmon spawning season (NMFS, 2007). Spring-run Chinook salmon spawning in the lower Yuba River is believed to occur primarily upstream of Daguerre Point Dam (YCWA et al., 2007). USFWS (2007) collected data from 168 Chinook salmon redds in the lower Yuba River on September 16-17, 2002 and September 23-26, 2002, considered to be spring-run Chinook salmon redds. The redds were all located above Daguerre Point Dam. During the RMT’s pilot redd survey conducted from the fall of 2008 through spring of 2009, the vast majority (i.e. 96%) of fresh Chinook salmon redds constructed by the first week of October 2008, potentially representing spring-run Chinook salmon, were observed upstream of Daguerre Point Dam. Similar distributions were observed during the other two years of redd surveys, when weekly redd surveys were conducted (Campos and Massa, 2011; Campos and Massa, 2012). About 97 and 96% of the fresh Chinook salmon redds constructed by the first week of October were observed upstream of Daguerre Point Dam during 2009 and 2010, respectively (Campos and Massa, 2011; Campos and Massa, 2012).
Chinook salmon redd surveys were conducted approximately weekly on a near-census basis throughout most of the lower Yuba River during 2009 (Campos and Massa, 2011). As reported by Campos and Massa (2011), approximately 20.9 mi of the 24 mi of the total length of the lower Yuba River was surveyed during the extensive area redd surveys. About 0.7 mi of the lower Yuba River located immediately below the first set of riffles downstream of Deer Creek to the top of Narrows Pool was not surveyed due to rugged and dangerous conditions in the steep canyon known as the Narrows. No surveys were conducted in the 0.4 mile section of river directly upstream of Daguerre Point Dam due to safety concerns of working in close proximity to the dam. Additionally, an approximate 2 mi section of the lower Yuba River from Simpson Lane Bridge to the confluence with the Feather River was not regularly surveyed because redds have not been observed in this area during past surveys. However, this section of the river was surveyed once during peak Chinook salmon spawning to ascertain that this section was not being utilized for spawning (Campos and Massa, 2011).
During the 2009 Chinook salmon redd survey years, over 3,200 redds were counted in the lower Yuba River (Campos and Massa, 2011). Nearly 2,500 Chinook salmon redds were observed upstream of Daguerre Point Dam during the survey period, while over 800 redds were observed downstream of the dam (Campos and Massa, 2011). Peak observations of Chinook salmon redds upstream of Daguerre Point Dam occurred during the week of October 5, 2009 when 480 Chinook salmon redds were observed, while peak observations of Chinook salmon redds downstream of DPD occurred during the week of October 26, 2009 when 152 Chinook salmon redds were observed (Campos and Massa, 2011). Chinook salmon utilized much of the entire 24 miles of the lower Yuba River for spawning, with the exception of the lowermost 3 miles of the river where no spawning was observed.
Chinook salmon redds were found predominantly in the Timbuctoo and Parks Bar reaches during the 2009 annual redd survey (Campos and Massa, 2011). Chinook salmon redds were found predominantly in the riffle, riffle transition, and run morphological units (Campos and Massa 2011).
Campos and Massa (2011) note that the number of salmonid redds reported in 2009 should be considered a minimum observation, since surveys could not be completed during the entire spawning period. Chinook salmon redd surveys were suspended on October 19, 2009 due to an early storm event, and observations from the following weekly survey strata resulted in redd counts that were likely a product of two consecutive weeks of spawning activity during the latter week’s surveys (Campos and Massa, 2011).
Methods
I used raw geographic coordinate data resulting from the 2009 Chinook salmon redd survey in the lower Yuba River, and conducted the necessary clean-up and conversion tasks to explore spatial and temporal distributions of Chinook salmon redds observed during 2009. I utilized various tools in ArcGIS to evaluate measures of central tendency of redd construction during different time periods throughout the Chinook salmon spawning season, and I specifically explored the spatial and temporal distributions, and abundances of redds constructed in the vicinity of the Timbuctoo Bend Reach, because it was reported as a particularly important area for Chinook salmon spawning in the river (Campos and Massa, 2011). Additionally, I conducted a brief exploration of the potential relationship between Chinook salmon redd distributions and water temperatures.
Results
Chinook salmon redd observation data were obtained from the RMT; because these data are not yet publicly available, they are not explicitly presented. These data also have not undergone a thorough QA/QC procedure, and therefore, all data and interpretations presented in this report are preliminary and subject to revision. Resulting displays of Chinook salmon redd spatial and temporal distributions are presented in the following section.
Analyses
I imported a table of redd data with associated geographic coordinates into ArcGIS, and developed a point feature class for all redds observed during 2009. I selected out and created new feature classes for each approximate half-month of redd data (i.e., early September, late September, early October, late October, early November, late November, early December, and late December) of 2009. I used the Central Feature tool in ArcGIS to display the most centrally-located redd within each half-month period, and for the entire 2009 redd dataset. I used the Aggregate Features tool in ArcGIS to combine redd point features that were within 250 feet of each other, and then created a Spatial Join between the polygons resulting from the Aggregate Features process and all of the redd point data collected during 2009, allowing for symbolization of the redd data based on number of redds within each 250 foot buffer (Figure 1).
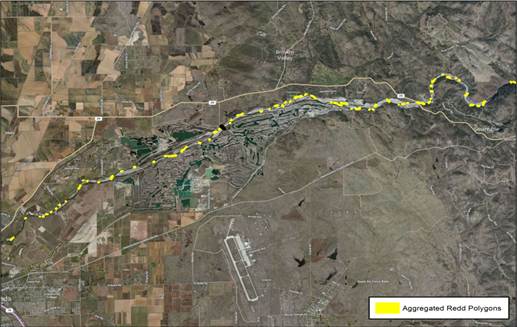
Figure 1. Aggregated Redd Polygons.
I acquired monitored water temperature data in the lower Yuba River, at stations both upstream and downstream of Daguerre Point Dam, and calculated average daily water temperatures for the stations upstream of Daguerre Point Dam, and downstream of Daguerre Point Dam, for each half-month period (Table 1). Because these water temperatures represent averages of average daily water temperatures at several monitoring stations over an approximately two week period, they are only intended to represent very rough estimates of water temperatures during this periods, to be used to evaluate generalized trends in water temperature as the spawning season progressed. Water temperature monitoring data were taken from YCWA, 2012.
Table 1. Mean daily water temperatures (degrees F) upstream and downstream of Daguerre Point Dam during 2009.
|
|
Early Sep |
Late Sep |
Early Oct |
Late Oct |
Early Nov |
Late Nov |
Early Dec |
Late Dec |
|
|
Above Daguerre Point Dam |
55.5 |
55.5 |
53.9 |
53.4 |
52.0 |
50.5 |
48.1 |
47.4 |
|
|
Below Daguerre Point Dam |
61.9 |
60.9 |
58.0 |
57.0 |
54.8 |
52.1 |
48.8 |
49.0 |
|
Monthly Chinook salmon redds observed during September through December of 2009, and the most centrally-located redd, are shown in Figure 2, and redds constructed during each half-month period are shown in Figures 3 through 10.
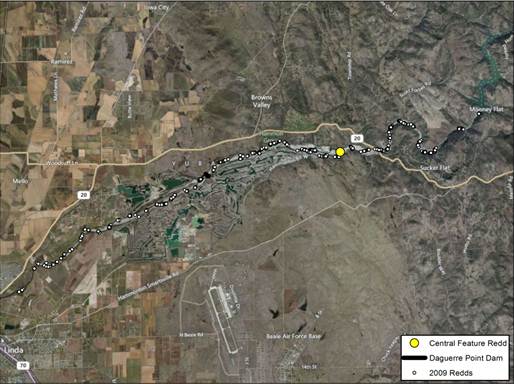
Figure 2. 2009 Chinook Salmon Redds during September through December.
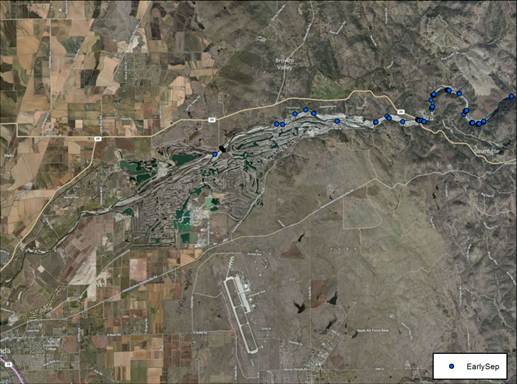
Figure 3. Chinook salmon redds observed during early September.
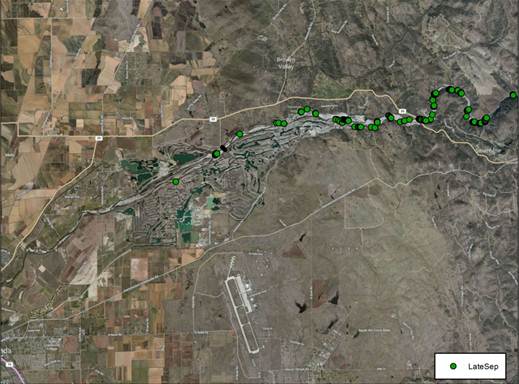
Figure 4. Chinook salmon redds observed during late September.
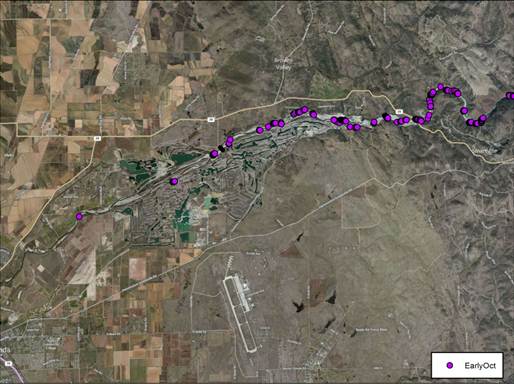
Figure 5. Chinook salmon redds observed during early October.
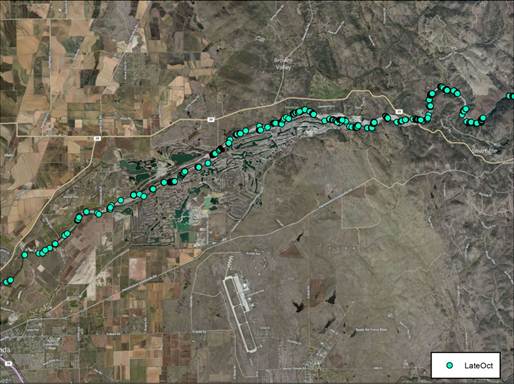
Figure 6. Chinook salmon redds observed during late October.
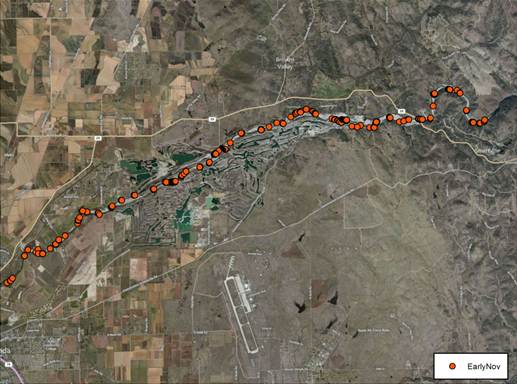
Figure 7. Chinook salmon redds observed during early November.
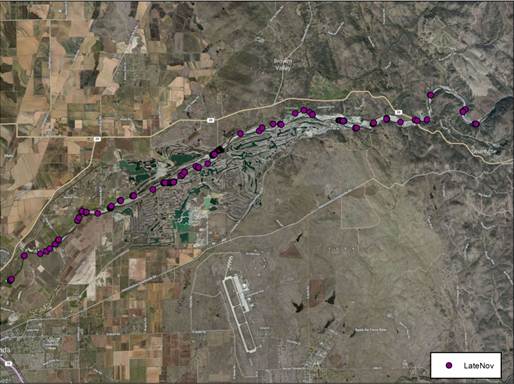
Figure 8. Chinook salmon redds observed during late November.
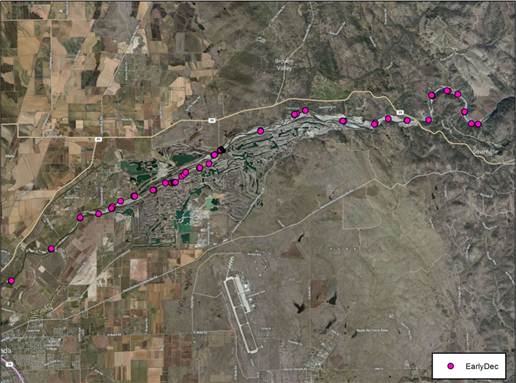
Figure 9. Chinook salmon redds observed during early December.
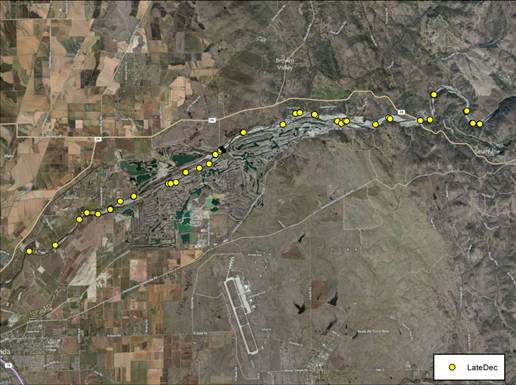
Figure 10. Chinook salmon redds observed during late December.
For each half-month period, the central location of all newly constructed redds was also identified and depicted (Figure 11). Figure 3 shows that the measure of central tendency of redd distribution during each period moves in a downstream direction, with the exception of the late December period.
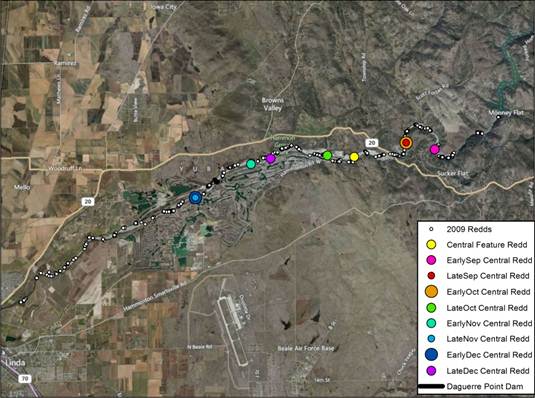
Figure 11. 2009 Chinook Salmon Redds during September through December with centrally-located redds identified for each half-month time period.
The previous figures show all Chinook salmon redds constructed during the September through December period, but substantial overlap of redd survey points is evident, resulting in a distribution that simply shows the overall distribution of where redds were located, but without any indication of relative numbers of redds. Therefore, I used the processes described above to display relative numbers of redds throughout the river using proportional symbology (Figure 12).
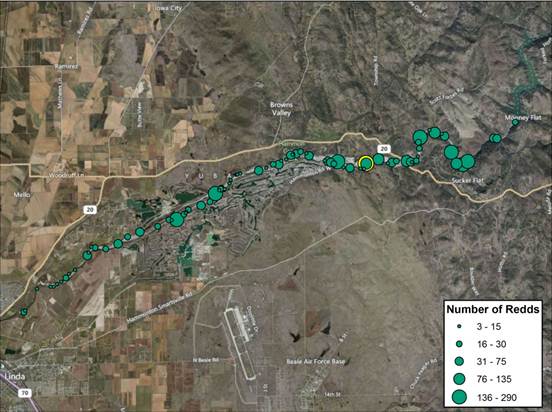
Figure 12. 2009 Chinook Salmon Redds during September through December with proportional symbology, with the most centrally-located redd indicated in yellow.
As indicated by Campos and Massa (2011), and examination of Figure 12, a relatively large number of redds were constructed in the vicinity of Timbuctoo Bend area. Therefore, a zoomed in to this region to further explore the spatial distribution of redds within this area (Figure 13). The most centrally-located redds constructed during early September, late September, and early October also were present in this area, as shown in Figure 13. At this larger scale, it is evident that Chinook salmon appeared to actively select particular areas to construct redds.
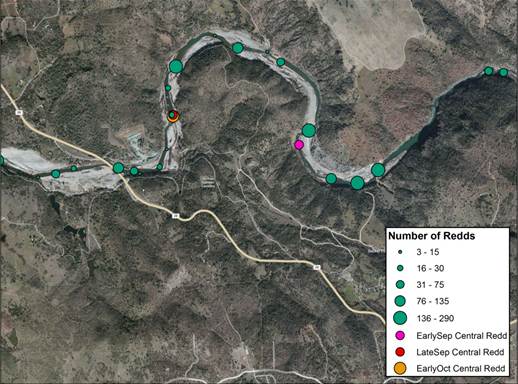
Figure 13. 2009 Chinook Salmon Redds in the Timbuctoo Bend region.
As demonstrated in the previous figures, the spatial distribution of Chinook salmon spawning activity, as indicated by overall spatial distribution and the measure of central tendency, clearly moved downstream as the spawning season progressed up until late December. Based on these figures and Table 1 shown previously, this movement in distribution of redds during the spawning season may in fact be associated with water temperatures decreasing over these time periods.
Conclusions
The highest concentrations of newly constructed Chinook salmon redds were initially observed above the Highway 20 Bridge, in the vicinity of Timbuctoo Bend. As the Chinook salmon spawning season progressed, the number of fresh redds constructed increased in a downstream direction, which also appears to correspond to the reduction in water temperatures both upstream of Daguerre Point Dam, and downstream of Daguerre Point Dam. Accordingly, suitable Chinook salmon spawning water temperatures, often indicated as less than 60 °F (e.g., YCWA et al., 2007), increase in area as the spawning season progressed. Therefore, the hypothesis that Chinook salmon redd construction occurring in a downstream direction as the spawning season progresses due to lower water temperatures occurring in a downstream direction, may be true based on this preliminary exploration of Chinook salmon redd data and water temperature data during September through December of 2009.
References
Campos, C. and D. Massa. 2011. Lower Yuba River Accord Monitoring and Evaluation Plan, Annual Redd Survey Report: August 31, 2009 – April 8, 2010. Available at: http://www.yubaaccordrmt.com.
Campos, C. and D. Massa. 2012. Lower Yuba River Accord Monitoring and Evaluation Plan, Annual Redd Survey Report: 2010-2011. Available at: http://www.yubaaccordrmt.com
Massa, D. L. Alber, and J. Bergman. 2012. 2009 Annual Acoustic Telemetry Report. Lower Yuba River Accord Monitoring and Evaluation Plan. Prepared by Pacific States Marine Fisheries Commission for the Yuba River Management Team.
National Marine Fisheries Service (NMFS). 2007. Final Biological Opinion on the Effects of Operation of Englebright and Daguerre Point Dams on the Yuba River, California, on Threatened Central Valley Steelhead, the Respective Designated Critical Habitats for these Salmonid Species, and the Threatened Southern Distinct Population Segment of North American Green Sturgeon.
U.S. Fish and Wildlife Service (USFWS). 2007. Flow-Habitat Relationships for Spring and Fall-Run Chinook Salmon and Steelhead/Rainbow Trout Spawning in the Yuba River. Prepared by The Energy Planning and Instream Flow Branch.
Yuba County Water Agency (YCWA). 2012. Initial Study Report. Yuba River Development Project.
YCWA, California Department of Water Resources, and U.S. Bureau of Reclamation. 2007. Draft Environmental Impact Report/Environmental Impact Statement for the Proposed Lower Yuba River Accord. State Clearinghouse (SCH) No: 2005062111. Prepared by HDR|Surface Water Resources, Inc. June 2007.