| Title Assessing Image Classification as a Process to Monitor Post-Wildfire Vegetation Growth | |
|
Author Christopher ArgyrosAmerican River College, Geography 350: Data Acquisition in GIS; Fall 2018 | |
|
Abstract The project evaluated the supervised classification method and technique in ArcGIS Pro as it applies to post-fire monitoring. The Image Classification Wizard was run on two sets of NAIP imagery. While the results were not accurate in classifying different types of vegetation, they were accurate in differentiating between more distinct landcovers. The process therefore may not be an adequate process for a detailed vegetation growth assessment, but is accurate and useful for general assessment of vegetation regeneration. | |
|
Introduction There are a variety of methods to assess post-wildfire regeneration using GIS. This project examined one method, employing the Image Classification Wizard in ArcGIS Pro to examine vegetation regrowth in the area of the 2004 Power Fire in El Dorado National Forest, California. | |
|
Background Remote sensing is an important method of analyzing post-fire vegetation regeneration. While field surveying on foot is resource-intensive, satellite imagery is more economical and offers a broader analysis incorporating biophysical elements (Viana-Soto, 2017). One way to analyze vegetation changes is using the process of image classification (Chu, 2013). The supervised image classification with ArcGIS Pro Classification Wizard was run on 4-band NAIP imagery for this project. A more common method employing GIS to evaluate wildfire post-wildfire regeneration entails using vegetation indices, such as Landsat Normalized Difference Vegetation Index (NDVI), the Difference Normalized Burn Index, and the Soil-Adjusted Vegetation Index (Harris, 2011). Spectral indices are combinations of spectral reflectance from two or more wavelengths and are used to show the relative abundance of vegetation or other features. This project asks if the Classification Wizard might be a superior method. | |
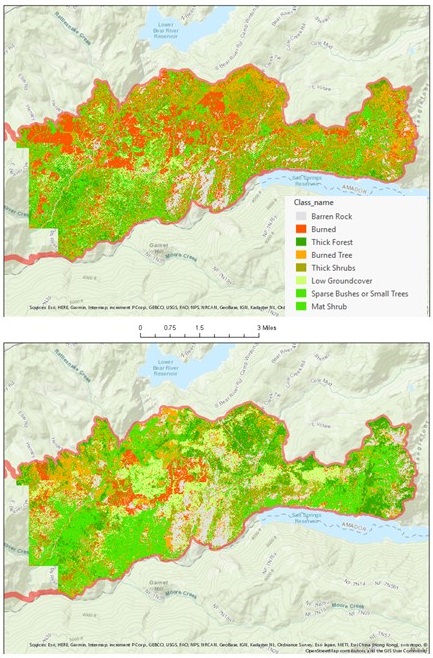 Results from 2009 (top) and 2016 (bottom) Classification.
| |
|
Methods This study area of the 2004 Power Fire was chosen because 1-Meter NAIP imagery is available from 2009 and 2016, and this provides a good timeframe to assess regeneration. The imagery from the National Agriculture Imagery Program was selected because the high resolution (1-meter ground sample distance) is excellent for viewing vegetation and comparing the imagery to the classification results. The imagery was downloaded from the California Department of Fish and Wildlife’s Web Map Service using ArcGIS Pro. The raster layers were downloaded in squares and then stitched together using the Mosaic tool. The fire boundary shapefile was downloaded from Cal Fire’s Fire Resource and Assessment Program. Object-based classification using the ArcGIS Pro Image Classification Wizard was run on both the 2009 and 2016 segmented rasters. Eight landcover classes were assigned. The results were compared with the NAID imagery and based on patterns of observed mis-classifications, a second try at the Classification Wizard was completed. Based on visual inspection, the second try results were more accurate. The Zonal Statistics tool was used to then quantify all results of classification. | |
 | |
|
Analysis Classifying and quantifying broad categories of different land surfaces (such as rock, vegetation, burned area) was successful using the Image Classification Wizard. However, distinguishing between different vegetation types did not yield consistent results. New growth low vegetation (grasses) was accurately classified, likely due to its distinct light green color. | |
|
Conclusions Because of reliance on subjective human decision-making, this process requires a high level of standardization and consistency. It therefore may not be an adequate process for a detailed vegetation growth assessment. Other methods using satellite vegetation indices to evaluate post-wildfire regeneration are likely more accurate assessment methods. | |
|
References Chu, Thuan, et. al., 2013. Remote Sensing Techniques in Monitoring Post-Fire Effects and Patterns of Forest Recovery in Boreal Forest Regions: A Review. Remote Sensing, 6:470-520. Harris, Sarah, 2011. Evaluating Spectral Indices for Assessing Fire Severity in Chaparral Ecosystems (Southern California) Using MODIS/ASTER (MASTER) Airborne Simulator Data. Remote Sensing, 3: 2403-2419. Van Leeuwen, Willem JD, et. al., 2010. Monitoring Post-Wildfire Vegetation Response with Remotely Sensed Time-Series Data in Spain, USA and Israel. International Journal of Wildland Fire, 19(1):75-93. Viana-Soto, Alba, et. al., 2017. Assessment of Post-Fire Vegetation Recovery Using Fire Severity and Geographical Data in the Mediterranean Region (Spain), Environments, 4(4):90. Wang, Shudong, et. al., 2018. Estimating the area burned by agricultural fires from Landsat 8 Data using the Vegetation Difference Index and Burn Scar Index, International Journal of Wildland Fire, 27(4):217-227. | |