| Title Natural Hazards in Sacramento | |
|
Author Margaret Champeny American River College, Geography 350: Data Acquisition in GIS; Fall 2018 Contact Information (email: w1661712@apps.losrios.edu) | |
|
Abstract This project is a project with Flood and parcel data of the City of Sacramento. I added a field for the flood data into the parcel layer, so the user can lookup the flood or fire hazard of a parcel just using the address or APN. This can be used to check what flood zone a parcel is in, check proximity to flood areas or even make a map of potential areas to purchase. The FEMA data has a range of flood hazard codes, and a lookup table is needed to understand most of the codes. I hoped to make a succinct map that made it easy for homeowners to look up their flood risk based on the FEMA flood risk designations and fire hazards. I included parcel information, to which I added the FEMA risk code in a new field. This made it easy to find the data just based on the attribute table. I also included flood risk layers in order for the user to visually look for a location on the map and see where the nearby risks were. It is important to be able to access this information in an easy way, as many areas are in flood zones despite being far from rivers. | |
|
Introduction Sacramento is a in a highly desirable location in northern California. It’s proximity to the American and Sacramento rivers, Lake Tahoe and other sightseeing locations make it a popular place to live and for tourism. However, it’s prime location also mean it highly susceptible to natural hazards, such as flooding and wildfires. Due to the high population of Sacramento and the surrounding areas, if a large scale natural disaster happened there would be a large number of people affected. Theis project will utilize data from the tool “MyHazards”, which is ran by the Governor's office of emergeny services, as well as data from FEMA and Cal Fire to investigate hazards to the Sacramento metropolitan area. | |
|
Background GIS and general analysis of spatial data has been used for a wide variety of natural hazards for a long time. Many governmental agencies from local city offices to federal organizations use spatial data and GIS applications specifically to explore hazards from the environment. However, due to the complex nature of maps and spatial data information on hazards is not always readily available to the public in a way that an unexperienced person can understand and utilize. Or if the data is available, the public often does not take natural hazards into account when making important decisions, like buying a home. | |
| : FEMA tries to track all data of flood risks where people are living in order to direct where people build. Many neighborhoods in flood prone areas have high population. This issue is complex because we cannot demand people leave their homes and communities based on natural hazards. Despite best efforts an estimated 41 million americans live in flood zones according to the YaleEnvironment360 group (YaleEnvuronment360) . . More public data that is easy to use is needed for the public to be able to make informed decisions. This issue is often highlighted when flooding or fire occurs, because we “can build roads anywhere, allowing cities to sprawl, overlooking warning signs such as floodplains or hurricane surges” Masumoto, David Mas 2017. |
|
|
Methods I did background research using the tool “MyHazards” to look at potential risks in Sacramento area. Based on this research I determined that flood and fire risks would be the best natural hazards to examine for this project. Flooding risk in much of Sacramento area, and due to the numerous fires in California recently information about fire risk is more important than ever. | |
| I first collected the Sacramento parcel layer, which I did a query definition on to only show properties in the City of Sacramento in order to limit my scope. I decided to add a field for the flood hazard code onto the parcel layer to make the parcel layer have more information. In order to add flood information into the parcel layer, I had to find the flood layers on the FEMA website. You can either find that data on the open data catalog on the FEMA site or look it up for a specific area using the FEMA portal and finding the FIRM panels necessary. I also found state fire data on the CalFire website. Once I had the data I needed, I did a process where I selected by location for a certain flood type, then once a selected set was found I calculated the field in the parcel layer to add the new data. Based on the maps that were created, I decided that static maps would not be very helpful, and a web map application would be more suitable. |
|
|
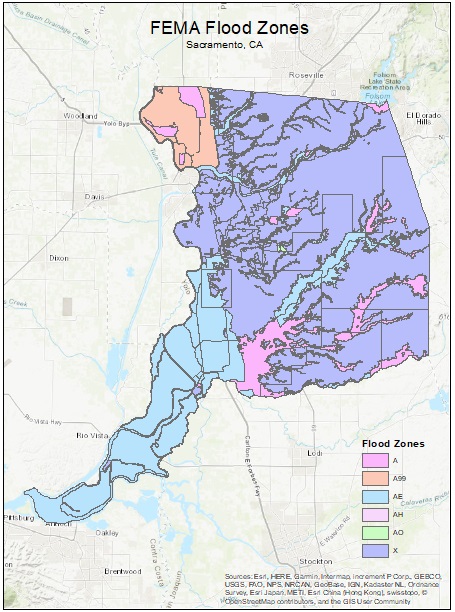
Results I found that most of the city of Sacramento is in some flood zones,
though the majority of it is in the “X” flood zone which means “Area of moderate flood hazard, usually
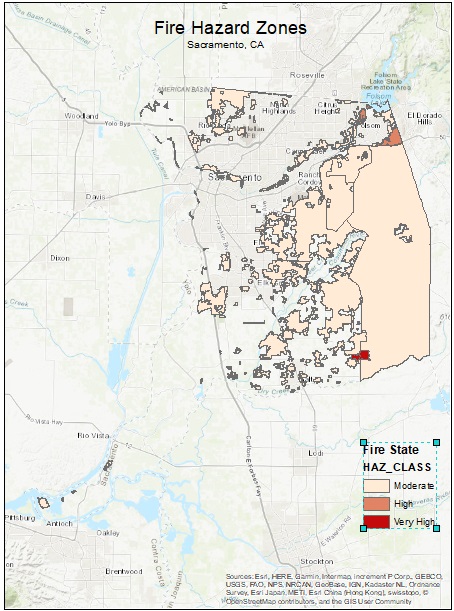
the area between the limits of the 100-year and 500-year floods.” FEMA, 2017.About 163,000 parcels are included in this “X” range. Only 71 parcels are included in the “A” zones (Areas with a 1% annual chance of flooding and a 26% chance of flooding over the life of a 30-year mortgage) The fire hazards in City of Sacramento were surprising, in that there is only a small area designated as “very high” fire hazard. The majority of the internal part of the city is not marked as having and fire hazard zones. | |
|
Figures and Maps | |
 |
|
|
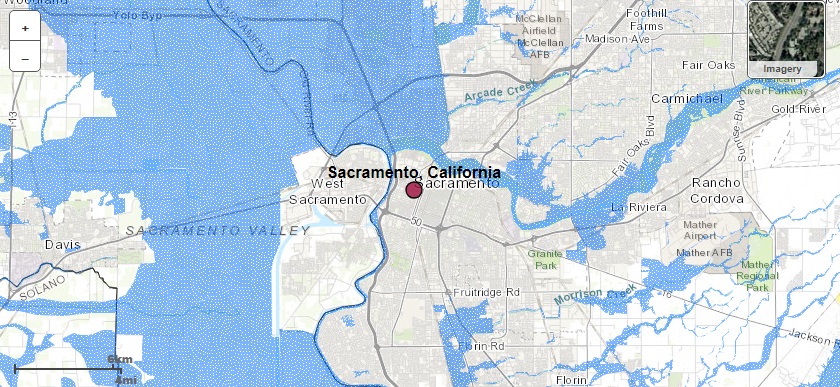
Above is an image of MyHazards application. This shows only the "A" risk zones for flood | |
 |
|
|
Analysis Most of the city of Sacramento has some type of natural hazard.
There are several rivers running through the area, increasing the proximity of flood zones to high
population areas. In addition to this, the presence of fire danger is increasing in northern California
due to the drought and other environmental conditions. We have seen fires rip through urban areas,
so being wary of fire in any community is a necessity. | |
|
Conclusions Everywhere in California has natural hazards, however many people
do not know where the flood and fire risks exist in their communities. The average person might not know
where to find the information that would allow them to make smart decisions about their homes and community.
Allowing the public access to tools and information about the hazards they may face in the future.
Creating tools and maps that allow for the public to quickly access this spatial data and be informed is
vital. Steps such as cutting back vegetation and raising houses could help with damage caused by these
hazards, but people need to know the risks in order to make these decisions. Public knowledge could
increase awareness, and can even lead to changes in local legislature. | |
|
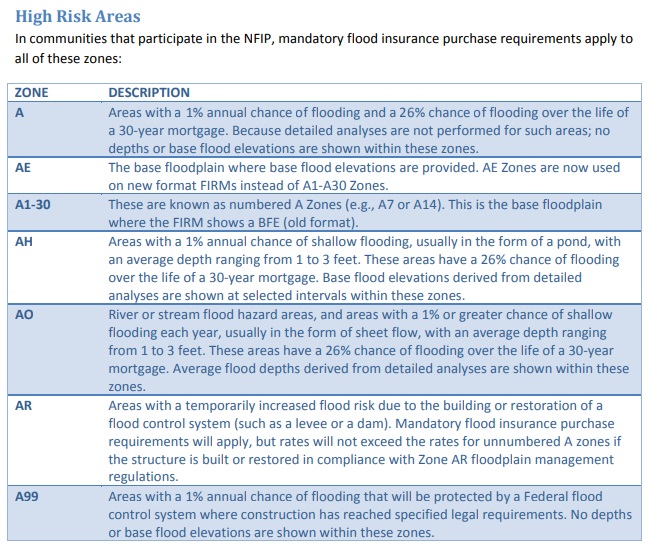
References Literature cited. : FEMA. “Flood Zones.” Emergency Support Function Annexes | FEMA.gov, www.fema.gov/flood-zones. |
|
|
“Masumoto, David Mas. “Why Do We Forget Nature until Natural Disaster Strikes?” Sacbee, The Sacramento Bee, 17 Sept. 2017, www.sacbee.com/opinion/california-forum/article174102851.html." . |
|
|
“Yale Environment 360. “41 Million Americans Live in Flood Zones -Three Times the FEMA Estimate, Finds New Study.” Yale E360, e360.yale.edu/digest/41-million-americans-live-in-flood-zones-three-times-the-fema-estimate-finds-new-study.", 1(1):5-23. |
|