| Title Bald Eagle Territories Web App | |||||||||||||
|
Author Kevin Pinaglia American River College, Geography 350: Data Acquisition in GIS; Fall 2018 | |||||||||||||
|
Abstract The purpose of the “Bald Eagle Territories” or BET app is to enable the user to go out into the field, survey the BET of interest and report back their findings. Lets start out with the Web Map on ArcGIS Online. The web map has two feature layers that work together when clicked in the right spot. First when clicking or activating the push pin symbol the user gets a pop-up that shows the year discovered, owner/surveyor name, and a link to take the survey at the Survey123 website. The survey is pretty short in nature but has some required items, date of survey and location name come to mind. The other feature layer to the map is called California County Poly. This layer can be activated or deactivated and once the user clicks on a county you get the name of the county. The Web App is the jewel of this project with the user having access to a multitude of widgets and base maps to choose from. As mentioned above all the functionality of the web map can be found in the web application. The first widget is the “measure” tool where the user can measure distances in miles from one point to another. The second widget is the “filter” tool, which enables the user to sort by Year Discovered, type in the year range and only those selected will be displayed on the map. The third widget is the “Near Me” tool with an option to type in a county or if you know a Bald Eagle Territory then it will display a radius of what is near the user. I find this tool to be good for dropping a pin by clicking on the map then it will display a radius of what is near the user. The fourth widget is the “Query” tool, which I have set up with three specific queries to ask the app. The first is the Bald Eagle Surveyor/ Owner option, this will display all of the owners by name and once clicked will highlight that territory. The second query is Bald Eagle Territories Water Type here you choose from a drop down list the water type, for instance “ocean”, and all of the territories with that type of water will be displayed. The third query is Water Elevation, here the user selects from a drop down list the elevation desired and this territory will be displayed. The fifth widget is the print option for printing the map or filter, query or near me selection from the web. On the bottom of the map there is a tab that once clicked shows the attribute tables for the Bald Eagle Territories and California County Poly for a more in depth understanding of the attributes that make up this web application. There is functionality to zoom in and zoom out and default extent of the map and my location locator on the left side of the application. On the right side the user can find the standard legend and layers list. In conclusion I would hope that some people use and find the app to be informative in the way that it presents locations to be visited by the avid Birder. | |||||||||||||
|
Introduction In this project I intend to make a web app that focuses on Bald Eagle Territories within the State of California. The problem is for anyone interested in viewing a Bald Eagle it is hard to find places to do so, this app provides a one stop shop for finding places to visit. The approach I will take is one from one of my previous classes where I was taught how to make or author a web app using ESRI Online. To view the app (Go Here) | |||||||||||||
|
Background This article focuses on the opportunities for the public to view bald eagles in their natural habitat throughout the year. The article states that eagles can be viewed around lakes throughout California and in some cases can be seen in open rangeland such as crop fields or fallow ground. It is said that the eagles fly south to California during the winter months of February until April then return to their homes for the summer months. It is known that the largest population of bald eagles resides in the Klamath Basin area of Northern California. One survey counted up to 1,000 eagles in California during the winter months according to a state agency. The places where it is known to be good eagle viewing is around lakes and reservoirs where fish can be caught for sustenance by the eagles. This summary was cited at the California Department of Fish and Wildlife’s website: California Department of Fish and Game, 2018, Wildlife Branch-Non Game Wildlife (California Wildlife) | |||||||||||||
| To the right is the web app design.As you can see there are plenty of Bald Eagle
Territories to investigate. |

| ||||||||||||
|
Methods First I started out by searching the web for data to include in my project, but it soon became clear that data on Bald Eagles is hard to come by. I then remembered the class I had before in which we talk about and analyzed these territories in depth. Also the data was right there on my USB for the taking staight from The California Department of Fish and Wildlife. | |||||||||||||
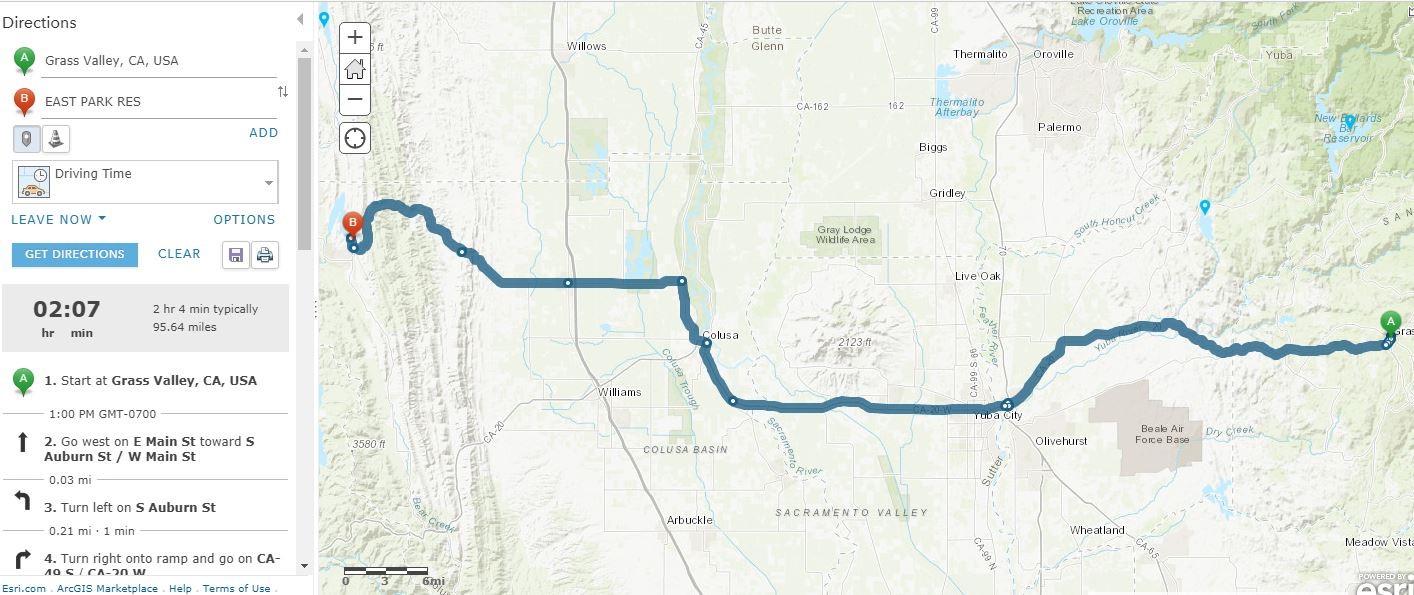
| Next I will walk the user through all of the widgets and functions of the app. Above is the directions button, found in the pop-up once a location that is recognized by one of the layers is selected. This can show the user how to navigate between locations within the layers of the map. If a user would like to find directions from their house to a bald eagle territory, then select the territory and click on the directions link within the pop-up. All that must be entered are a starting point and an ending point. Another link within the pop-up is the “Take the Survey” hyperlink. This will take the user to a survey created specifically for users visiting the Bald Eagle Territories and that wish to provide some information about their visit. I should add this type of survey is only available online from survey123 through the pop-up option. Below is an image of the survey; some questions are required while others are not. I have also added an option to add a photo to the survey, this should be a photo of the territory or close proximity of. There are some questions that are not shown in the image which are, “area description” where it has a 100 character limit, “camping nearby”, which is a drop down type selection menu, and “overall rating”, which consists of one through five thumbs up review. A useful widget is the “Measurement” tool. This can measure area, distance (multipoint), and location, which provides a latitude and longitude starting point with a drop pin. It has the option when setting the widget for meters or miles, I chose miles because we are in the United States. This tool could possibly be used to find distances from one Bald Eagle territory to another or multiple territories if one was planning a weekend trip. The area function could be used to find the footprint of a territory. Location can be used in conjunction with a GPS unit when offline. Here we have the “Filter” tool, which is useful for selecting territories by year. To select only one territory, you would type the same year in both spots above. To select multiple territories, you would type a range of years as shown above. This too has a hint below the first year to be typed in, these are the actual years that the territories were discovered in California. The “near me” tool is handy because it will show you all of the territories close to the location marked by the red pin. This can be adjusted for a certain distance close to the pin up to 15 miles in circumference. As you can see the list is below the miles slider, all you have to do is scroll through the list and select the territory of interest and it will be highlighted on the map. To find a place near you by typing in a name you must be familiar with the data and know exactly how it has been created to find a certain place that way. Familiarity with the data can be achieved by selecting the tab at the bottom of the map and reviewing it there. This area of the map will be discussed later in the report. The “Query” tool is useful for finding answers to predetermined questions. I have set up three for us to look at. The first question is “Bald Eagle Territories Surveyor/Owner”, this gives a list of all the owners in California who wish to be identified. From this list you could select an owner and see how many territories they own, it may be only one or many. The second Question that is set up is “Bald Eagle Territories Water Type”, this implies if it is ocean, lake, reservoir, or river. This can be selected via a drop-down menu and the water type and territory will be highlighted on the map. The third question is “Bald Eagle Territories Elevation”, this will select territories for a certain elevation, although the user must know exactly what elevation they are looking for or it can be selected via a drop-down menu. Once used the territories for a certain elevation will be displayed on the map. The “Print” tool lets the user print the map or extent of the map with features selected or not. This function enables the user to use a multitude of format options, which I am unable to show here. The Layout is the same thing that you would find in the printer settings menu on your home computer with different paper sizes and settings. The attribute table tab at the bottom of the app. A user could investigate a territory more here and see the data as it is represented on the map. If desired a territory can be selected through the attribute table and then it will be selected on the map. This would be a good area to select a county in the “County Poly” layer and investigate what Bald Eagle Territories are present. |
| ||||||||||||
|
Results I decided to use data from a previous class titled "Lupo Data".
In this folder there are all kinds of file from "County Poly" to "Major Roads" and "BE Territories".
These are the layers that I used for the project so I didn't have to really spend a lot of time searching since I had it anyway.
The presentation of the layers are in the form of the web app that can be viewed at ESRI Online.
The format I used I think is pretty straight forward with widgets that can be helpful to the viewer.
| |||||||||||||
|
To the left you will find Northern, Central, and Southern California accrossed the top of the table.
The numbers below indicate how far the BE Territories are from Sacramento, CA. The distance is from near, medium amd far, from top to bottom.
| ||||||||||||
|
Figures and Maps Below you will find a map of one of the tools for use in the web app. | |||||||||||||
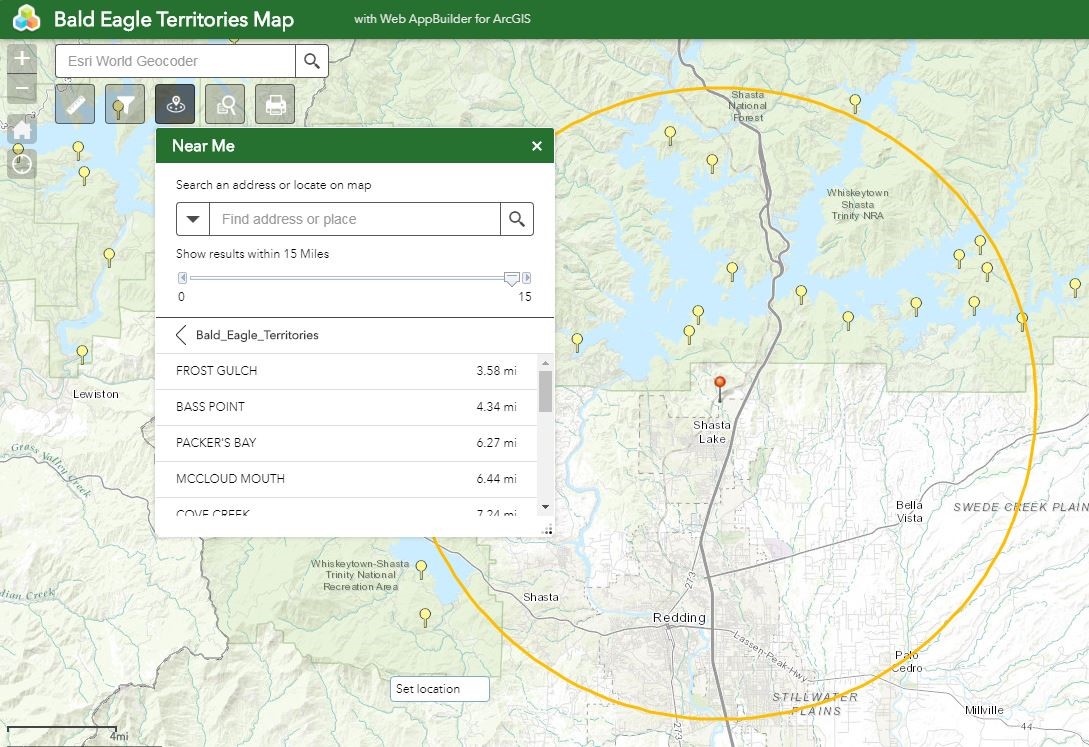 |
To the left you find the near me tool. This tool is used to find bald eagle territories near your location. It also shows what counties you are close to. | ||||||||||||
|
Analysis The purpose of this project was to create an app for use
by the puplic, this was successful. All of the widgets mentioned work as advertised and should be pretty
informative to the user. I found it difficult to create because of the multitude of layers that could
be added. For instance, you could add a "hydrology" layer to show what water types the BE is close
to.This layer was of course in the "basemap" but doesn't show all of the proper names.
| |||||||||||||
|
Conclusions One option I have in the app is to provide a survey of the visit.
The survey can only be completed while connected to the internet. It would be nice to be able to provide
a survey that could be completed offline, since most areas of interest are out of connectivity range.
| |||||||||||||
|
References Tom Lupo, 2017, Intro to Applications of GIS, American River College | |||||||||||||
|
Appendices | |||||||||||||