| Title Land cover change in Las Vegas, Nevada between 1980 - 2018. | |||
|
Author
Justin SweetnamAmerican River College Geography 350: Data Acquisition in GIS (Fall 2018) W1488527@apps.losrios.edu | |||
|
Abstract
The purpose of this project is to determine the land cover in the city of Las Vegas, Nevada within in Clark County, Nevada, United States. The city was established in the early 1900's and continues to grow to this day. With more growth expected in the future, the rise of urban development and decline in agriculture and bare land is becoming a concern in Clark County, Nevada. I have found two articles that focus on urban land uses and population growth of Las Vegas, Nevada. To sum up those articles, the city of Las Vegas, Nevada and surrounding areas are growing enormously and space for growth is becoming limited. With the use of graphics and satellite imagery, this project will show the urban growth from the 1980 to 2018, showing users a change over time.
|
|||
|
Introduction
The purpose of this project is to determine the land cover in the city of Las Vegas, Nevada within in Clark County, Nevada, United States. The city was established in the early 1900's and continues to grow to this day. With more growth expected in the future, the rise of urban development and decline in agriculture and bare land is becoming a concern in Clark County, Nevada. This project will show the urban growth from the 1980’s (using Landsat 5) to 2018 (using Landsat 8).
| |||
|
Background
I have found two articles that focus on the urban land uses and population growth of Las Vegas, Nevada. The city and surrounding areas are growing enormously and space for growth is becoming limited. It will be a matter of time before the city of Las Vegas starts running out of parcel development. They may have to start thinking about building upward.
According to George Xian, Analysis of Urban Land Use Change in the Las Vegas Metropolitan Area Using Multi-Temporal Satellite Imagery .In the last fifty years, urban development has grown enormously in Las Vegas, Nevada. By using satellite remote sensing data and digital orthophotography to measure changes in urban land use, a sub-pixel detection method was used to map the urban area and its chronological changes by figuring out sub-pixel level areas that have invulnerable surfaces (“Xian”). Between the 1980’s and 2000’s, sub-pixel percentages of unused areas are mapped using a relapse model for tress. The same approach was used for the spatial temporal distribution of vegetation in the urban areas. The study shows that spatial and temporal changes in isolated areas are useful signs of spatial extent and intensity. The outcome of these methods results in “40-60% imperviousness have experienced the largest increase” in Las Vegas (Xian). The smaller vegetation areas have the highest coverage in the medium urban areas that are dense. This tells us those areas of medium to high development of the main urban land has the most impact. With change in urban land use brings up other environmental concerns such as water consumption and maintenance to help with the growth of a city. The next article focuses on Las Vegas’s concerns and propositions on obtaining more groundwater. According to James Deacon, Fueling Population Growth in Las Vegas: How Large-Scale Groundwater Withdrawal Could Burn Regional Biodiversity, the city of Las Vegas, Nevada is in dire straits for more water supplies due to its booming growth. City officials are working to acquire nearly, “200,000 acre-feet per year from a regional groundwater aquifer extending from Salt Lake City, Utah, to Death Valley, California” (Deacon). If approved, these new permits would cause a drop in groundwater across 78 basins, which cover 130,000 sq. km. In the past, water decisions have taken economic development as a public interest than maintain natural resources. If economic development continues to surge choices, it would result in major declines in the “water table, spring discharge, wetland area, and streamflow will adversely affect 20 federally listed species, 137 other water-dependent endemic species, and thousands of rural domestic and agricultural water users” in and near surrounding areas (Deacon). Figuring out to diminish water intake and create profitable technology, would allow the city maximum relief within its resources. | |||
|
Figures and Maps
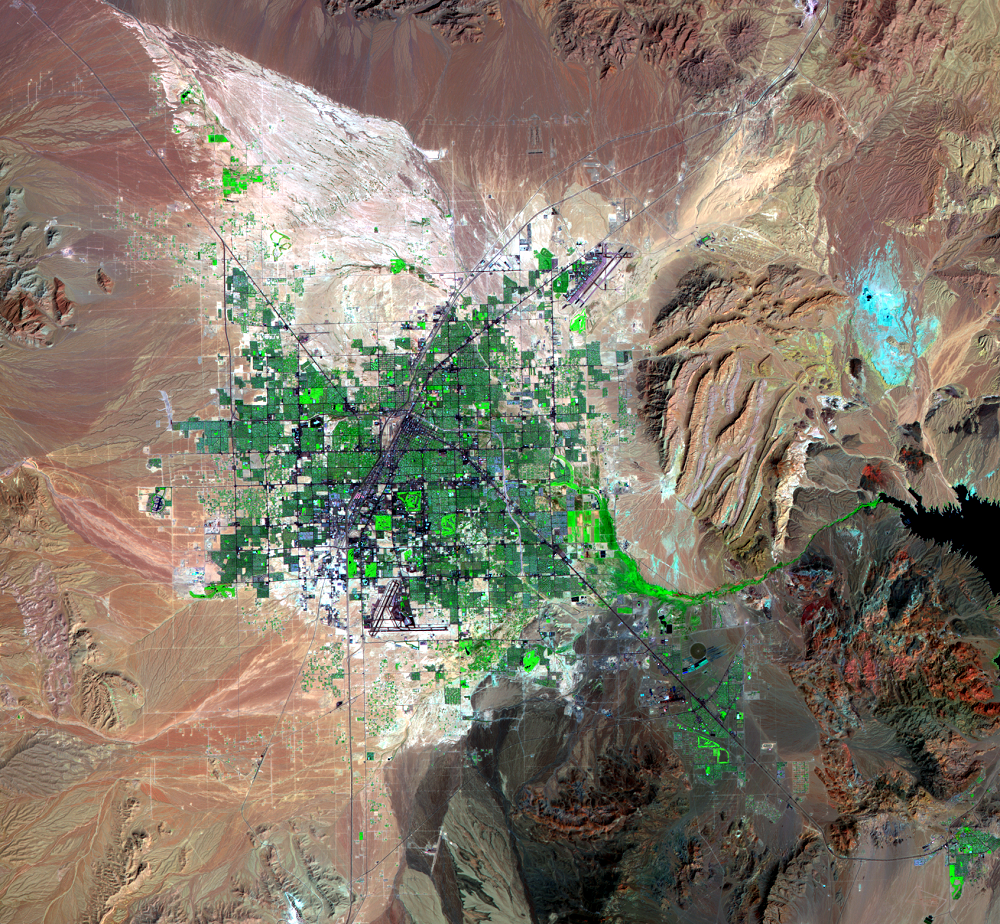
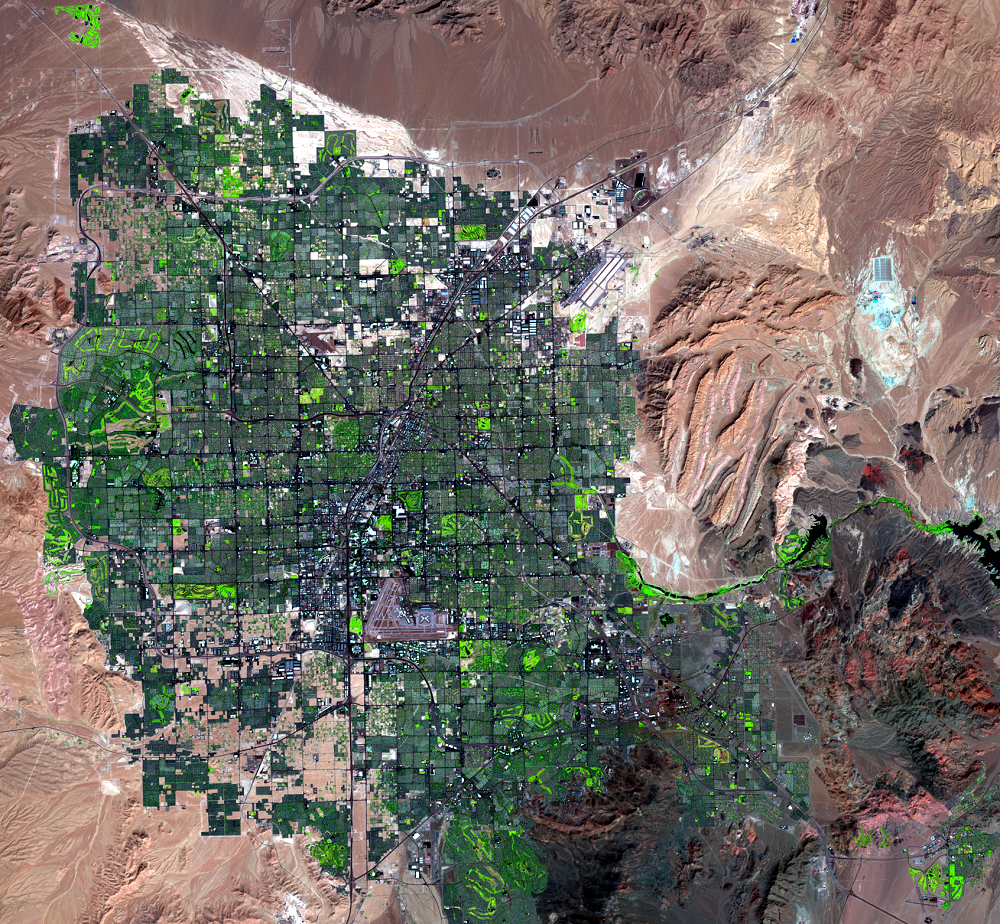
These two images show the progression of Las Vegas, Nevada. The image on the left is taken from Landsat 5 on August 10, 1986 and the image on the right is taken from Landsat 8 on August 18, 2018. In the past 32 years, it has exploded in development.
| |||
|
|
||
|
Methods
I heavily relied on USGS Earthshots and USGS Earth Explorer to help me gather the imagery used in this project. I kept my topic and search results narrow, since the data is very rich and wide in this area of interest I pursued. I only focused on Population Growth in Las Vegas, Nevada and Urban Development in Las Vegas, Nevada. Even so, it was a lot of information to skim through until I was able to find what I wanted to present. I even used Google scholarly articles to help support my findings. They are the two stories, which are in my Background section. I even used Microsoft Excel to build a table and create a line graph to provide more visuals, which support the Annual Growth Rate over time. Once I was able to gather enough information, putting it all together was not as difficult as originally planned.
| |||
|
Results
The graph on the left shows changes in Population, Growth and Annual Growth Rate percentage between the years of 1980 and 2017 for the city of Las Vegas, Nevada. The Line Chart on the right, created in Microsoft Excel, shows users a visual of change over time. Its values are taken from the data displayed on the left side. You will notice the "Year" column is in increments of 10 years, before it is displayed annually at 2011. Looking at the data, you will notice the Annual Growth Rate for Las Vegas, Nevada is in a decline again. Only time will tell if we see a growth get as high as it did back in 2000.
|
|


|
|
|
Analysis
Based off the research that I have gathered, there are quite a lot of changes being implemented in order for the city of Las Vegas, NV to maintain their urban growth. From maintaining their groundwater to collecting more water somehow and balancing to maintain their growth in urban development will be an ongoing challenge. But the future seems bright for this city. Future research is always encouraged for cities outgrowing their regions, such as Las Vegas, Nevada.
| |||
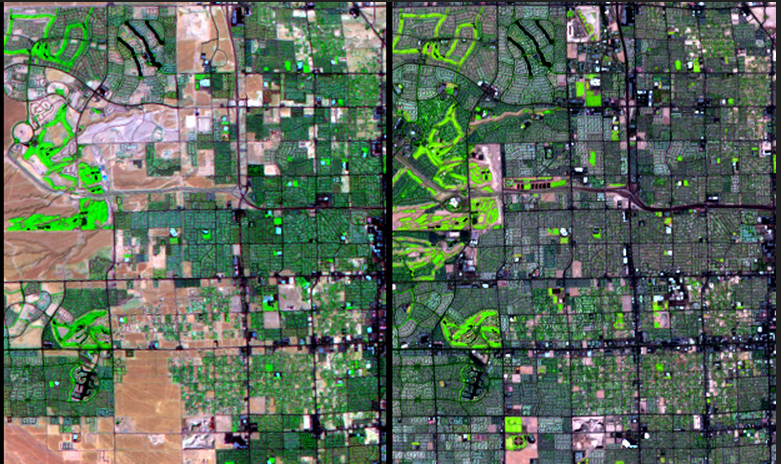
| The split image, on the right, shows us a before and after of how fast land use is changing in a span of 21 years. The image split on the left was taken in 1992 and the image split on the right was taken in 2013. This is just a small section of parcels demonstrating the fast growth of urban development. |
|
||
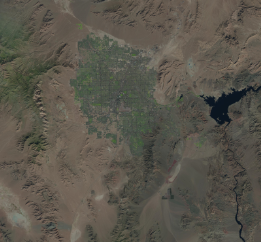
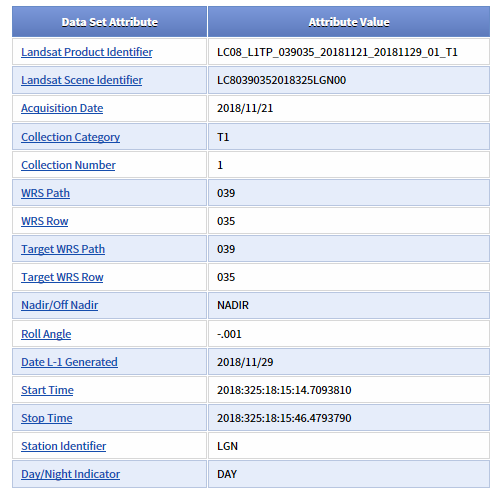
| The image on the left was taken from Landsat 8 and focuses on Las Vegas, Nevada. The Grid Cell Size Reflective is 30 for this image. The UTM Zone is 11 and the Datum is WGS84. The image on the right is metadata that supports the image. It shows the viewer what time the image was taken, if NIDAR image was used, WPR Paths, Target Parths and much more. | |||
|
|
||
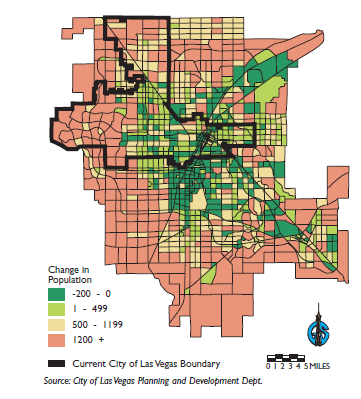
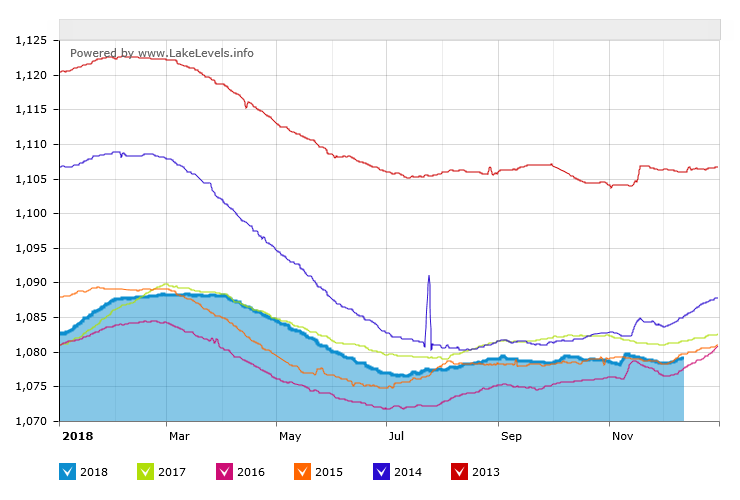
| The map, shown on the left, focuses on Baseline Valley Population Growth between the years of 2000 through 2020. The black outline, on the map, is the current city of Las Vegas Boundary. About half of the city boundary is estimated to change in population by -200 to 0. Keep in mind these are projected numbers. The line graph on the right, provided by Lakes Online, shows water levels from the past 5 years (2013 to 2018). There is a major concern in current level averaging at 1,090 cubic square feet right now and projected dropping. | |||
|
|
||
| With the projected population growth for Las Vegas, Nevada, there are concerns with maintaining the water levels from Lake Mead. Lake Mead water level is approaching its lowest elevation level since 1956 (1083.19 cubic square feet). Lake Mead is Las Vegas's primary source for water which receives the majority of its water from snow melt in the Colorado, Wyoming, and Utah Rocky Mountains. In the past 37 years, the total change in water levels for Lake Mead has dropped to 118.75 cubic square feet for low elevation and 115.25 cubic square feet for high elevation levels. With the population expecting to reach about 800,000 people by 2020, Las Vegas may have to find another water resource soon. Only time will tell if Lake Mead can keep maintaining Las Vegas water consumption. | |||
|
References
Deacon, James E., et al. “Fueling Population Growth in Las Vegas: How Large-Scale Groundwater Withdrawal Could Burn Regional Biodiversity.” OUP Academic, Oxford Academic, 1 Sept. 2007, academic.oup.com/bioscience/article/57/8/688/284727. Accessed 16 November 2018. “Earthshots: Satellite Images of Environmental Change.” Iguazú, South America | Earthshots: Satellite Images of Environmental Change, earthshots.usgs.gov/earthshots/Las-Vegas#ad-image-0-0. Goodchild, M.F. and J. Proctor, 1997. Scale in a digital geographic world. Geographical &Environmental Modelling, 1(1):5-23. “Land Use & Land Cover: Toward Scenarios of Change.” GlobalChange.gov, U.S. Global Change Research Program, 13 Mar. 2015, www.globalchange.gov/news/land-use-and-land-cover-toward-scenarios-change. “Las Vegas, Nevada Population 2018.” Total Population by Country 2018, World Population Review, worldpopulationreview.com/us-cities/las-vegas-population/. Accessed 29 November 2018. US Department of the Interior. “Lake Mead Annual High and Low Elevations (1935-2017).” Lake Mead Annual High and Low Elevations (1935-2017), US Department of the Interior, Jan. 1, 2018, www.usbr.gov/lc/region/g4000/lakemead_line.pdf. Date Accessed: Dec. 7, 2018. Xian, George, et al. “Analysis of Urban Land Use Change in the Las Vegas Metropolitan Area Using Multi-Temporal Satellite Imagery.” Analysis of Urban Land Use Change in the Las Vegas Metropolitan Area Using Multi-Temporal Satellite Imagery, 1 May 2006, https://pdfs.semanticscholar.org/cdbe/432e6f4fa01abc8c46284bd5b148470f39e2.pdf. Accessed 14 October 2018. |
|||
|
Links
Metadata: Las Vegas |
|||