An
Illustration of Urban Sprawl
In Northern
California
Carol
Clark
American River College
Sacramento, California
Geography 26: Data
Acquisition in GIS, Fall 1999
ABSTRACT
Analyses of aerial photos, landuse maps and satellite
images show a tremendous change in northern California in this century. The
area between Sacramento and San Francisco that was once uninhabited, grassy
hills has become one solid urban corridor. The Sacramento metropolitan region
has grown by over 700,000 people in only 28 years. Since 1959, the northern
part of Sacramento County has lost prime farmland to uninterrupted urban
sprawl. Population in the area has grown by a factor of 13 in the last 40
years.
INTRODUCTION
Northern California is one of the fastest growing
regions in the country. The object of this paper is to illustrate the rapid
urban growth in this part of the country by focusing first on the large
territory encompassing the San Francisco Bay Area and Sacramento Valley, then
narrowing the examination to the Sacramento region and finally, observing the
changes in a small area in the northern part of the county.
BACKGROUND
“California's population is expected to exceed 51 million
people by the year 2030 -- the equivalent of adding five cities the size of Los
Angeles to our current population”(PCL, 1999). Overpopulation in America is not
a new topic of study or discussion. But one of its effects has become a subject
of serious concern. The addition of 32 million people to the state of
California since the turn of the century has created the phenomenon known as
“urban sprawl”, an unchecked devouring of wide open spaces by tract homes,
strip malls new roads and water, gas and sewage lines. Runaway sprawl causes
traffic congestion and air pollution, threatens our water supply, uses up prime
farmland and disrupts or destroys valuable wetlands and wildlife habitats.
California is a state of exquisite natural beauty, but this beauty, which has
long been one of our state’s prime attractions, is threatened by our current
and predicted population growth.
METHODS
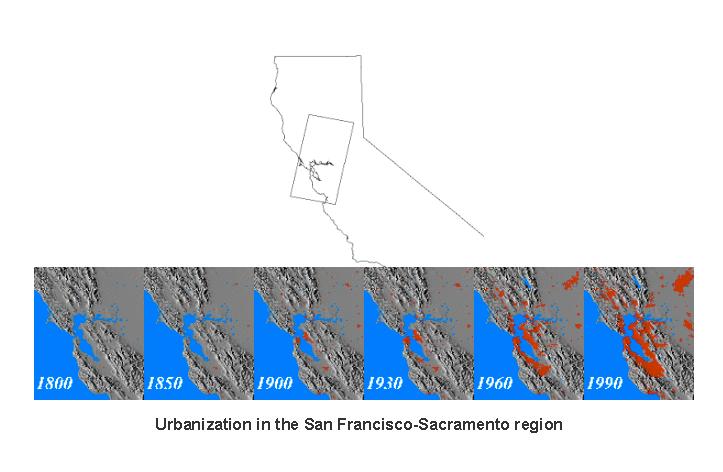
Satellite images
These
images were downloaded from the United States Geological Survey (USGS) website.
The USGS has developed a method to document the urbanization of the large
metropolitan regions in the San Francisco Bay Area and Central Valley (USGS,
1999). By compiling, analyzing and manipulating historical records, USGS
topographic maps, aerial photographs and Landsat imagery in a GIS, data layers
were created depicting the tremendous urban growth over a 190 year period.
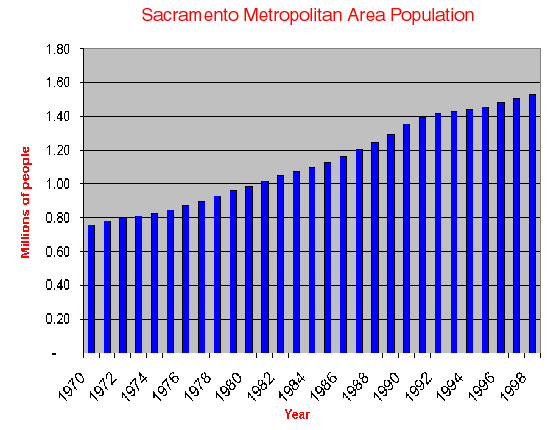
Population graph
This
graph was derived from a table compiled by the Real Estate Center at Texas
A&M University (REC, 1999). Downloaded from their website, the table was
converted to an Excel spreadsheet and reworked into a chart showing population
growth of the Sacramento region in a 28 year period.
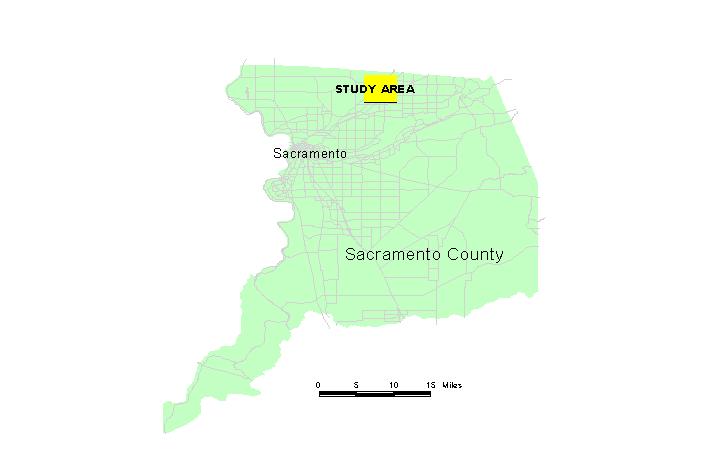
Aerial
photographs
The study area
of the photos encompasses a 3.4 square mile area lying within the northern part
of Sacramento County, bounded loosely by Antelope Road on the north, Greenback
Lane on the south, Watt Avenue on the west and Auburn Blvd on the east. Black
and white 9”x 9”, 1: 24000 scale, aerial photo tiles of the study area were
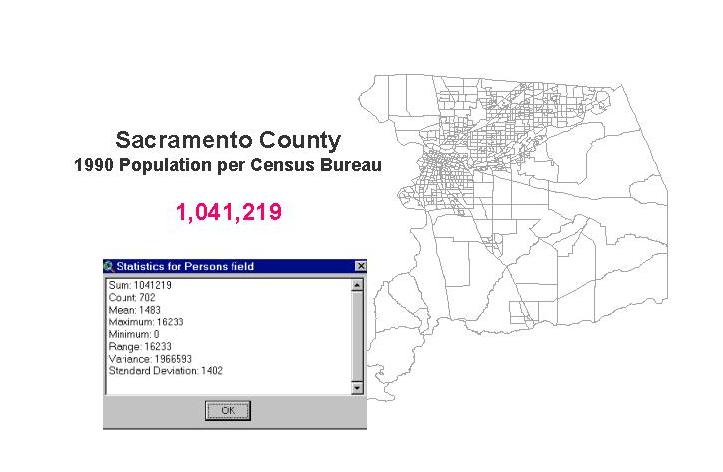
scanned, saved as JPEG files, then imported into ArcView. A U.S. Census Bureau
TIGER shapefile of Sacramento County roads was added as a theme to the project.
Using Image Warp, the images were “rubber sheeted” to the census roads and the
section of roads corresponding to the study area were selected and saved as a
new shapefile. A shapefile of Sacramento County demographics was also
downloaded from the Census TIGER files and a statistics display showing total
persons for the study area was created.
Landuse Map
An ArcView shapefile from Sacramento County land ownership
records was opened; the study area records were selected and converted to a
shapefile; then a query was run, selecting agricultural and residential landuse
codes.
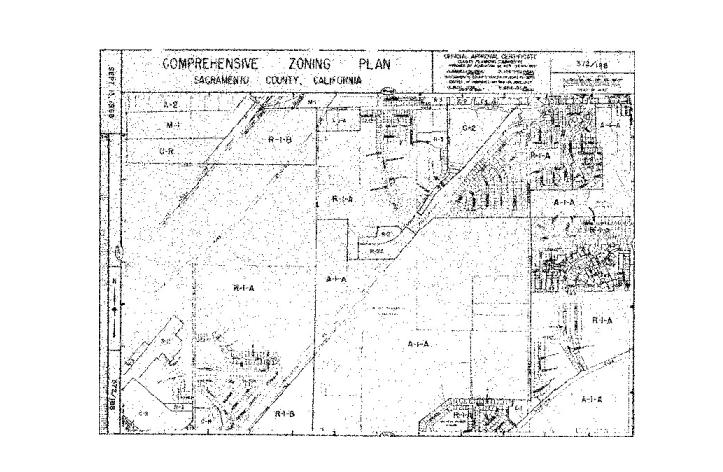
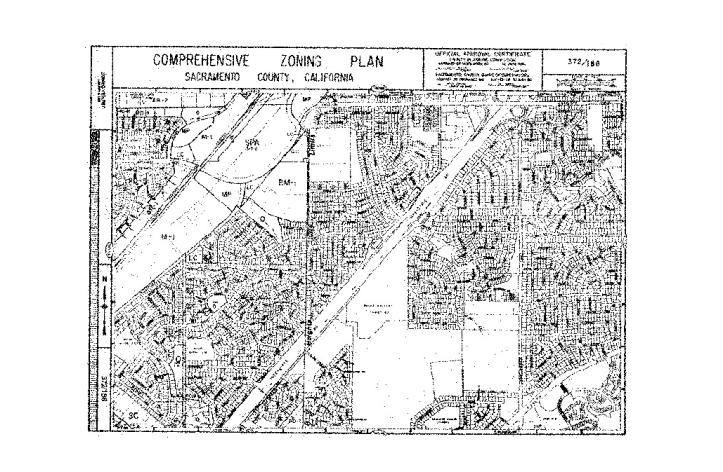
Zoning Maps
Paper
maps obtained from the Sacramento Planning Department were scanned and saved as
JPEG files.
RESULTS
The red in these images represents urbanized areas. Once considered
to be two separate urban areas, the Bay Area and the Sacramento Valley have
become one large urbanized corridor. “As roads and other forms of
transportation became more developed, the migration of middle-income residents
from the central city to the suburbs steadily increase…” (USGS, 1999)
Based on the figures
in this graph of population
growth, the Sacramento area alone has increased by an average of over 26,000
people per year in the last 28 years. Statistics from the census bureau show Sacramento
County’s population to be over one million people by the year 1990.
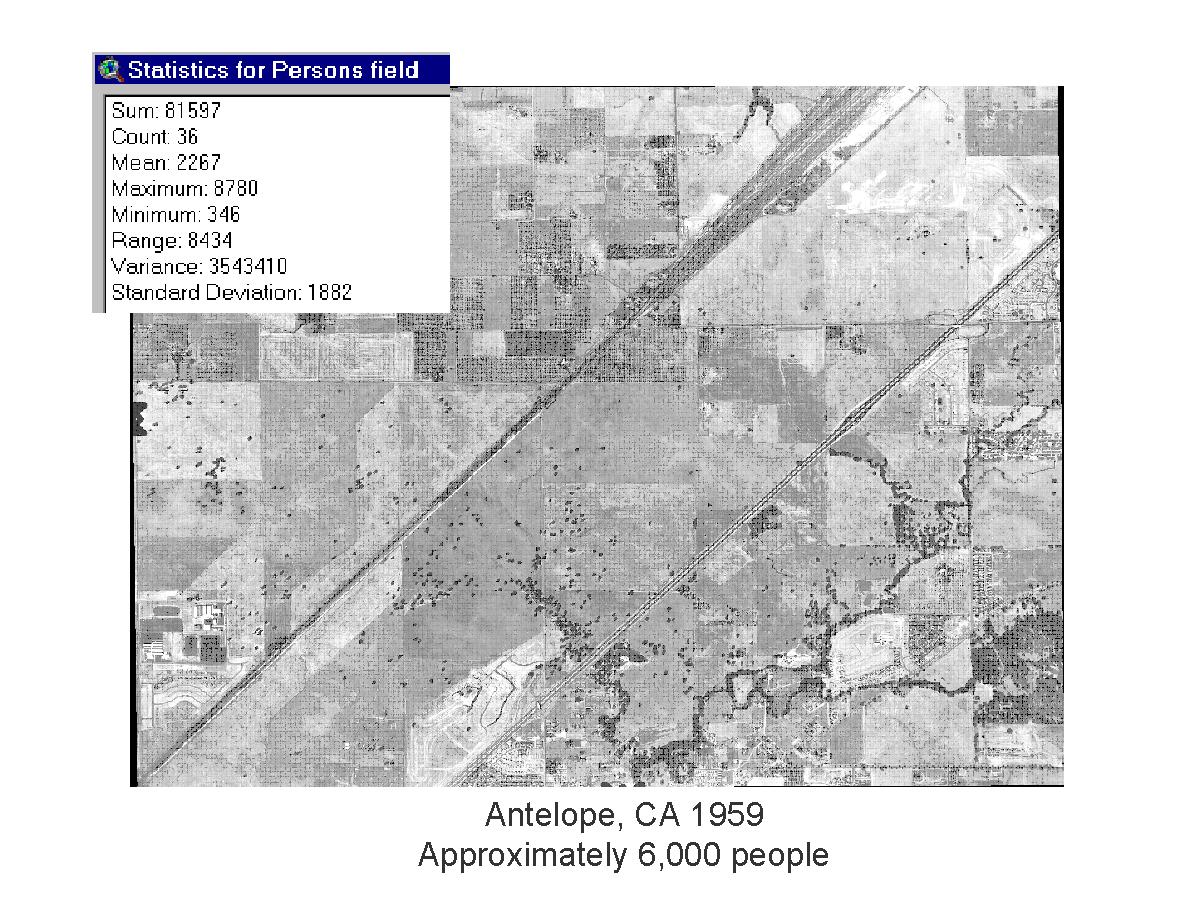
This photo
taken in 1959 of the study area shows a mainly rural environment. Visual
examination of the photograph puts the estimated population total at
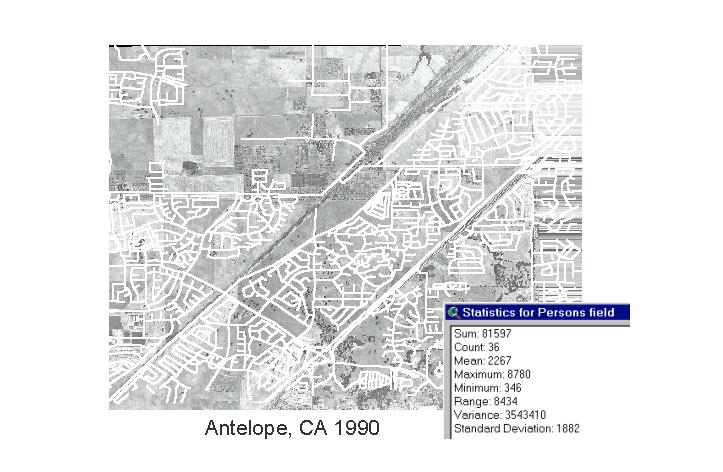
approximately 6,000 people. This image is an overlay
of the 1959 photograph with roads taken from 1990 Census Bureau data.
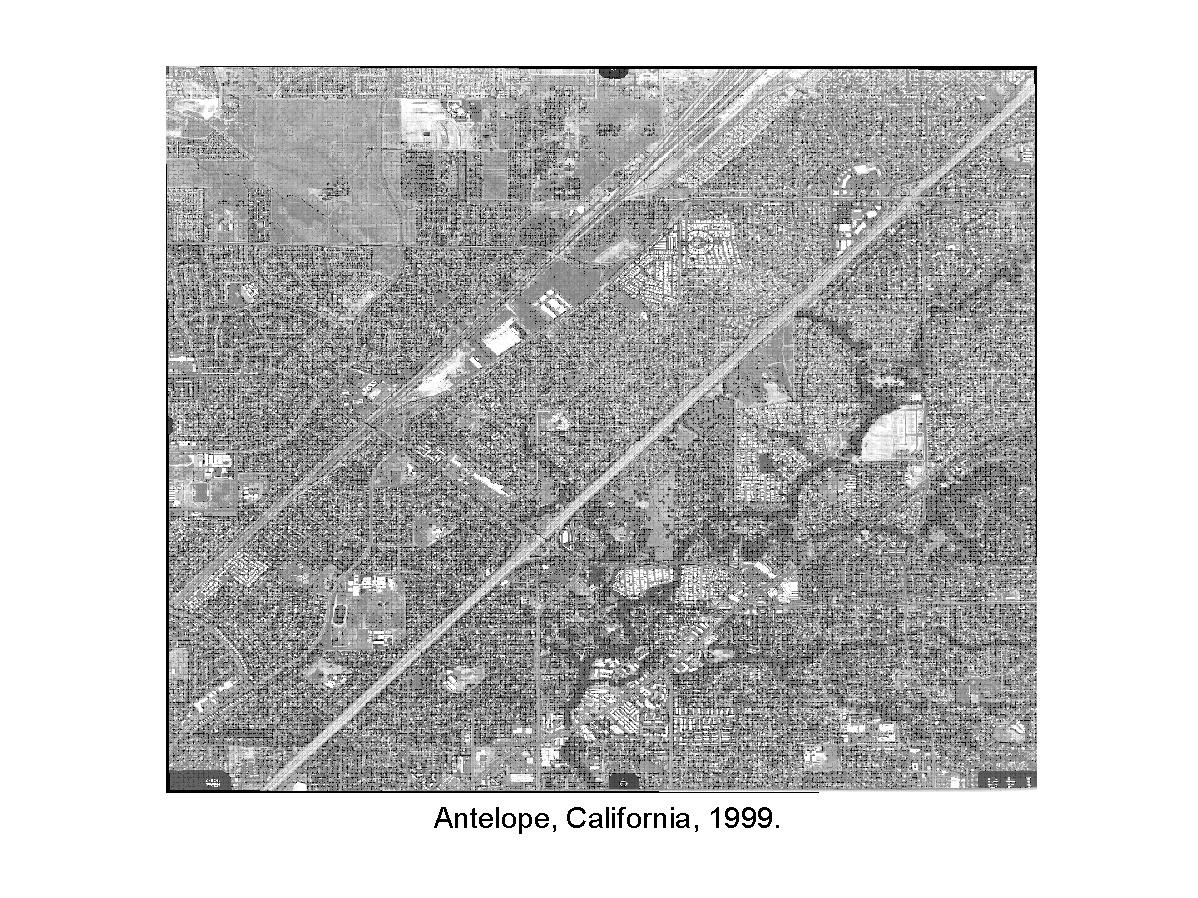
Statistics from the data indicate the population to have grown to over 80,000 people! A
photo of the same 3.4 square mile area in
1999, illustrating the dramatic change that has occurred in 40 years. Farmland
is being lost to urban sprawl at a tremendous rate. “Between 1982 and 1987, the
Central Valley, California’s leading agricultural region, lost almost a
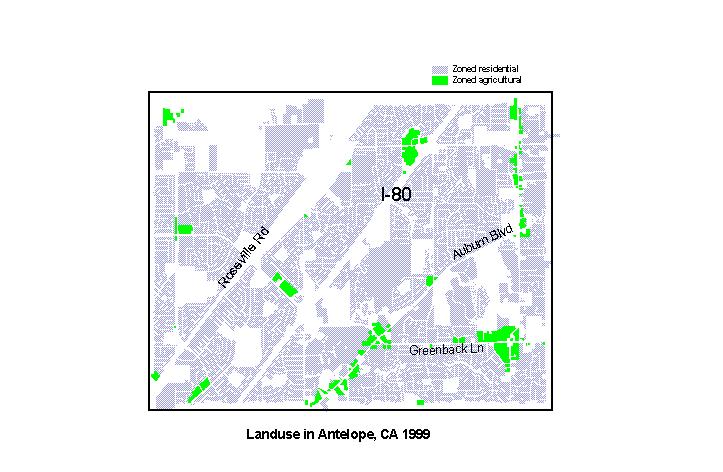
half-million acres of productive farmland.”(Moss & Fulton, 1999). This
ArcView shapefile image, produced from a GIS file of Sacramento
County parcels, also illustrates the few remaining agriculturally zoned patches
of land in the our study area.
This first image of the Sacramento County
Comprehensive Zoning Plan is a map from 1968 (the same study area in Antelope,
CA), illustrating the amount of farmland (Zone A)in the area at the time. In
this second map, it can be seen once again, how little
is left of agricultural use in 1996.
CONCLUSIONS
It
was not many years ago that "getting away from it all" was simply a matter of
packing up the camping gear and the family on a Friday afternoon and finding a
spot at a nearby campground. The campground was only half full by 7:00 pm with
spots even remaining empty for the weekend. Times have changed and reservations
are now required at almost all campgrounds… in advance. Traffic jams in Sacramento
are comparing to those of southern California. The population boom has taken a
toll on California in many ways. Approximately 95 percent of California’s
wetlands have been destroyed over the last 200 years. The state now has the
highest number of candidate and listed endangered species of any other state
and has the worst air quality in the nation. (Moss & Fulton, 1999) We must
act now to curtail the growth, contain the urban sprawl and retain a good
quality of life for our children to enjoy.
REFERENCES
Bell,
Cindy. Acevedo, William. Taylor Buchanan, Janis. United States Geological
Survey (USGS). Dynamic Mapping of Urban Regions: Growth of
the San Francisco/Sacramento Region. http://edcwww2.cr.usgs.gov/umap/pubs/urisa_cb.html (11/21/99)
Real
Estate Center Texas A&M University College Station, TX 77843-2115
http://recenter.tamu.edu/data/popm/pm6920.htm (11/7/99)
Moss,
Steven. Fulton, William. Sponsored by California Resources Agency, Bank of
America, Greenbelt Alliance, Bay Area’s citizen conservation and planning
organization, Low Income Housing Fund. Beyond
Sprawl: New Patterns of Growth to Fit the New California. http://www.rut.com/misc/beyondSprawl.html
(11/1/99)
The
Planning and Conservation League Foundation Restoring
the California Dream: Ten Steps to Improve our Quality of Life. http://www.pcl.org/LEG/renewing.html#ref
DATA SOURCES
Aerial
photos: Cartwright Aerial Surveys, Inc., 1999
Sacramento
County landuse records: Sacramento
County GIS department, August, 1999
Zoning Maps: Sacramento
County Planning department, 1968, 1996