|
Los Angeles Basin Earthquakes
Mardy M. Thomas
Geography 26 –Data Acquisition
Fall 1999
Abstract
Earthquakes are unpredictable natural disasters. Are there any possible solutions for evacuation and supply routes? A study of the Los Angeles Basin reveals multitudes of variables are needed to complete a network analysis of the area. Preliminary results show the southeastern portion of the basin may provide a solution. Future considerations for continuation of the study could include network analysis of the gas and water lines, buildings in the area and geologic data. The end result producing a dynamic GIS that could provide more safety in dealing with an earthquake emergency.
Introduction
Natural disasters occur all over the world in all varieties. California in particular has imbedded within its boundaries a number of fault lines resulting in earthquakes. These natural phenomena have no season. Efforts to predict where they will strike have met with little success. Heavily populated areas have been hit hard, such as San Francisco which has suffered two major earthquakes. Each quake causing death and millions of dollars worth of damage to property. In Southern California, the San Fernando quake of 1971 forced a number of building code changes due to the amount of damage sustained by structures. More recently, the Northridge Quake of 1994 produced damage totaling more than $20 million worth of damage. The infrastructure of the area was hit particularly hard. The rupture area was about 300km˛ damaging many structures. This type of devastation had me asking the question, "Is there a transportation plan for evacuation or supplies?"
The purpose of this paper is to explore the creation of evacuation or supply networks. The study area will be focused in the Los Angeles Basin area. The effects of earthquakes on the area in past quakes will be used in the discussion of these networks.
Background
The LA Basin area historically has been a seismically active area. The first earthquakes were recorded back in the 1800’s. The Fort Tejon quake of 1857 is of particular interest to seismologists today because there has been similar activity in the region to what preceded the quake in 1857. In 1971 the San Fernando earthquake caused enough damage to require the passing of the Alquist Priolo Special Studies Zone Act which was passed in 1972. The purpose of this act is to prohibit the location of most structures for human occupancy across the traces of active faults and to mitigate thereby the hazard of fault rupture. In 1994 the Northridge quake was the first to strike within an urbanized area since the Long Beach earthquake of 1933. It too produced similar results.
In searching for existing plans of evacuation or similar information, my search came up empty. I do believe that the State of California Governor’s Office of Emergency Services (OES) may have something worked out. I was unable to gain access to their intranet site or speak to anyone regarding any plans of evacuation.
The United States Geologic Survey (USGS) has published and continues to work on Hazard Maps for various areas. Each of these maps shows the severity of expected earthquake shaking for a particular level of probability. It is through these maps that the activities of agencies, both government and private, are determined. Federal funds allocated for emergency preparedness are also granted according to these maps.
Historically, earthquakes in the LA Basin area have displaced many people. Earthquakes also leave the uncertainties of unsafe water or broken gas lines. Agencies like the Federal Emergency Management Agency (FEMA) and the USGS have detailed plans spelling out what should be done in preparation for an earthquake, during an earthquake and after the main shock of a quake has hit. The suggestions they present are valid and should not be overlooked.
Methods
Earthquake data is fairly easy to obtain on the Internet. Quality of data is something that constantly has to be looked at. In one offering, a site offered earthquake data which included: Date, Time (based on UTC), magnitude of the earthquake based on the Richter Scale, magnitude type, location of the epicenter (in decimal degrees), depth of the focal point and quality of the location and depth. The user of the site had to know what area of Earth they desired to get information for. There were other options available which I used such as a given time frame and range of earthquake magnitude. Based on the coordinates and other input given, the server would give the data in the previously mentioned format. The site provided definitions to the codes used in the data. The codes denoting things such as what type of energy was dispersed during the event.1
Using the coordinates of 33.4°N to 34.5°N and 116.9°W to 118°W, I obtained the data fitting into the area of the LA Basin. I decided that quakes under 4.5 in magnitude would not be necessary ,given my previous research, because they typically produced little damage. The columns given me had to be evaluated. I had to make sure that all coordinated were given in decimal degrees. Otherwise, conversion would be necessary. This was easily accomplished by scrolling through the data and making sure that there were numbers after the decimal higher than 60. Quality of the location was provided in one of the columns given. Upon further investigation of the definitions, it came to light that the location accuracy could vary as little as ±1km horizontal distance and as much (if not more) as ±5km horizontal distance. The quality was "graded" from A to D based on the deviance. The majority of the locations obtained were rated at ‘A’. There were a few ‘C’ ratings mixed in. The data was then copied to a Notepad and brought into Excel. Using the import wizard, columns were easily constructed to assure the data would maintain its format. In the columns the data was formatted. I learned by sad experience that it needs to be done so as to preserve decimal places and time or date formats. The data was saved as a DBF file and then brought into ArcView as a table. An event theme was then created to show the location of the epicenters.
The street data that I planned on using was a bit dated but, it was free and already in the desired format off the Environmental Systems Research Institute (ESRI) web site. 1990 Census Bureau tiger file street data for Los Angeles county proved to be a large an unwieldy file. It served to purpose but to reference what roadways could possibly be affected by an earthquake. Urban and rural data acquired with the street data would show where the greatest need would be for an evacuation or supply network. Using this data, a circle of about 12 miles in diameter was digitized out from areas that had a history of damaging quakes. The area covered by the circle was chosen based on a Modified Mercali system.
Later, it was realized that the street data that had been obtained was useless for creating a network. ArcView Network Analyst required cost variables such as time, speed and distance. The free highway data provided by ESRI proved useful since it was a little more updated and contained the necessary cost variables. It did not provide all of the streets in the area, making a reliable analysis impossible. What could be done was helpful, due to the fact that the data aligned perfectly with the street data from the Census Bureau.
In the data gathering, it became apparent that there were a number of variables that would need to be considered before an accurate analysis could be done. Things like overpass failures, soil content and accurate street data (drive time, distance and speed) would need to be examined.
Results
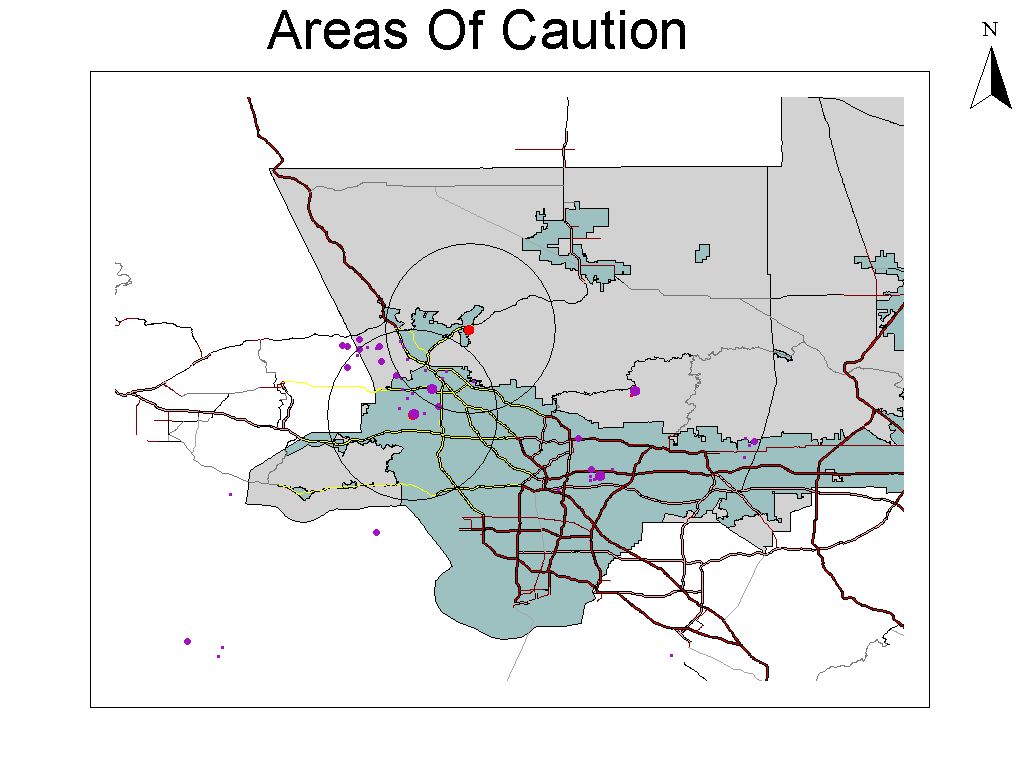
The above map shows the LA Basin area. The purple dots are the earthquakes that have occurred in the area from 1976 to 1998 and are shown as graduated symbols lager. The red dot is the 1971 San Fernando quake. A larger dot denotes an earthquake of greater magnitude. The teal polygons are urban areas and the gray represent rural areas. The circles show the area that would likely be affected. The lines represent roadways. The thicker lines being state and interstate highways.
Challenges arose from all directions as it was discovered that this project could become a major undertaking given all of the variables involved. Perhaps if a budget could be used better street data could have been acquired. The exactness required of the data when brought into ArcView proved to be a test of patience. There were some tables that came in with data in some columns truncated thus affecting the accuracy of its mapping. In gathering the data from the websites, it had to be determined if the data was updated and would provide for accurate plotting of the epicenters. This proved to be very time consuming as the metadata was placed else where in the site and was not easily found.
In the end, the map produced did reveal that the northern end of the basin would be more susceptible to earthquakes. Thus, the infrastructure of the area should probably be avoided in doing network analysis for the basin area. This, however, is a very preliminary result and would require further examination of the before mentioned variables.
Conclusion
Although the map may not be completely reliable, it does show that perhaps a route from the southeast would be plausible. Of course, a more detailed analysis of the area would be necessary. The unpredictability of earthquakes suggests that if a project of this nature could be completed it would have to be of a dynamic nature. Thus, a person could account for unexpected variables and devise the safest, quickest route.
In the research of this project, it became apparent that a knowledge of seismology would be helpful in determining how an earthquake could affect a given area. With this knowledge and further study of the infrastructure, a determination of which roadways would be most affected could be made and assist in building more accurate street data. Overpasses should probably be carefully considered due to the experienced failures in the San Fernando and Northridge earthquakes.
Continuing this project, a few more items could be added in. A network analysis of gas and water lines could be done to analyze where breaks may occur and what the affect would be. Also, in the advent of an earthquake, building information could be collected and a site for delivering supplies could be determined, or a place of refuge for those who are displaced. Geologic data could be incorporated into the GIS showing what soils are at risk and where possible landslide could affect roadways.
It would take a great deal of time and effort, but the end product could provide an efficient way of aiding the emergency response to an earthquake. Then making it more safe and easier for the rescuers and those in need of rescue.
References
California Institute of Technology. "Hypocenter and Phase Database" Southern
California Earthquake Data Center. 5 Nov. 1999 Caltech Catread Format.
19 Nov. 1999 http://scec.gps.caltech.edu/catalog-search.html
Gao, S., H. Liu, P.M. Davis, and L. Knopoff, L. (1996a). Localized amplification of
seismic waves and correlation with damage due to the Northridge earthquake:
Evidence for focusing in Santa Monica, Bulletin of the Seismological Society of
America, vol. 86, no. 1B, February1996.
Hauksson, Egill. Analyisis of Earthquake Data From the Greater Los Angeles Basin
and Adjacent Offshore Area, Southern California. 1999. 9 Nov. 1999
http://erp-web.er.usgs.gov/reports/VOL40/sc/g3028.htm
Hauksson, Egill. Partial Support of Joint USGS-CALTECH Southern California
Seismographic Network. 1999. 9 Nov. 1999
Ichinose, Gene A. University of Nevada Reno Seismic Laboratory & University of
Nevada Reno Geologic Department. 1999. 2 Nov. 1999
http://www.seismo.unr.edu/htdocs/WGB/Recent/HectorMine/
TriNet Shake Map Work Group. TriNet SHAKE MAP Home Page 1999.
10 Nov. 1999 http://www.trinet.org/shake.html
United States Geologic Survey. Southern California Crustal Deformation Measurements.
1998. 3 Nov. 1999 http://quake.wr.usgs.gov/QUAKES/crustaldef/scal.html
United States Geologic Survey, Geologic Division. Earthquake Information :Reducing
Hazards. 1999. 20 Oct. 1999
http://quake.wr.usgs.gov/QUAKES/FactSheets/RiskMaps/
United States Geologic Survey. Northridge Earthquake Research Products 1999.
25 Oct. 1999 http://www-socal.wr.usgs.gov/north/
United States Geologic Survey, National Earthquake Information Center. "Earthquake
Search." National Earthquake Information Center. 29 Sep. 1999 Earthquake Search
5 Nov. 1999 http://gldss7.cr.usgs.gov/neis/epic/epic.html
|