|
Abstract
Geographic Information Science has had a great impact in ensuring people's safety and well being in the case of emergencies in our present day. For example, planning easily accessible roads and routes for an emergency vehicle to get to a hospital, choosing the best location for your home and to avoid geologic hazards. In California, the most prominent geologic hazard is earthquakes. It has become somewhat of a hopeless natural disaster because it is very unpredictable when one will occur.
Introduction
One of the greatest challenges facing geologists today is the inability to predict the next occurrence of an earthquake. Several efforts have been made but the time constraint still plays a big role. Today, placement of seismographs at various strategic locations around the world has enabled scientists to constrain the time an earthquake will happen to about a few hours. With the upcoming field of GIS with the use of GPS, the next earthquake can be predicted ahead of time to an accuracy of 100 years.
Background
What is an earthquake? An earthquake can be defined as a tremor in the earth caused by a sudden release of energy stored in rocks beneath the earth's surface. Great forces acting deep in the earth may put stress on the earth's crust, which may bend or change in volume (strain). The classic explanation of how an earthquake occurs is known as the elastic rebound theory. It is rooted beneath the earth's surface. When the rock has attained the highest point to which it can deform it will eventually break thereby releasing waves of energy (figure 1.).
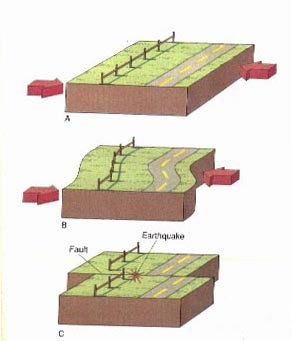
Figure 1. The elastic rebound theory.
(A) Rock with stress acting on it.
(B) Stress has caused strain in the rock
(C) Rock breaks suddenly, releasing energy, with movement along a fault
The wave of energy released is known as seismic waves. It is the seismic waves that cause the tremor in the earth. The magnitude of an earthquake is measured on the Richter scale.
The earth as we know is composed of three major layers; the continental crust, the mantle and the core. (figure 2.)
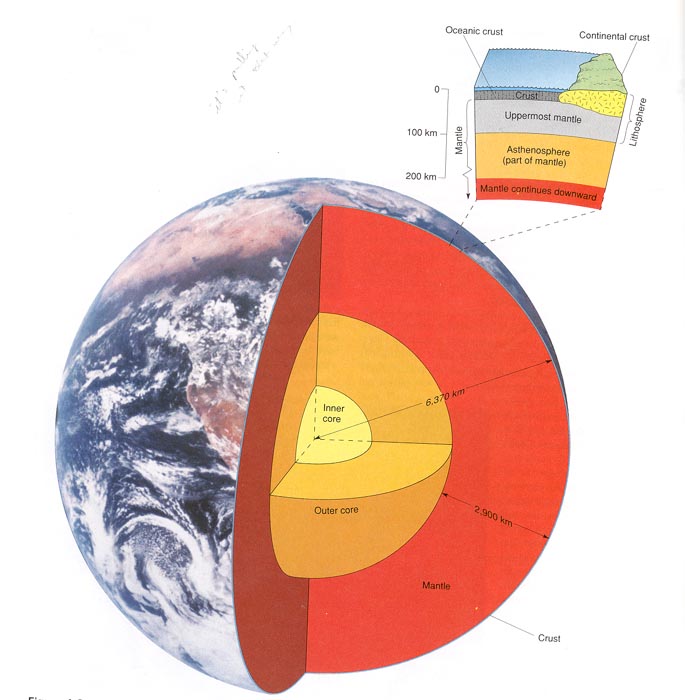
Figure 2. Cross section through the earth.
The core is composed of very hot liquid and gasses. The mantle is composed of ductile rocks that flow plastically and the continental crust, which is brittle. Although the elastic rebound theory is the most common explanation for earthquake occurrence, it can also be caused by volcanic eruptions and subduction zones. Cold continental crust is subducted at a location and dissipated into the earth's interior. Rock that is deep within the earth and is very hot rises slowly toward the surface while rock that has cooled near the surface is denser and sinks downward. This phenomenon replenishes the earth with new continental crust at new locations and creates a convectionally current in the earth's interior. Because of the brittle nature of the continental crust it initially resists the movement till it breaks off. (figure 3.)
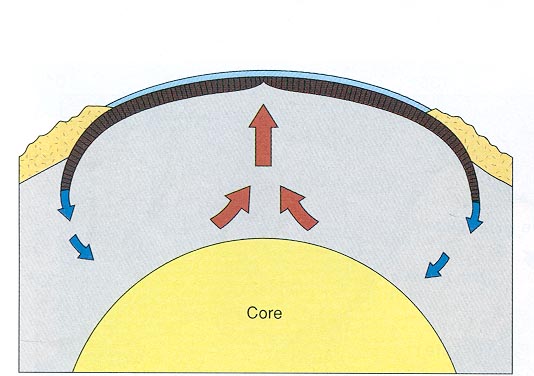
Figure 3. Hot mantle travels upward. Cold crust and mantle sink.
Data
To date, the best prediction we have so far is the 7.3 magnitude earthquake near Haicheng in northeastern China. It was predicted 5 hours before it happened after being alerted by a serious of foreshocks. Foreshocks are seismic waves received prior to the mainearthquake. It is not always felt because it depends largely on the strength of the rock it is propagating through. Authorities were able to evacuate millions of people from their homes. However, the same method failed to predict the 1976 Tangshan earthquake of magnitude 7.6 which struck with no warning and killed an estimated 500,000 people in China.
A different method of earthquake prediction that doesn't depend on the strength of rocks involves determining the history and using the history to calculate the probability of an earthquake at a given location. In 1988 the U.S. Geological Survey estimated a 50 percent chance of a magnitude 7 quake along the segment of the San Andreas Fault near Santa Cruz. In 1989 the magnitude 7 Loma Prieta quake occurred on this very section. Although this technique sounds promising many faults can not be monitored because of lack of funding and personnel and the lack of history for newly discovered faults. For this reason we may never have a warning of possible earthquakes in some regions.
Lastly, there are the predictions of impending earthquakes by popular writers and self-proclaimed prophets.
So how can we predict the next earthquake? To predict an earthquake would involve a combination of basic Geology, GIS, GPS and Physics. It's all about the location. Data accuracy plays a very important role because it will dictate to what precision our prediction will be (e.g. to years, months, weeks, days, hours, minutes or seconds). Considering the data collected is accurate, realistically speaking precision can be as good to 100 years or better based on how often the geology, fault style and motion changes in the area.
Methods
- GEOLOGY AND GIS
First thing to do is to obtaining a detailed geologic map of showing a plan view of the fault features most importantly the grooves along the fault plane. Sampling at various locations, inputting the data into Arcview and using the 3D-Analyst (figure 4.) to view it's geology can produce a cross-sectional view of the study area. It is off any of the grooves along the fault plane that most of the calculations will be made.
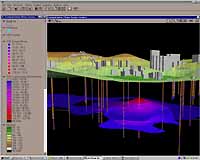
Figure 4. ArcView 3D Analyst used to model the subsurface
GPS
One of the major uses of GPS today is to acquire location. By acquiring the location for any grooves on both sides of the fault plane and the knowledge that plates move over time we can calculate the slip direction and average rate of slip of the fault or better yet the rate of slip at a focused area. Slip rate is calculated by placing a surveyed benchmark and measuring it's location over time. This would be averaged over a period of time. As we know the earth does not have a perfect geometry because of variations in its geology so rock types vary and slip rates vary along the fault.
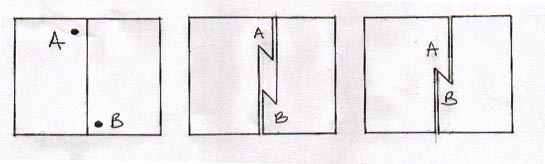
Figure 5.
Figure 5 shows a fault with it's slip directions and a plan view of the same fault. Points A and B are locations of unconformity along the fault line. At a point in time the two points will collide and then lock up. Unable to move, the location builds up a lot of stress because of the force driving the continental plates and eventually breaks off.
Using the mathematical formula below we can determine how long it will take before the grooves on both fault planes come in contact and break.
Time = Distance / Velocity
Conclusion Although other factors such as the force, mass, area and brittleness of the continental crust at the study area need to be accounted for, this paper is an effort to present the basic idea of how an occurrence of an earthquake can be predicted. Monitoring the location of grooves on the fault plane overtime from the start point to contact and the amount of stress accumulated we can predict not only the when the earthquake will occur but also the magnitude of the earthquake.
REFERENCES
- Gere, J.M. and Shah, H.C., Terra non firma - Understanding and Preparing for earthquakes. New York. 1984
- Plummer McGeary, Physical Geology.
- Robert Twiss and Eldridge Moores, Structural Geology. 1992
- U.S. Geological Survey, The Next big quake. Earthquake Information Bulletin
1990
- Wesson, R.C. and Wallace, R.E., Predicting the next earthquake in California. Scientific American 252. 35-43 1985
|