Private Water
Wells; life in the country
Author Information
Matt Mansfield
American River College, Geography 26: Data Acquisition in GIS; Spring 2001
(530) 889-7335
mmansfie@placer.ca.gov
Abstract
This project will examine the primary steps taken in creating a pilot project in GIS for a County organization, and the primary software used. It will illustrate the steps taken at data acquisition, and attempt to explain barriers and problems that were encountered in the project development
Introduction
Water as a natural resource in California has been severely strained due to rapid growth. In the future, water will continue to be a major concern as the population continues to rise. Issues include, but are not limited to water rights, water availability, and possible development limitations because of water restrictions. The Placer County Environmental Health Department is faced with the awesome responsibility of processing, approving, tracking, and inspecting each and every water well drilled. According to the year 2000 statistics from January through August, 224 wells were drilled in Placer County. That averages 28 wells per month, or almost 1 well per day! Based on this information, groundwater trends can be analyzed. This project will examine the method(s) at which the key well parameters such as well depth, production(yield), static water level, geographic location, and others are translated into meaningful data.
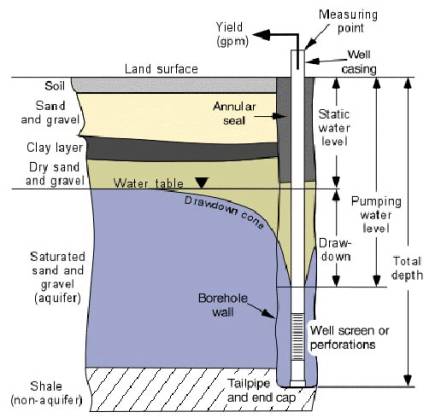
FIGURE 1 - Standard Well Cross-section
The graphic above (figure 1), illustrates what a basic well looks like and shows various features that will be analyzed for. The data that will be analyzed will be based upon information gathered by the various techniques that will be examined in this project. This data will hopefully provide Placer County Environmental Health with an understanding of possible trends in foothill groundwater supplies. There will then be answers available to customer inquiries as to what can be expected from a parcel’s well and the its surrounding area.
Background
The private water well project for GIS, is the Health Department’s first attempt at the analysis of geographic information. It is the first true test of ArcView. Covered in the presentation are the steps taken to develop a credible well project in GIS. It includes examples of data used, the means of acquiring data, and summary of the significant attribute terms that will be examined. Also included is a sample of the completed project. What the reader must keep in mind, however, is that the GIS project remains under constant revision and is considered merely as a “first attempt” at GIS technology in regards to analyzing ground water data.
There were several literary sources used in the completion of this project that range from web sites in which some ideas were extracted, on up to department and county directives and regulations, and even state guidelines. The interpretation of these sources, especially the regulations and procedures were the main framework of how the original project took shape in GIS. Again I would like to stress that this is somewhat of a pilot project of GIS for Placer County Environmental Health, and will be used as a springboard for further projects in GIS program development. Its true purpose then, is to stimulate ideas towards GIS program development, and to illustrate how the system could be developed, improved, and implemented.
Methods
Gathering data for this project proved to be quite a challenge. Data was available in both paper and electronic formats. Perhaps the most time consuming, was to sort between the paper files and electronic ones to ensure that duplicate wells were not reported. The sole unique identifier in this case is the Assessor Parcel Number or APN. This number is the backbone of the project in that data is acquired, sorted, and rectified by using this single number.
The single most important document used in acquiring data for this project is the Department of Water Resources Well Completion Report (DWR).
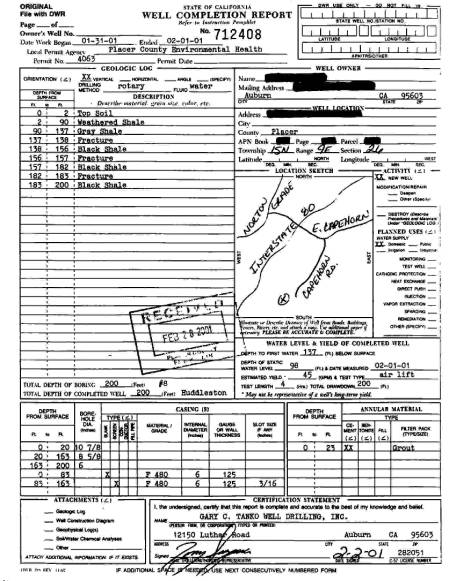
FIGURE 2 – Dept. Water Resources DWR
This document provides a permanent record as to what a particular well looks like below the surface. This form describes what is found in the well while drilling. The layers found in the upper left of the form are used to show just how many layers there are and what they are made of. This is particularly useful in determining where the water is, as certain layer materials inherently hold water better than others. Hard rock layers like fractured granite and fractured shale traditionally hold most of the water in the foothills. These layers shown on the DWR are based upon a drilling log that must be kept by the driller at the time the well is drilled.
The main pieces of information used for the GIS
database are found in the right half and lower portion of the form. Here, the Assessor’s Parcel Number (APN),
address, owner information, well yield, well depth, static water level, annular
seal data, and casing information can be found. These were originally entered into an Excel spreadsheet, manually
one at a time. It was from this Excel
file that the Theme’s attribute table was to be derived. Next, obtaining information from another
electronic database will be examined through the use of SQL. 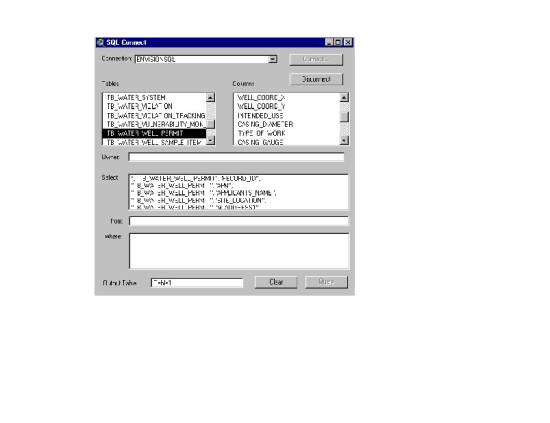
FIGURE 3 – SQL Connect
The second format used in acquiring key information, in addition to the Excel spreadsheet, is the electronic Envision database. Envision is the primary permit tracking program for Environmental Health. It is used to track permits throughout their lifecycle. Each individual well permit in the Envision database is a separate record in the well attributes table. Information was obtained directly into ArcView by querying Envision through SQL (Standard Query Language) connect. (See Figure 3) The desired fields were identified in the prompt box and brought into ArcView from Envision. Below, you can see a screen shot of an Envison water well permit form. Its primary use is to get data into the database with a minimum amount of user options for manipulating the data.
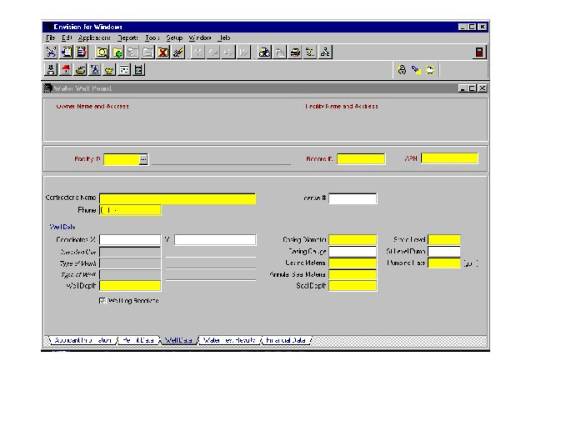
FIGURE 4 – Envision Well Permit Screen
The fields highlighted in yellow are the attributes for each permit that were queried through the use of SQL. The fields, though not totally visible in the above example are as follows:
- Contractor Name & Phone number; Driller information
- Well Depth; Depth of the entire well from surface of the earth (grade) to the bottom, measured in feet. This is considered the bottom of the water column.
- Casing Diameter; Measured in inches, usually 6” or sometimes 12”.
- Casing Material; Usually PVC, sometimes Steel.
- Annular Seal Material; Cement, Bentonite or other annular seal material.
- Annular Seal Depth; Depth in feet of the annular seal.
- Static Water level; Depth in feet below grade where the water sits due to pressure the earth exerts upon it. This is considered the top of the water column.
- Well Yield; The well yield measured in gallons per minute (GPM).
- Permit Number; Secondary number to track individual permits. Auto number issued by Envision at the time of entry.
- APN; Assessors Parcel Number, the unique identifying number based upon which parcel the well is located upon.
Results
Now that the data was brought out of the Envision database, it was time to use the information to create a project in ArcView. The data brought in via SQL from Envision was stored in a temporary file on the hard drive where it could be retrieved later. The important thing to remember at this point is that the data was just a basic table of rows and columns that could be used in Access or Excel, but was not geo-spatial data. The data could not be shown on a map without coordinates, because without these coordinates the data did not pertain to the real world.
The wells point theme was geo-coded into Arcview by using the APN (Assesor’s Parcel Number) as a domain field, which was used to join the two valuable attribute tables. The “parcels” table and the “wells” table were joined and then a new theme was created in the project.
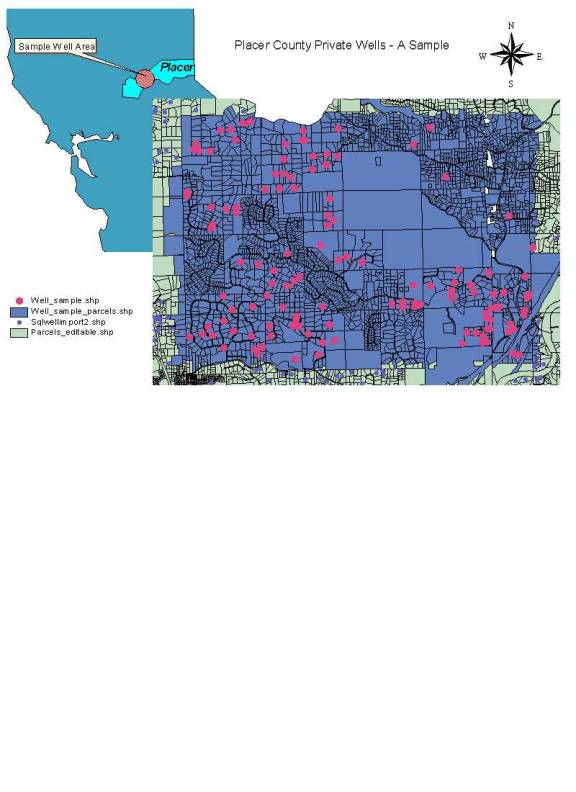
FIGURE 5 – ArcView Private Wells layout Sample
Above, is what the project looks like in ArcView 3.2. It is presented here as a layout, in order to get a good first glance at what is going on in the region of interest. This type of presentation was selected because any prospective land buyer is able to ascertain trends for groundwater. Trends in groundwater may affect land value, or even have an entire transaction depending upon it. The realtors of Placer County are quite knowledgeable about what is required in the county code in order for a parcel to be considered “legal.” Well depths, yields, and static water levels all contribute to the customers’ decision as to whether or not a project will be feasible. Accurate GIS placement of wells in the future will also aid in the enforcement of other land development issues, such as well to septic setbacks, or even hazardous materials spills or plumes. With this in mind, it is vital that once the old wells have successfully been implemented from the paper “legacy” database, that each and every well gets its coordinates from GPS. This will be the next step once all of the older wells have been accounted for from the several database versions, and their parcel numbers reconciled.
Analysis
The project at this time is a mere snapshot of private well data within Placer County. There are many refinements that are left to be made in order to produce a totally viable and accurate project. This one may be used, however, there are a few things to keep in mind that were discovered along the way. These items will be solved with improved data management techniques and further database refinement.
It is of significance to not the biggest problem first. There has been a lack of data entry continuity over time. This presents a challenge because even though the data may be present, it could prove difficult to reconcile. The data has been entered into several versions of the “Envision” database by Decade software. http://www.decadesoftware.com/envision.htm This poses a problem, because with different versions, came different data entry form “looks”. This in turn compounded the problem with inconsistency in data entry. Operators at the time were not informed on a regular basis where data was to be entered on each of the “new forms.” The inconsistencies were also not checked via a regular quality control program.
Secondly, is the fact that the key identifier used in Environmental Heath, Assessor’s Parcel Number (APN) changes very easily depending upon its land status. An APN could change for parcel splits, easements, or re-zoning to name just a few. If these parcel numbers do not get changed in the Envision program, then they cannot be accurately depicted in ArcView.
Finally, another twist on APN problems is their being left off or conglomerated in a way that would cause them to not be depicted accurately. An example of this would be that the standard format of 000-000-000-000 was entered as 000-000-000/000 or 000-000-000. In either case, these parcels with wells were left out of the selection process and thus were not plotted by ArcView even though they did have wells on them. This problem goes back to the lack of a serious quality control program through the years. A stringent quality control program must be put into place with the evolution of Placer County Environmental Health’s GIS program. It is up to the management to realize this crippling problem and assign the required funds and personnel resources in order to correct it.
Conclusion
In conclusion, there is a solution. This solution, however, will not come overnight as there will be a lot of data to compile, revise, re-distribute, and to perform quality control upon. This of course, as mentioned earlier, will take funding and personnel as well as an increased understanding of how GIS works. The years of Legacy Database will take time and man-power to sort through. According to Michael J. Hernandez in Database Design for Mere Mortals, “A legacy or paper based database is a database that has been in existence and in use for several years.” What the database manager and/or GIS analyst must do is to “analyze it (data) to yield valuable information about the way data was collected and the way it currently is.” The desired data must be gleaned from the paper files and compared to what is already in the Envision database. It is basically up to management to decide how they want this done, who will do the job, and what resources to allocate for this immense project.
References -- Literature cited. Alphabetize by first author. Required format example:
Department of Water Resources, 1981.
Bulletin 74-81, State Water Well Standards of California.
Department of Water Resources, Ground and Geology Division, State of California Website: http//well.water.ca.gov/eXterra/GetWells.cfm?GwCode=, Ground water level data and some contoured maps.
Department of Water Resources (DWR). Well Completion Report. Submitted by every driller by law, for every well drilled.
Envision Program, by Decade Software. Placer County Environmental Health database. Website: http://www.decadesoftware.com/envision.htm
Hernandez, Michael J. , 1997. Database
Design for Mere Mortals, 62, 100-102.
Placer County, Placer County Environmental Health, July 1990. Placer County Well Ordinance.
Placer County, Placer County Environmental Health, 2000. Policies and Procedures Manual.
Placer County Website: www.placer.ca.gov
Appendices
Material may be included in various appendix sections at the student’s option.