TITLE
Extent and Virus Type of Rabid Wild Animals Found in Placer County, CA, 1998 - 1999
AUTHOR INFORMATION
By Barbara Noble
American River College, Geography 26: Data Acquisition in GIS; Spring 2001
ABSTRACT
Placer County, California has a high rate of rabies in wild animals in comparison to other state counties. Statistics on rabies incidence are kept by the state but a geographic distribution may also spark some new thoughts among wildlife epidemiologists. Three geocoded maps were compiled from 1998 – 1999 rabies data collected in Placer County focusing on incidence of rabies by species, by virus type and clustering by year. This may form a database for comparisons and research in the future.
INTRODUCTION
Rabies is on the rise in many parts of the United States. Many wild animals carry the virus and can transmit it to domestic animals and humans. Each year the State of California collects rabies incidence statistics from each county in California. Placer County has consistently ranked high compared to other counties for rabies incidence.
There are many questions that could be considered in analyzing rabies data from Placer County. Does the rabies virus appear from year to year in the same location?
How close to population centers are rabid wild animals? What types of wild and domestic animals are diagnosed with rabies? What types of rabies viruses are being seen in Placer County? What is the geographic distribution of known rabies cases? Is there a need for more public awareness regarding rabies vaccinations for pets?
BACKGROUND
The California Department of Health Services, Viral and Rickettsial Disease Laboratory has identified Placer County as having the highest incidence of rabies in skunks within the state. The motivating concern of wildlife epidemiological investigations is the transmission of a virus to non-reservoir animals and humans. This can be analyzed through statistics but a display in geographic format may also be quite helpful.
I decided to explore the geographic appearance of rabid wild and domestic animals in Placer County and note the areas of clustering over time, by location and with populated areas.
METHODS
After an interview with Mark Miller, Director of Public Health, Placer County, California, I devised an abstract to consolidate information on rabies cases from the Placer County Public Health Laboratory's Rabies Examination Form. The cases reviewed and abstracted included all Placer County Lab Results of Positive Rabies Antigen Detected for the years 1998 – 1999. Thirty-three cases were located for 1998 and 26 cases for 1999 bringing the combined total to 59 cases. In addition, Mark Miller asked if I could locate and include the virus type for those cases where it was available. Approximately 25 cases had virus types identified and that information was included.
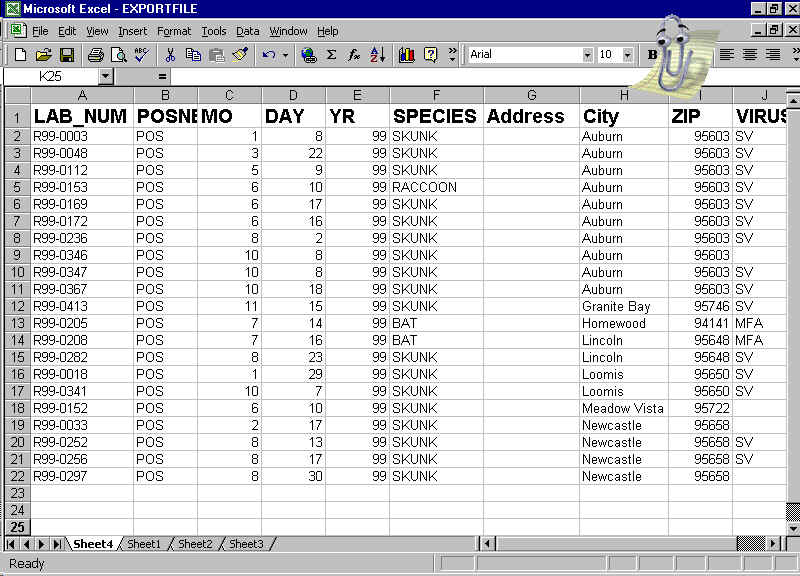
After abstracting the cases, data was entered into an EXCEL spreadsheet and zip codes were researched and added. Geocoding the data in ArcView seemed the best alternative for analyzing the data. A background map from ESRI 1995 Tiger Census data was selected with Line Feature Streets which could be geocoded to my abstracted data.
Due to new construction or poor addresses 5 of the 59 cases did not successfully geocode. With additional research they can be located on the map. These were skunks in Loomis, Penryn, Auburn and Lincoln. Shown below is a portion of the abstracted data in the spreadsheet. Exact addresses have been deleted for confidentiality.
RESULTS AND ANALYSIS
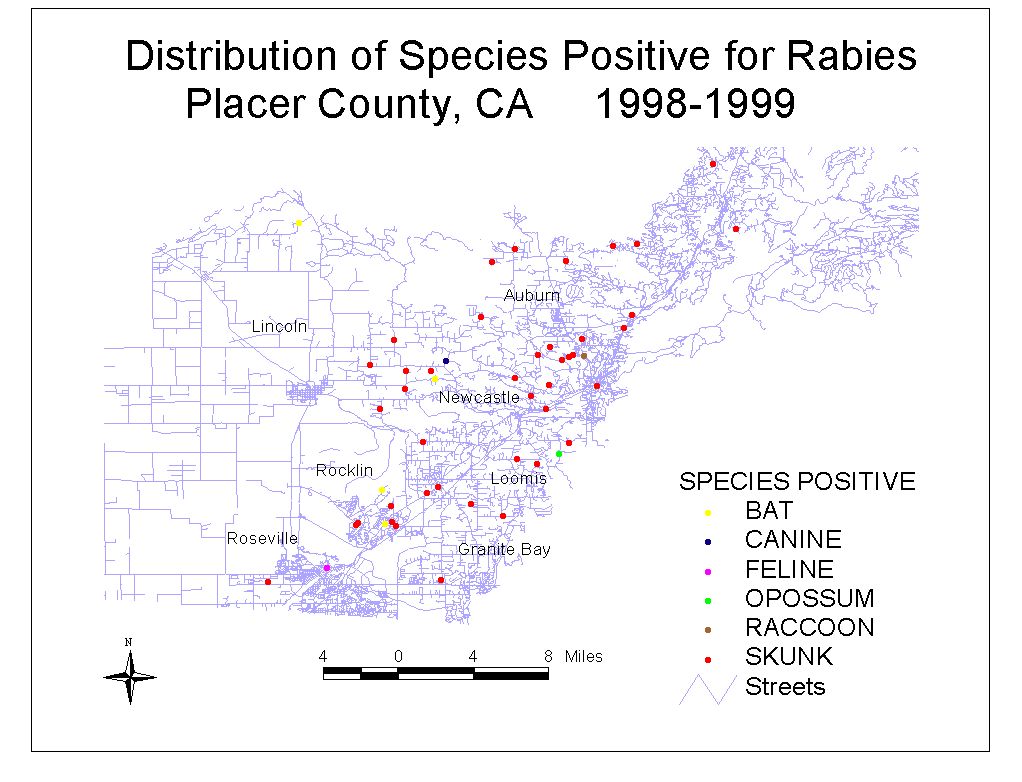
Preliminary data results are focused on Southern Placer County with an elevation less than 2,000 feet where the rabies cases are concentrated. Map 1 shows combined 1998 – 1999 data broken down by species. As expected the highest incidence is among skunks but bats, opossum, raccoon 1 feline and 1 canine are also noted. Clustering can be seen in the Rocklin and Auburn areas.
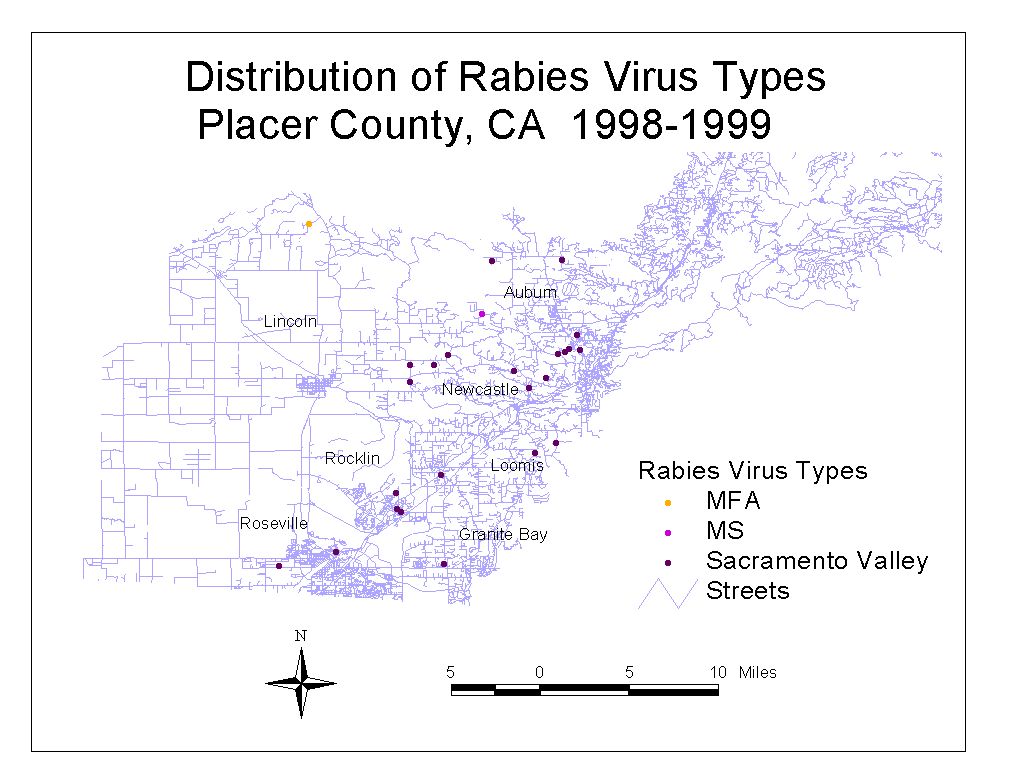
Map 2 is a 1998 – 1999 distribution of virus type for the 25 cases where it was available. This abbreviated data shows Sacramento Valley strain is the overwhelming virus type. From the data it was noted that it affects skunks as well as raccoons, opossum and also the 1 feline and 1 canine. The MFA strain is affecting bats only. The single MS case occurred in a skunk.
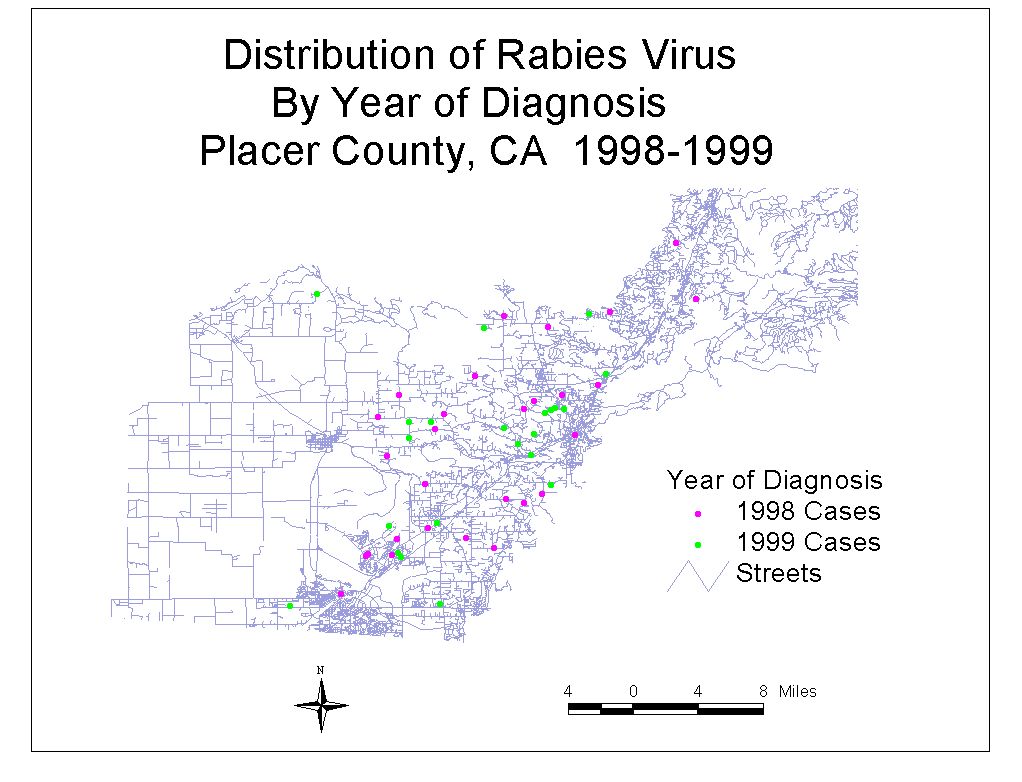
Map 3 shows a distribution of cases broken down by year. Clusters may occur in the same year as in Auburn or over time as in Rocklin. Each of these maps may lead to new questions and can be used as comparisons for future data.
CONCLUSION
This data set could form the foundation for a yearly rabies data collection set. It could form a springboard for additional comparisons such as peak months, migration of cases and the coexistence of other factors which could increase the likelihood of disease.
The geocoded data could also monitor incidence by location and provide the public with notification when incidence becomes present or high in their neighborhood. It could be posted on a local Public Health website making it available to the public at any time.
REFERENCES
Interviews with Mark Miller, Director of Public Health, Placer County, California
Molecular Epidemiology of Enzootic Rabies in California
Leta Crawford-Miksza, Debra A. Wadford, and David P. Schnurr
Viral and Rickettsial Disease Laboratory, California Dept. of Health Services
Provisional Animal Rabies Cases by County , Jan. – Dec. 2000
A paper published by the State of California
Research and review of: Placer County Rabies Examination Forms
For 1998 – 1999.
Research and review of: Placer County Rabies Examination Forms
For 1998 – 1999.