Abstract
An analysis tool is needed to prospect for new agents of Penske Truck Rental. By utilizing U.S. Census Data from the 2000 Census, new markets can be identified by information gathered at the census tract level. By identifying target segments of the population, census tract information can potentially be imported into a GIS for analysis and communication. Difficulties in accessing U.S. Census data requires alternative sources of shape files and demographic data bundles. Greater computer power and knowledge will lead to eventual development of the analysis tool.
Introduction
The consumer truck rental market primarily functions through networks of agents or dealers that are paid a commission for truck rental transactions they complete. Companies such as Uhaul, Ryder TRS/Budget, and Penske benefit from this type of arrangement by having an extensive network of locations with very little overhead. In addition to a commission, agent locations benefit from increased customer traffic without an additional investment in inventory or marketing. Recruiting a new agent involves several dynamic factors including credit, visibility, parking, zoning, and geographic location.
At Penske Truck Rental the current method of developing new agent markets is largely dependent upon the educated guesses of the territory manager and what the competition may or may not be doing. An analysis tool is needed to help make logical and informed decisions about where to pursue new markets, and a presentation system to communicate these ideas to others.
Northern Central and Eastern California will serve as an initial development area for Sacramento district office of Penske Truck Rental. ArcView software will allow analysis and presentation of data incorporated from the 2000 Census.
Background
The consumer truck rental market consists of two types of transactions; local rentals and one way rentals. All the major truck rental companies, Uhaul, Budget/Ryder TRS, and Penske, provide local as well as one way truck rentals geared for household customers. Companies like Penske and Ryder/TRS primarily concentrate their consumer trucks on the more profitable one way type of transactions leaving a large share of the local business to ,industry leader, Uhaul.
Targeting new markets to place truck rental agency locations at Penske has mostly involved best guesses of community size and population density. In an attempt to better understand the demographic characteristics of potential customers, Penske Truck Leasing hired Parkwood Research in 2001 to conduct focus group interviews and further narrow down a target market for one way truck renters. From the focus group work, Parkwood Research identified three population segments that would most likely rent a truck for a one way move. The three population segments are:1. Up and Comers- Young, educated, and mobile. Moving often with each new career opportunity.
2. Family Focused- Young families, major moves for new careers or new home purchasers.
3. Realists- See the financial advantages to moving themselves as well as having complete control over the handling of their possessions.
In order to delineate the above segments from the general population on a geographical basis, U.S. Census Data is used. The U.S. Census Bureau, part of the Department of Commerce, conducts a decennial census with the first taking place in 1790. Although, demographic data may be acquired by other means, the enormity and frequency of the U.S. Census makes it the most logical and cost effective source for this project. U.S. Census Mission Statement.Previous work with ArcView at American River College in Geography 9 and Geography 25 helps give an example of what an analysis tool would look like for Sacramento County.(See Figure 1) New markets can be identified by the increases in population between 1990 and 1997, but the figure shown does not have in-depth demographic analysis. Because of the temporal aspect of census data and lack of supporting documentation, data quality would not have been sufficient for this project.

Figure 1: ArcView Layout of Population Changes for Census Blocks in Sacramento County.
Methods
To develop an analysis tool in ArcView it was determined that U.S. Census data would be combined with a related spatial layer. U.S. Census data is grouped in a hierarchical order beginning with the smallest geographic unit, the census block. It was determined that census data grouped geographically by census tract would provide the most appropriate level of detail needed for the analysis tool to be effective. (See Figure 2)Data detailed by census blocks would provide too much variation on a larger scale and could actually degrade demographic analysis over communities and smaller cities.
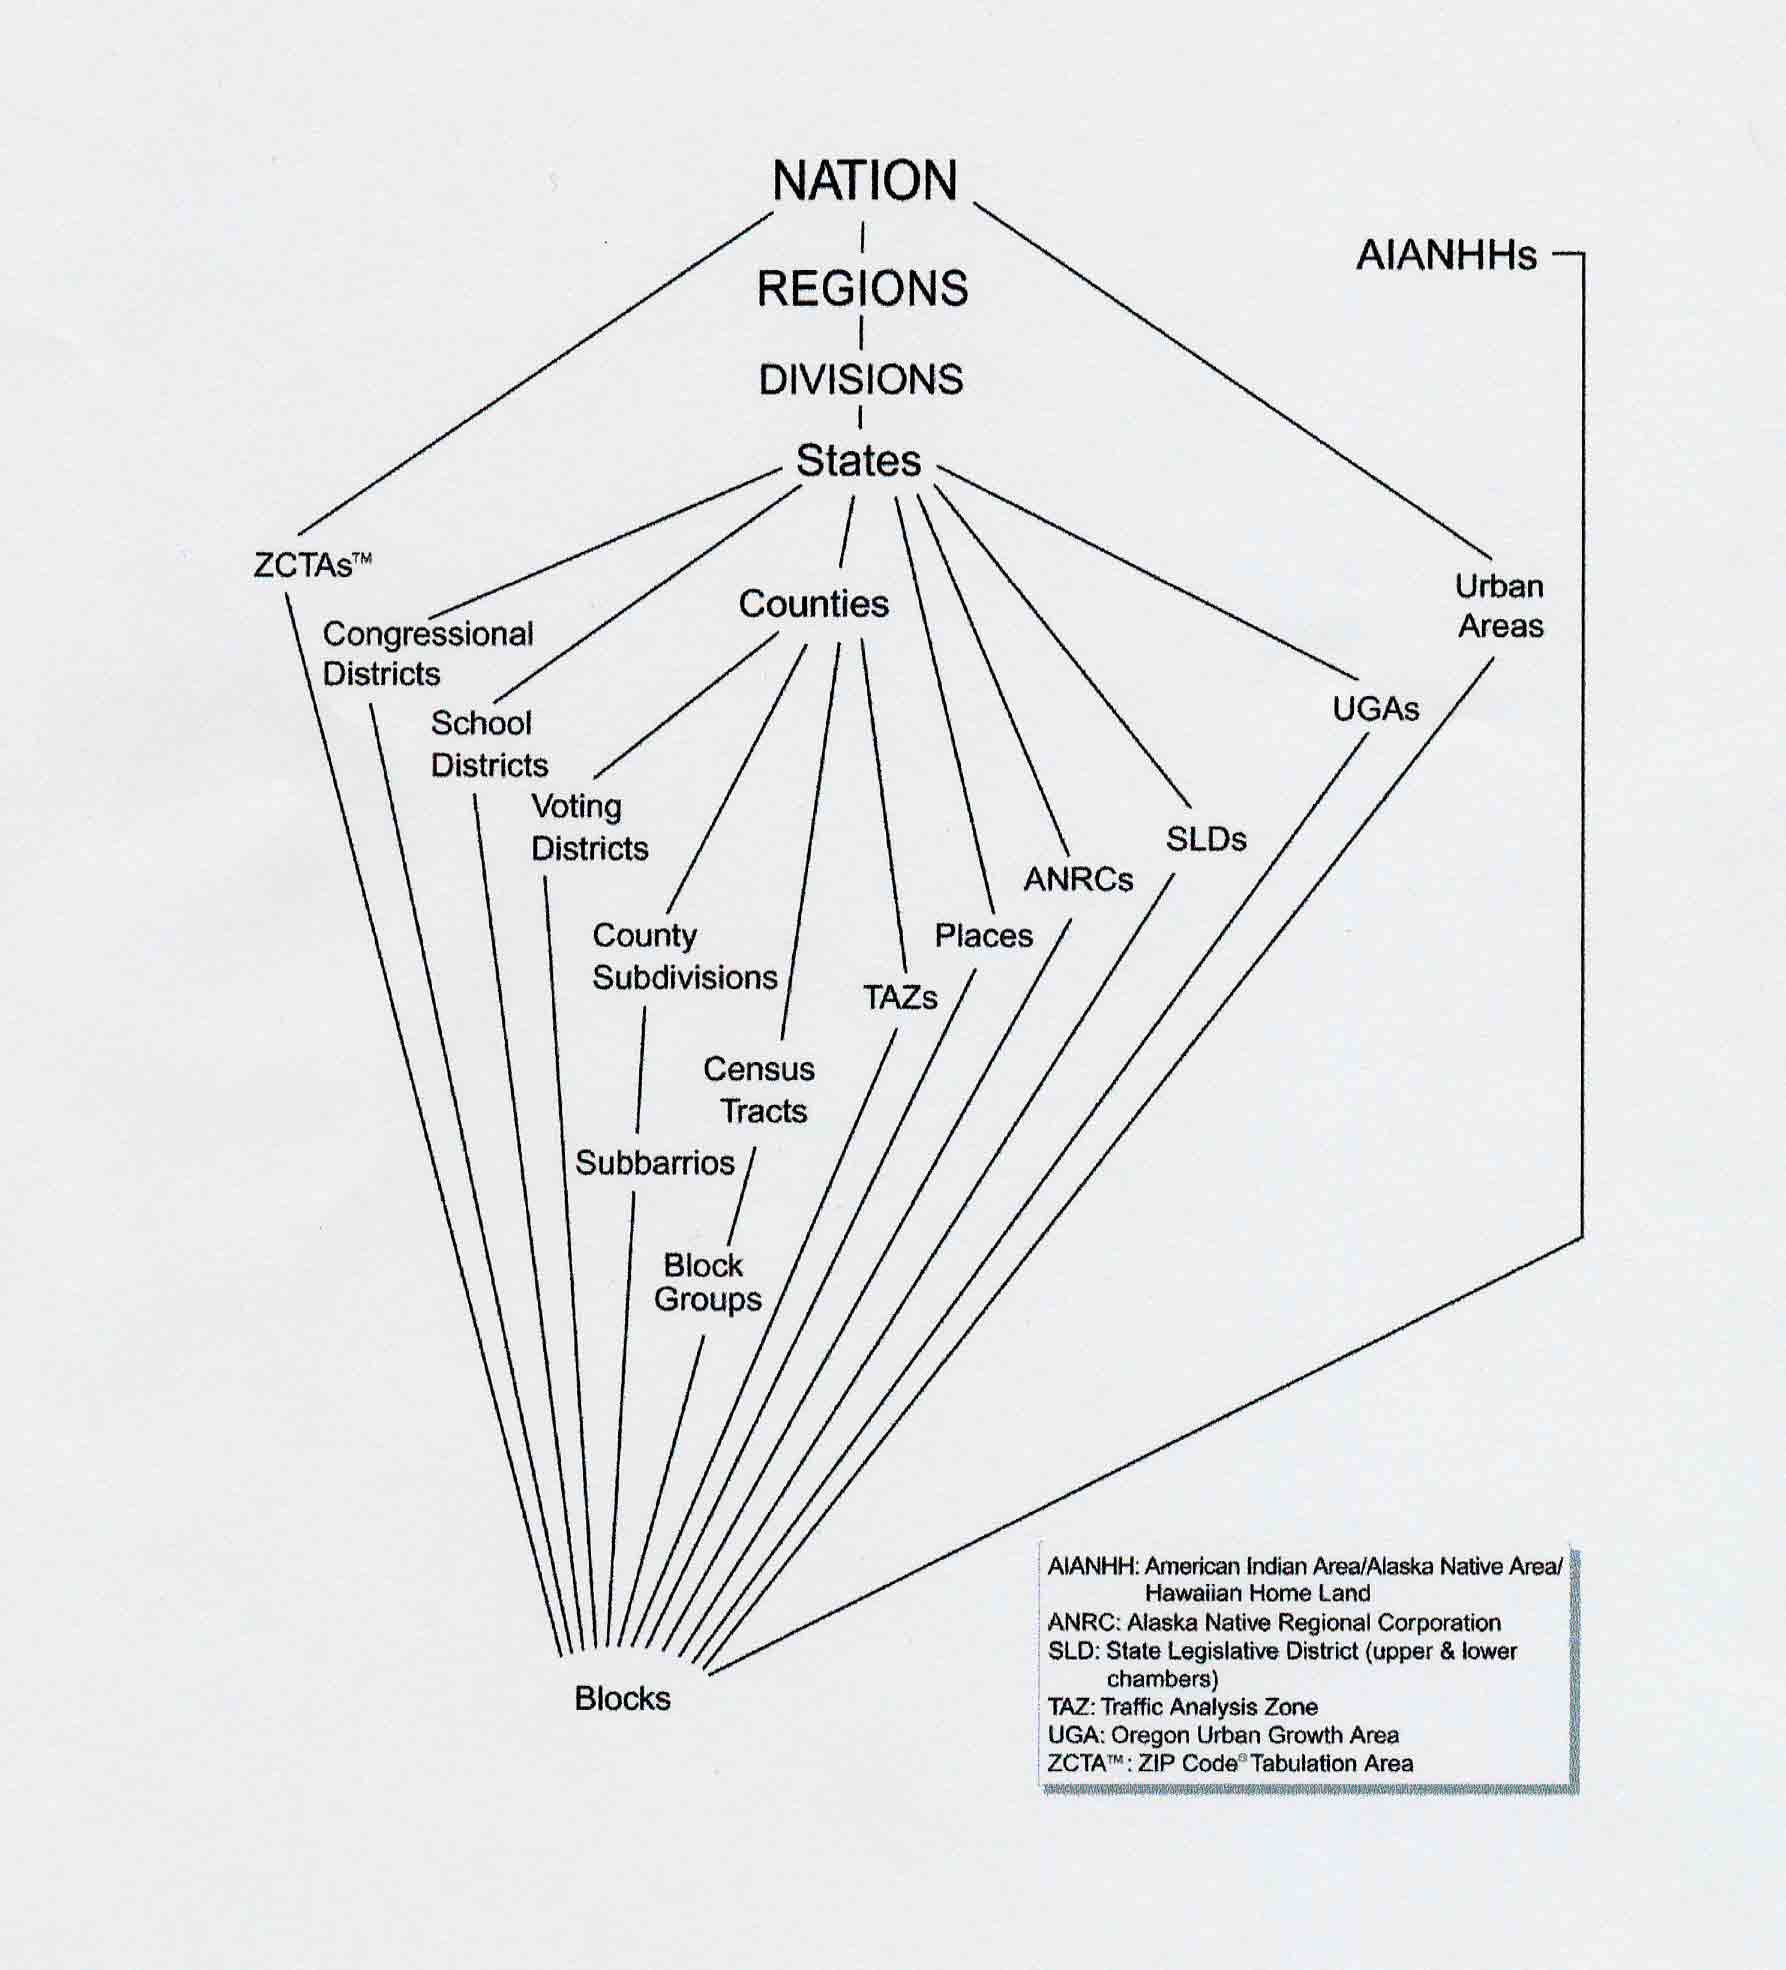
Figure 2: Heirarchal Data Groupings (Technical Documentation from "SF1", U.S. Cenus,1991)
The U.S. Census web site provides a wealth of information of about the data it collects and how to access it. Researching the web site led to the discovery of the two elements necessary to build the Analysis Tool.
1) Census 2000 Summary File 1. Detailed census tables of population and housing divided by state. Because of the large file size (640MB/compressed or 6.5G uncompressed) a CD-ROM was purchased directly from the Census Bureau.
2) Census 2000 TIGER Line Files. TIGER stands for Topologically Integrated Geographic Encoding and Referencing and provides the geographic element that tabular census data is related.
Using the technical documentation for the TIGER Line files combined with the FIPS codes from the technical documentation from Summary File 1, fifteen county geographic files were download directly from the U.S. Census web site. Metadata for the tabular data is also available from the web site in an extensive 625-page document that is well organized and critical to understanding the structure of the Census tables.
Results
Two data sources were obtained from the U.S. Census that could potentially build the analysis tool using tabular (Summary File 1) and geographic (TIGER Line Files). Unfortunately the data was not accessible with the current computer power, knowledge, and software. The "Summary File 1" for California is separated into 39 data files each of which is approximately 30 compressed megabytes of comma delimited files which was inoperable in desktop Access for Excel. Although the U.S. Census states that TIGER files require GIS software to utilize them, when opened they were in a comma delimited format and not in shape file format required by ArcView.
Researching additional sources of U.S. Census data led to the Geography Network where a few TIGER files were converted to shape file format only for layers such as roads and congressional districts etc. Discovered through the Geography Network that ESRI sells software that converts the comma delimited TIGER data to shape file format. Proceeded next to SACOG (Sacramento Area Council of Governments) where Laura Bell, GIS Analyst, e-mailed shape files for the six counties covered by SACOG. (See Figure 3) Tabular 2000 Census data was downloaded from the SACOG web site in the form of a redistricting sample set which only consisted of total population and population by race for each census tract in each of the counties.
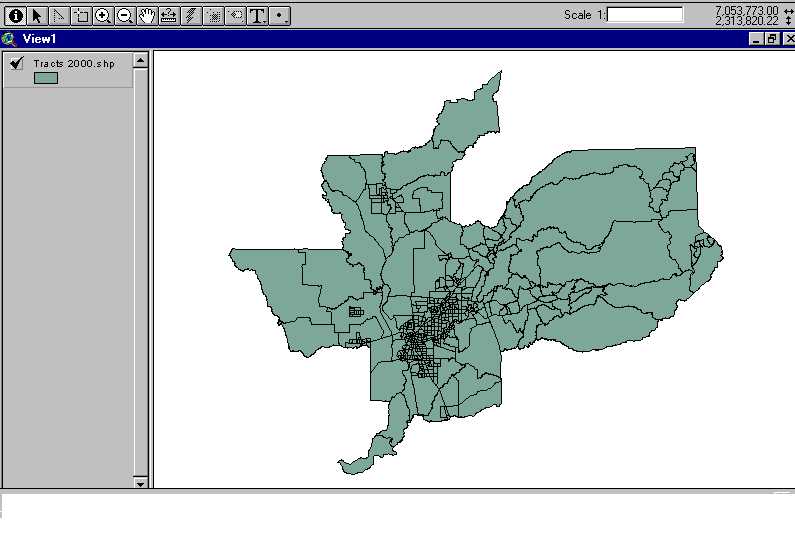
Figure 3: ArcView Theme of The Six SACOG Counties. (El Dorado, Placer, Sacramento, Sutter, Yolo, and Yuba)
Analysis
2000 Census data for California only became available in May and June of 2001 and while the newest information would be better than adjusted figures from the 1990 Census, it created some tunnel vision in acquiring it. Although, the 'Summary File 1" and the TIGER Line Files were very well documented it was not determined that a desktop system would be incapable of handling them until they had already been acquired. At the present time the shape files received from SACOG will be a good source for further work in building the analysis tool. By narrowing the scope of the analysis area to the six counties that comprise the SACOG organization, hopefully smaller data sets will be available to join the shape files at the census tract level.
Conclusion
The "Analysis Tool for Agent Locations" was not developed to the extent desired. A great amount of knowledge and competency was gained to further develop this necessary tool for locating new agents. Lessons learned from this project include:
1. The newest data available that is technically complex may not be superior to older and simpler existing data sets.
2. U.S. Census data is very well documented and free.
3. Greater computing power in terms of virtual memory will be necessary in the future to open large data sets.
For Penske Truck Rental to compete with its much larger competitors an analysis tool will give Penske a greater opportunity to target new markets. An "Analysis Tool for Agent Locations" can help make and communicate the best business decisions.
Reference Sources
U.S. Census Bureau, 2001. Census Summary File 1/California CD-ROM, U.S. Department of Commerce, Washington, DC.
Websites to Documentation:
U.S. Census Bureau, 2001."Summary File 1" PDF/625pgs.
U.S. Census Bureau, 2001. TIGER Line Files Technical Documentation PDF/308 pgs.