Author Information
Barbara Ellison
American River College, Geography 26: Data Acquisition in GIS; Spring2002
Contact Information - (916) 845-4959, Barbara@cwo.com
Abstract
A Garmin global positioning satellite receiver was used to mark thesightings of wildlife, both living and dead, within the Folsom City limits.It was determined that wildlife corridors could allow the mammals to movebetween forage and cover areas without crossing major four-lane roads.
Introduction
The City of Folsom still has a wide range of wildlife that live alongthe rivers, lakes and creeks that border and flow through the city. Unfortunately,the popularity of the city for new housing and commercials developmentshas had a negative impact on the ability of the wildlife to move safelybetween existing forage and cover areas. According to the 2000 Census,the city population has doubled since the last decennial Census in 1990.In addition to the diminution of available forage, the increased amountof traffic on the major roads has resulted in an increased number of deadwildlife seen along side the roads. The areas chosen for study were thoseI most frequently travel myself, within the city limits of Folsom.
Background
Since moving to Folsom 13 years ago, we have enjoyed the occasionalsightings of wildlife indigenous to area. We see turkeys kicking up thegarden woodchips in search of food, and occasionally hear the cackle ofcoyotes in an empty lot adjacent to our subdivision. Neighbors with homesalong the creek report the theft of catfood by the raccoons that climbonto their decks. And in the larger, fenced-in, safe areas of the FolsomPrison grounds, and the Aerojet property, lucky observers may sometimessee small herds of mule deers. But during the last 13 years, as the citypopulation doubled, more wildlife have become victims of inattentive drivers.My intention with this project was to draw attention to the loss of forage/coverareas, and to build some interest in reducing the risk to the wildlifethrough a few simple, inexpensive solutions.
Methods
A Garmin global positioning satellite receiver was used to create waypointsat the locations of sightings of wildlife, both living and dead. I droveand walked around the city of Folsom marking where I remembered seeingthe various wildlife or, in the case of some of the coyotes, where I hadheard them. I used StreetMap software for a map of the Folsom area. The GPS waypoints were imported on top of the StreetMap. However, the waypointattributes could not be georeferenced in StreetMap. In order to illustratethe greenbelt areas*, I imported the StreetMap of Folsom into ArcView,and drew polygons of the green belt areas in green. I used a darkgreen to illustrate the amount of green belt space present in 1990, anda light green to illustrate the remaining greenbelt area in 2000.
Results
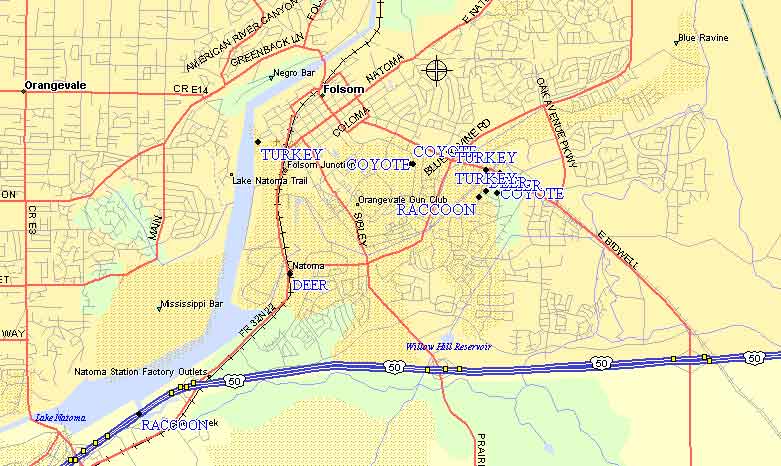
The map below shows the distribution of wildlife sightings alongsidemajor, four-lane roads. Note that the sightings are between greenbelt areasindicating a migration route. Place the map here. There is a clear relationshipbetween the greenbelt areas and the wildlife sightings. In order to reducethe mortality of these animals, the following suggestions are provided.
1. The green belt that lies between Folsom Blvd and Lake Natomais ideal cover for wildlife. It is densely forested with low lying brush,alongside a fresh water source. Last year, the City of Folsom raised thespeed limit in the stretch of Folsom Blvd to 55 miles per hour. Reducingthe speed limit back to 45 would increase the braking distance. Perhapsa further reduction during the nighttime hours when wildlife are most activewould reduce further any collisions with the wildlife.
2. At the eastern entrance to this stretch of prime forage areathere had been a standard leaping stag CalTrans sign. This was removedduring the construction of a strip mall in former meadow. A more specificsign, such as Please slow down. Our wildlife depend on you may have apositive impact, if for no other reason than it is new, and would be attentiongrabbing. It has been effective to place painted signs or stamped impressionsof a fish with the admonition, No dumping. Flows to creek. Therefore,a change from historically standard signage may have a positive impact.
3. Require the creation of corridors for wildlife to move safelybetween forage areas. Since wild animal activity in urban areas is predominantlyat night, perhaps the building of bicycle trails between areas would besufficient. These would have an attractive usage for the residents duringthe day, as well as create a possible throughway for the wildlife.
4. Make an advertising campaign to raise awareness of the responsibilityof drivers to help protect the wildlife. This could be accomplished bythe placement of small billboards around the major roads imploring caution,as well as by placing notices in the local newspaper.
Figures and maps
The table below is what would have been the attribute table had I beenable to georeference the data to the StreetMap. The data were collectedin NAD83.
| Waypoint No. | Coordinates | UTM | Animal sighted | GARMIN code | Alive? |
| 1 | 10S 0659957 | 4281653 | Coyote | CoyLem | Y |
| 2 | 10 S 0659996 | 4281665 | Coyote | CoyRil | N |
| 3 | 10S 0661060 | 42815970 | Turkey | TurWil | Y |
| 4 | 10S 0661060 | 4281598 | Deer | DerWod | N |
| 5 | 10S 0661269 | 4281553 | Deer | DerWil | N |
| 6 | 10S 0661233 | 4281271 | Coyote | CoyHom | Y |
| 7 | 10S 0661974 | 4281209 | Raccoon | RacFli | Y |
| 8 | 10S 0661070 | 4281286 | Turkey | TurBla | Y |
| 9 | 10S 0657744 | 4281929 | Turkey | TurWo | Y |
| 10 | 10S 065250 | 4280035 | Deer | DerBlu | Y |
| 11 | 10S 0656596 | 4277845 | Raccoon | RacFol | N |
| 12 | 10S 0656098 | 4277973 | Raccoon | RacHwy | N |
Map of the Folsom area, with animal sightings in BLUE
.
Analysis
I had intended to find a map of Folsom in each of the Census yearsof 1990 and 2000. I wanted to show the change in the city boundariesby overlaying the maps. However, due to privacy issues affectingthe Census data, I was not able to get a map of great enough detail atthe city level to show the city boundaries. I either had a full mapof the city with a few major roads, or a block area map of just a few streets. I needed a city map with the streets visible and labeled in order to drawthe greenbelt areas I knew to be wildlife habitat.
I intended to overlay the two maps and, in ArcView, draw the areas lostto development in green. Over this map, I would have placed my waypointsof wildlife sightings. Because I was unable to create an overlaymap of two Census maps, I used the StreetMap software. Since I usedStreetMap, I was unable to georeference on top of my map of Folsom. I therefore created a table of the coordinates of the animal sightingsin an Excel spreadsheet, and pasted it into the html document.
Conclusion
Further research could be done along the lines of the method of theKansas white-tailed deer study. In the Kansas study, vegetation areaswere studied to determine the type of forage eaten by the white-taileddeer, and the type most conducive to protective cover. Studying thevegetation in the Folsom area would help identify the most likely areasof wildlife forage and cover, and therefore, the areas that could moreaggressively be protected from future development. Or at a minimum,the areas that could be linked to similar areas to provide a safer passagefor wildlife migration.
References
Bagby, jeffrey., and Ling Bian. 1992. "Urbanization andIts Impact on White-Tailed Deer (Odolcoleus Virginianus) Habitat: A GIS/RemoreSensing Approach" GIS/LIS '92 Annual Conference and Exposition November10-12, 1992, San Jose, California. 1:42-50.
Nellis, D., J. Bathgate and J. Briggs. 1992 "Geographic InformationSystems for Modeling Bison Impact on Sonza Prairie, Kansas" GIS/LIS'92 Annual Conference and Exposition November 10-12, 1992, San Jose, California. 2: 618-622.
* For the purposes of this study, a green belt area is an openspace of grasses, or a forested region. It is undeveloped space.