| Title Desktop GIS and Flier Sales in Wholesale Distribution | |
|
Author Vince Borah American River College, Geography 26: Data Acquisition in GIS; Fall 2002 | |
|
Abstract Desktop GIS is growing in its capabilities as a tool for small businesses. One of the businesses that can make use of GIS is the wholesale distribution business. I used ArcGIS software and various shapefiles to create and overlay system. I also joined a demographic table with the Census tracts shapefile for the purpose of queries. I then designed an ERD to be coupled with the 5-theme GIS. I found zip code demographic charts and tables for viewing available on-line. A great deal of zip code data is available, but a lot of it is for sale. I then created a conceptual model for how geocoding could be integrated into the system. I found that it could be very useful as a tool in the business. | |
|
Introduction There are many different ways that GIS is being used today. There are many more ways that it can be applied that are being developed. One of those ways is the use of GIS as a tool in small businesses. Many large businesses already use it as a tool. However, the most effective and powerful GIS software was initially developed for large projects. Accordingly, it is very expensive and not affordable with respect to small businesses. However, as the large commercial versions have continued to be developed so have smaller versions. Desktop GIS software can be effectively used on a single PC workstation. This makes it economically available for use by small businesses. The purpose of this paper is to explore how Desktop GIS can be used as a tool for the homebased wholesale distribution business with respect to market analysis. Further, for the purpose of the project, I will delimit the study area to Sacramento County. | |
|
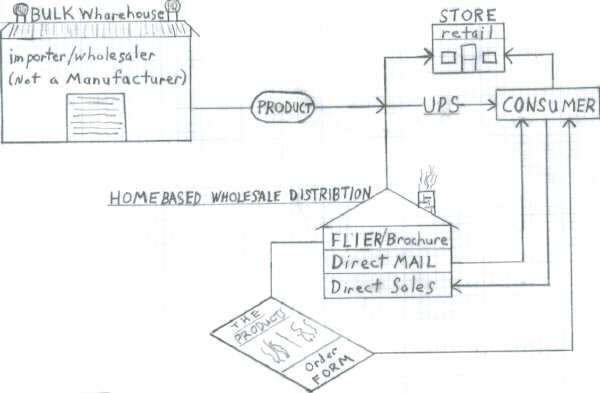
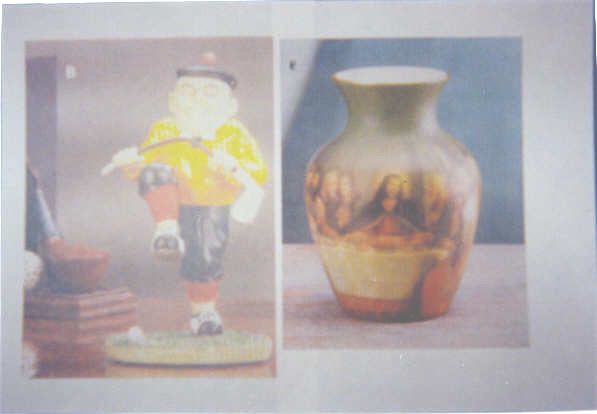
Background The wholesale Distribution business involves many aspects in the process of moving a product from the bulk warehouse to the customer’s door. My interest is in a particular aspect of the process. It is the person who solicits the customer through advertisement with respect to contact. If a person chooses to order a product in the advertisement, the customer sends the order form and check to the solicitor through the mail. The homebased distributor then forwards the wholesale cost to the bulk warehouse and keeps the difference between the advertised and the wholesale price of the product. It is then sent directly to the customer via UPS. The bulk warehouse isn’t a retailer and doesn’t have contact with customers. There are many different types of advertisement. Brochures and fliers are the two most commonly used types. Companies that send catalogs through the US Mail and sell directly to the customers at retail are a different type of distribution business. My approach to applying GIS is through the explicit use of a flier with respect to advertisement. An old Exporter once told me,” Find a customer, find out what they want to buy, and then go sell it to them”. After much contemplation, I conceived my own dictum; Find a product that someone will buy, Find a customer that will buy that product, Find a place where they will come to you so you don’t have to go to them. I believe sales via fliers will minimize the amount of investment involved with respect to time and money. I also believe that using GIS as a tool will increase the efficiency of such an endeavor. Hence, fliers and GIS as a tandem can increase efficiency in order to increase profit. Below is a diagram depicting what I've described. Also displayed are two such novelty items that could be sold through my conceptual process. | |
 | |
 | |
|
Methods I used Arcview 8 software to create a personal GIS. There are cheaper software packages that are available for sale. Some have geocoding capabilities and detailed street maps as a base layer. Thomas Bros. Maps sells a California package that comes with a tool extension for geocoding($300). However, I used the Sacramento County Thomas CD($22) and found the accuracy of a location query to be marginal. For my purposes, I chose to use ArcView because of its capabilities with respect to my project. I used the internet to download the Tiger/Line Census 2000 tract SF1 Shapefile and corresponding SF1 dbf as well as the Road Line Shapefile. The projection I used for the layers is NAD_83_UTM_Zone10. I copied with permission an ARC instructor's zip code boundry shapefile. The instructors knowledge of the origin of the shapefile seemed to elude him, but I was able to change the projection file so as to be capatible with my tract and street layer. The zip code shapefile itself was in the State_Plane_II_ft. I then used a Garmin 12XL GPS unit to mark two waypoints, place entities. I downloaded the waypoints to create a point shapefile. The two place entities are a Citrus Heights Church and a Fair Oaks Church. My system is designed to utilize geocoding, but for the sake of the experience I used the GPS for the project. I then created a polygon shapefile via a one-mile buffer for each church, point. The churches themselves aren't significant. Their purpose is to represent two essential layers within the layers of my personal GIS. I also designed a relational database to be coupled with the GIS. It will generate address tables that can be geocoded to create point shapefiles. These can be inserted into the overlays to analyze the spatial relationships of the entities. Then, polygon shapefiles can be created as distance buffers with respect to the point entities for further analysis. One example of the GIS would be to select a favorable tract for a product. Now, I need a place in the tract to distribute. I determine that given this paticular product churches would be a good distribution place. Now, I have churches as a point shapefile in storage. Overlay points on top of tracts polygon and I instantly have a distribution place within the tract polygon. The address is in the table. A crucial part of my GIS relies on geocoding. It will be discussed further in the analysis section. However, if accuracy with respect to latitude and longitude was important, I wouldn't use geocoding. It uses an index and street layer to place a point approximately where it should be according to the street numbering. The corner of a property boundary can't be defined by an approximate location. It needs exact coordinates with respect to the earth's surface. I used a few different methods to produce my visual products. The maps are jpegs that I exported from my personal GIS. The Print_Screens are saved as jpegs. I created the drawings using fade-out graph paper and pencil. I then scanned the drawings with a 48-bit scanner and saved as jpegs. The two novelty items are a scanned photograph, saved as jpeg, that originated from a prodcut catalog. The following four jpegs are My Personal GIS, Print_Screen showing my data types, ERD for db, diagram depicting entity structure. | |
 | |
 | |
 | |
 | |
|
Results My initial task was to decide on my
sources of data. I chose the two most commonly used sources that are
available on-line. They are the zip code and Census tracts. The US Census
offers a variety of types of data. Some of the different shapefiles
include urbanized areas, counties, school districts, Congressional
districts, etc.. However, for my purpose, the census tracts provided the
smallest delimiting polygons. The Census has SF1, SF2, and SF3 for the
census tracts. I downloaded SF1 for free at what I consider a
user-friendly ESRI sight, Arcdata.esri.com. I didn't locate SF2, but I did
locate SF3 at the Census sight. It has 813 tables and is available for
CA-$75 on 2 CDs. SF1 dbf has some basic demographic information, but I
would need the SF3 to make in-depth market analysis beyond age, m/f, race,
housing. US Census also offers ZCTA, zip code, boundary shapefiles for
free and census data with respect to those polygons, but it's not as
user-friendly as the ESRI sight. There is some zip code data for free
on-line, but there is also a great deal of it for sale. It was had to
discern at times. I did not quickly find a zip code demographic dbf to
download that could be joined to my shapefile in my Personal GIS. There is
zip code charts and tables for viewing on-line. I will demonstrate this
later. Factfinder.census.gov is a good sight for tables. However, you can
quickly do queries with respect to selection of polygons when a table is
joined with a shapefile. Zip code data that comes bundled with application
software is available for sale. ESRI has for sale 3 CDs-$500 that contains
zip code data for the United States. It's also available in a hard-copy
for the same price. Fortunately, the public library has it available in
the reference section. I looked through it and found most of it not
particularly useful for my project. I did find two indexes out of four
pages that I though might be useful. They are in the Spending Potential
Index section. The 95829 with respect to Sacramento County has a 132 and
134 in toys&games and sports equipment respectively. It was the
highest for the county zips. Another possibility with respect to my zip
code shapefile is to create my own tables in Access or Excel. Then join
the feature id table and the created attribute table. Now, it would be
possible to do selection queries. This is possible on a small scale, but
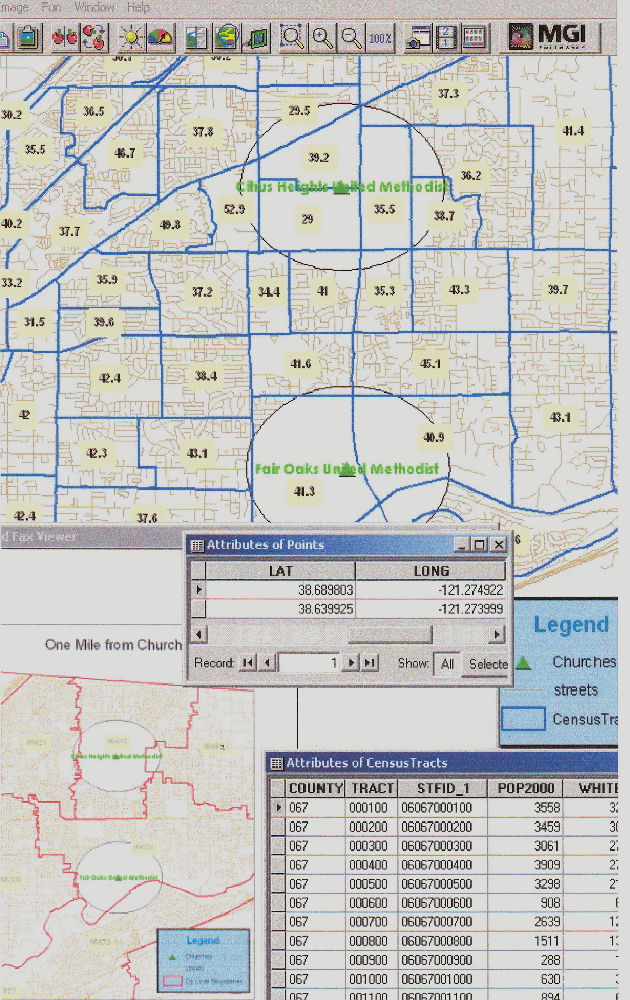
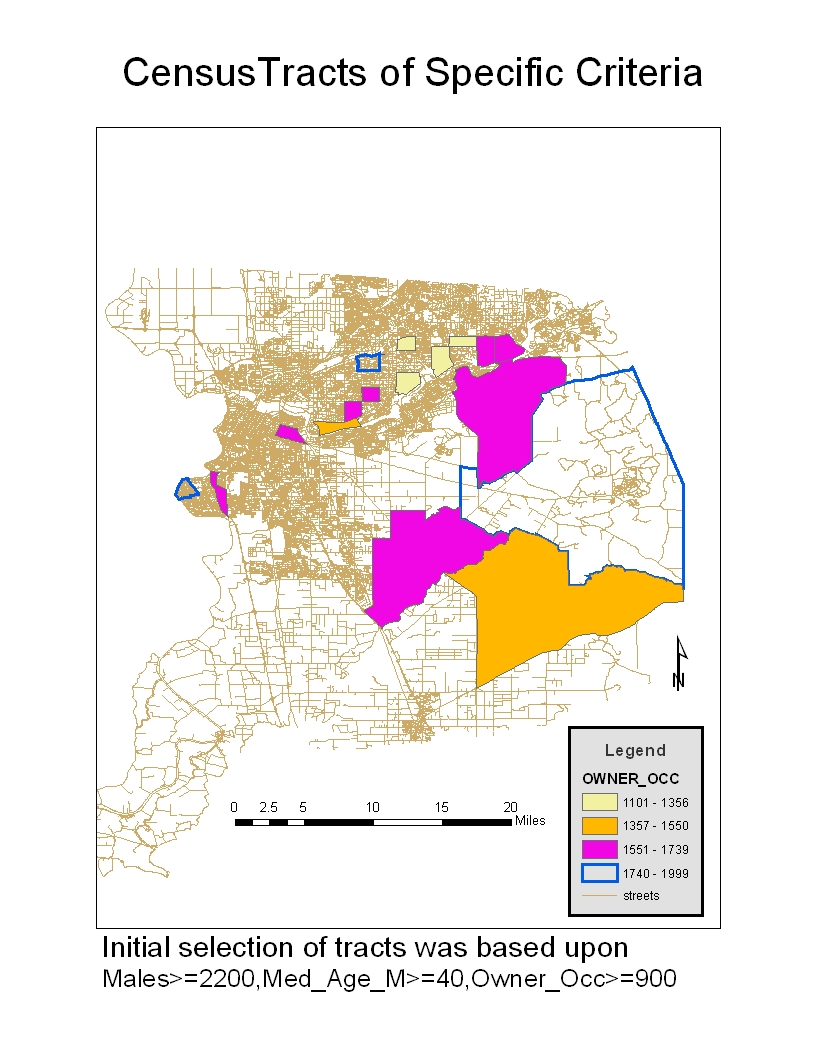
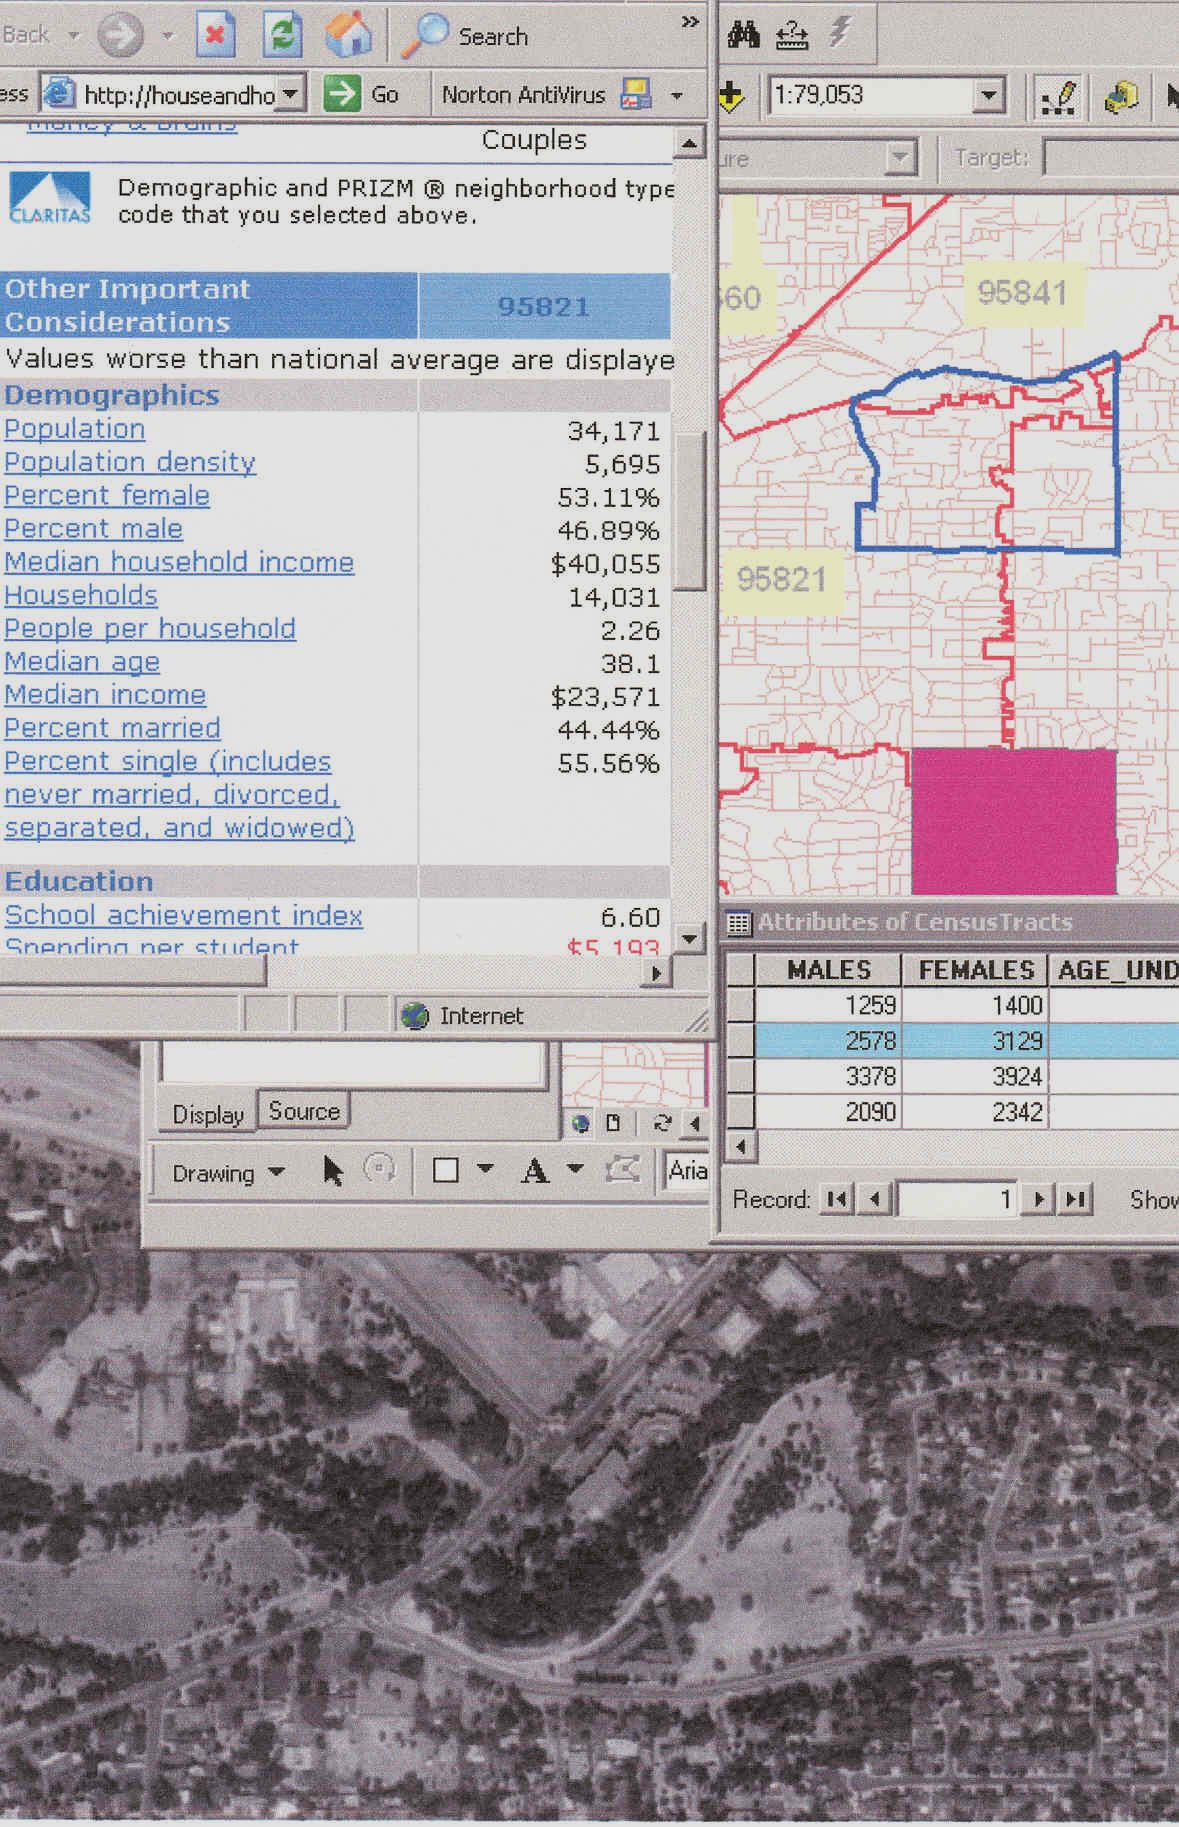
would probably not be realistic on a large scale project.The following three jpegs will demonstrate the point of the query process. The first is a map of selected tracts. Initially, I selected tracts based upon the criteria listed on the bottom of the map. Then, I classified the Selected_Tracts_Layer by population with respect to the base criteria. The query revealed two small concentrated tracts in the North and West respectively. It also has revealed a very large tract that is high in numbers. However, since its visually noticeable that it is enormous in size, it's obvious that it is not concentrated. Therefore, this is an undesirable tract. The most attractive is the little blue-outline tract in the top center. The next jpeg is a Print_Screen of how visual analysis can be helpful. It's also a good example of what I call the double filter process. By putting one layer of attributes on top of another, you can enhance the ability of both. Of course, it would work best when I join attributes to the zip code shapefile. However, the following will suffice. The said selected tract was zoomed upon. I opened up the tract attribute table to look at the record for the selected tract. I also opened up a demographic table that is available free on-line at terraserver, homeadvisor.msn.com. The bottom is an aerial photo of the area that is also available on-line at terraserver. This allows me to see the target area in the real world. The next jpeg is a Print_Screen of hypothetical customers, point shapefile. I actually reassigned with respect to entity the two GPS church-waypoints to the new customers. The purpose is to demonstrate how you could analyze surrounding area as opposed to looking through a funnel for containment area. I also used the Thomas Sacramento CD. Thomas's window reveals a school symbol. Hypothetically, the customer purchased an educational toy. My prediction is that she probably has kids and is interested in their education. I could be wrong, but I could be right and make another sale. | |
 | |
 | |
 | |
|
Analysis Initially, the strength of the
system would be demographic, then it it would become the shapefile and
queries, then it would become to find attributes that are now know to be
matches with specific products. The depth of the demographics would play a
crucial role in the systems success.The system is applicable to homebased wholesale distribution and would be beneficial. By applying basic GIS principals, a system that can grow and improve in ability will be created using my model. "Most often, a GIS presents information in the form of maps and symbols. Looking at a map gives you the knowledge of where things are, what they are, how they can be reached by means of roads or other transport, and what things are adjacent and nearby. A GIS can also disseminate information through an interactive session with maps on a personal computer. This interaction reveals information that is not apparent on a printed map."(Zeiler,1999) | |
 | |
|
Conclusions In exploring the process of how
I could apply Desktop GIS to homebased whosale distribution, I developed
my Flier-Customer GIS Model. Initially, the use of fliers as a sales tool
seemed like just a good idea with respect to minimizing your invesment. I
now feel, Desktop GIS as a tool in coordination with sales via fliers can
be a very efficient way of approaching the homebased wholesale
distribution business. | |
|
References Zeiler, Michael 1999. Modeling our World/the ESRI Guide to Geodatabase Design, pg-2. | |