Title Sacramento Inter-Urban Light Rail Proposal | |||||||||||||||||||
|
Author Patrick Hennessy American River College, Geography 26 Data Acquisition in GIS; Fall 2002 Contact Information: phennessy@ucsbalum.com | |||||||||||||||||||
|
Abstract The Sacramento Regional Transit District is expanding the light rail system to serve a growing population. The areas of Arden, Carmichael, Fair Oaks, and Citrus Heights are not going to be directly served by the current and proposed expansions even though they are a highly populated portion of the metropolitan area. Lack of a transportation corridor such as railroads and the natural barrier created by the American River have isolated these areas from any convenient light rail options. Five possible inter-urban routes were derived and analyzed using US Census tract data to approximate the population that can potentially be served by the proposed routes. In addition to population, the length of the route, station locations and other factors were considered in the decision of the proposed inter-urban light rail route. The route chosen (route 5) was highly valued for the variety of accessible cultural sites. | |||||||||||||||||||
|
Introduction The Sacramento Regional Transit District (RT) operates 77 bus routes and 20.6 miles of light rail covering a 418 square-mile service area. The focus of this paper is the light rail system that RT has developed and plans to expand. Current expansion includes the new South Sacramento Line and extending the current line to the city of Folsom. Future improvements include a Natomas/Arco Arena/Airport line, an extension from downtown Sacramento across the river to West Sacramento and a continuation of the South Sacramento Line east to Consumnes River College and adjacent residential areas. Just on the existing line alone, ridership has increased from 14 million passengers in 1987 to more than 27 million passengers in 2001 (SacRT). The majority of the light rail lines (current and planned) utilize existing or old railroad corridors, but that strategy cannot serve the large urban areas of Arden, Carmichael, Fair Oaks and Citrus Heights. This is unfortunately the result of a geographic location with natural transportation barriers such as the American River, and also because development starting in the 1920s in these areas focused on the automobile. This paper explores the potential for an inter-urban light rail line that will serve these neighborhoods. This proposal will only consider one new line due to the financial costs and infrastructure changes it would require. The inter-urban light rail will have multiple routes and the areas they serve analyzed with spatial population data by census tract. Additionally, the potential for the streets to fit a light rail track and station location will be a major component of the analysis. | |||||||||||||||||||
|
Background Public Transportation is on the rise in the Sacramento area. Regional Transit has built a cost effective light rail line carrying 30,000 passengers on a typical weekday (SacRT) and is expanding the light rail system to serve more people. The future extensions plan to make the system more comprehensive, but the urban development of the Sacramento area was influenced by flood control, the automobile, and a natural transportation barrier, the American River. The original settlement founded by Captain Sutter was on higher ground, but after the discovery of gold the city moved to the Sacramento River waterfront to handle the shipment of supplies (Gage 5). During the late 19th century and early 20th century, the constant recurrence of winter floods prompted the residents to build levees for protection. These levees developed a sense of security during the 1950s in the areas that were not affected by flooding for approximately 50 years (Gage12). Prior to the urban development, lands north of the American River were sold in small parcels promoted as agricultural opportunities, but these typically failed or couldn’t support a living and most farming was abandoned (Gage 15). The areas of Arden, Carmichael, Fair Oaks and Citrus Heights were ready to grow by the 1950s. Town and County Village at the intersection of Marconi and Fulton started off as a small 90 foot building that had a few shops. The location of these shops were very convenient and the stores grew in popularity (Gage 43). Later the city became a hub for the new highway systems in Northern California. Consequently, the original trolley lines that connected the suburbs with the central city were neglected and eventually abandoned in favor of the car and highway. The area developed other businesses with new residents and the urban development continued. Public Transportation was never planned for in the development of these areas, and there probably wasn’t any planning. This was probably due to these areas lying outside of the city limits. The traffic congestion has only increased over the years and the area is still adding residents. Larger parcels of land are now being subdivided into smaller plots with large homes and small yards, Thereby increasing the population density of the area and creating a higher demand for public transportation. The Sacramento Area Council of Governments (SACOG) created a Metropolitan Transportation Plan for 2025. This council has control of federal and state money that is earmarked for transportation projects in the area. The proposal for an inter-urban light rail line serving Arden, Carmichael, Fair Oaks and Citrus Heights would have to consider the future extensions that are already planned and how other transportation projects identified in the Metropolitan Transportation Plan will change the public transportation in those areas. Within the plan, Stockton Blvd., Watt Ave., and Sunrise Blvd. will have bus rapid transit that will act as express routes up and down those streets (15). Transportation projects such as those were taken into consideration when the different potential inter-urban routes were compiled. The highly populated urban environment of Arden, Carmichael, Fair Oaks, and Citrus Heights is situated in a void of the future light rail system. This project is a proposal to build a light rail line that will travel on the street so that a large portion of the areas previously mentioned can have another transportation option besides the car or bus. | |||||||||||||||||||
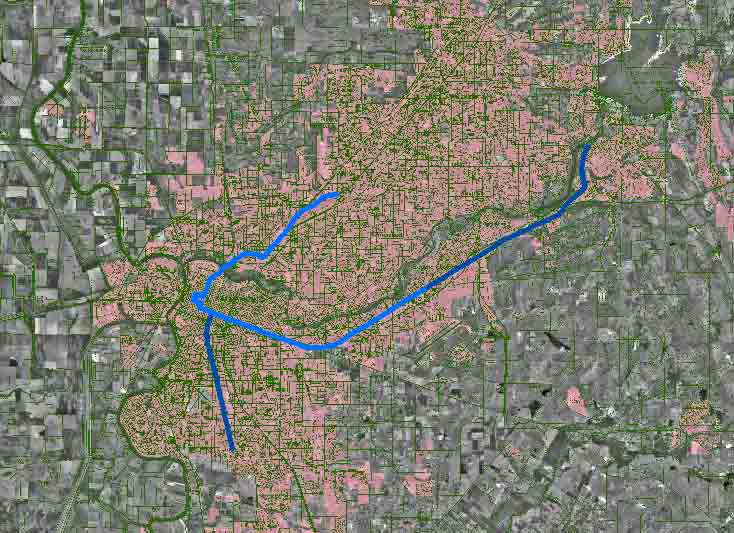
(Right) Sacramento Light Rail System in 2005 Light Blue = existing light rail Dark Blue = South Line and Folsom extensions Light Red =urban areas* Dark Green = road and cultural base map* Black & White Background = SPOT satellite image* * = obtained from California Department of Conservation, Farmland Mapping and Monitoring Program. |
| ||||||||||||||||||
(Right) Future extensions Solid Green = Roseville, South Line, and West Sacramento extensions Dotted Green = Natomas/Airport Extension These extensions already have Environmental Impact Reports compiled and/or were indicated by RT as future projects. The Natomas/Airport line is dotted with three routes because the actual route hasn't been chosen yet. |

| ||||||||||||||||||
|
Methods To begin spatially analyzing the possible inter-urban light rail lines, the existing light rail and current extensions had to be input into a GIS (ESRI ArcMap 8.1). The US Geological Survey 1:24,000 quads were loaded into the GIS as Digital Raster Graphics (DRGs). The light rail lines were digitized on screen from the quads using ancillary information from the Regional Transit website. The different possible inter-urban routes were designed with several criteria considered such as street width, station location, commercial business access, traffic, and the length of the route. These routes were also digitized on screen from the quads. | |||||||||||||||||||
| Now that the possible routes were determined, the US census data was needed to spatially analyze the routes with population. A shapefile of the US Census tracts for Sacramento County was downloaded from the ESRI free download website, but the associated attribute table didn’t make sense or come with a clear data dictionary. The table did have the census tract identification number, so an excel table that also has the identification numbers was downloaded from the US Census website. The excel file was saved as a database (dbase) file, and added to the GIS as a table. Now the shapefile and the population table could be joined, except that they wouldn’t. The Census tract identification numbers were being truncated when the join was attempted causing the numbers to the right of the decimal point to drop off. The table columns were reformatted from general to number but this was not successful either. So the original excel file was imported into a geodatabase and the columns were reformatted using Microsoft Access within the geodatabase. This allowed the table to join with the shapefile of the census tracts and the spatial analysis began. A one-mile buffer was created around each possible inter-urban route. One mile was chosen because it is a reasonable walking distance to the light rail. This would allow some people to avoid using a car for the work commute, shopping, or personal business. Once the one-mile buffer was created, the US Census tract data was added to the GIS. The portions of the buffer that intersected the census tract data were merged to create a polygon indicating the census tracts spatially overlapping the buffer. The total of the census tract populations within the buffer was calculated and called the service population for each possible inter-urban route. |
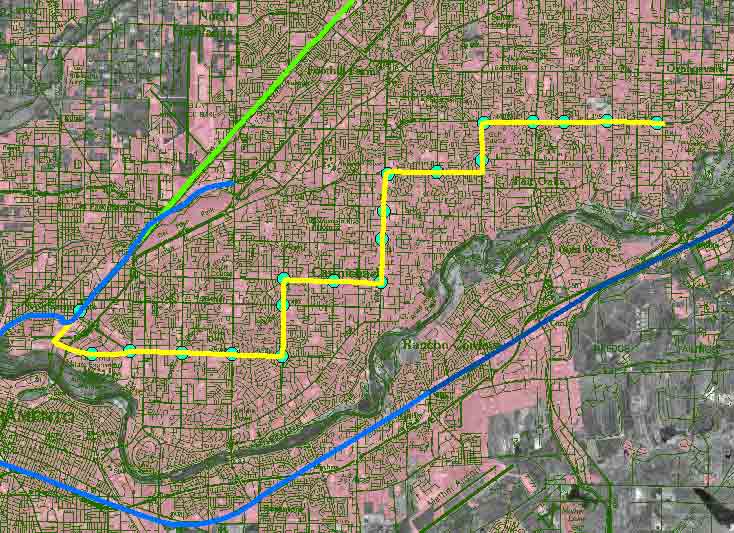
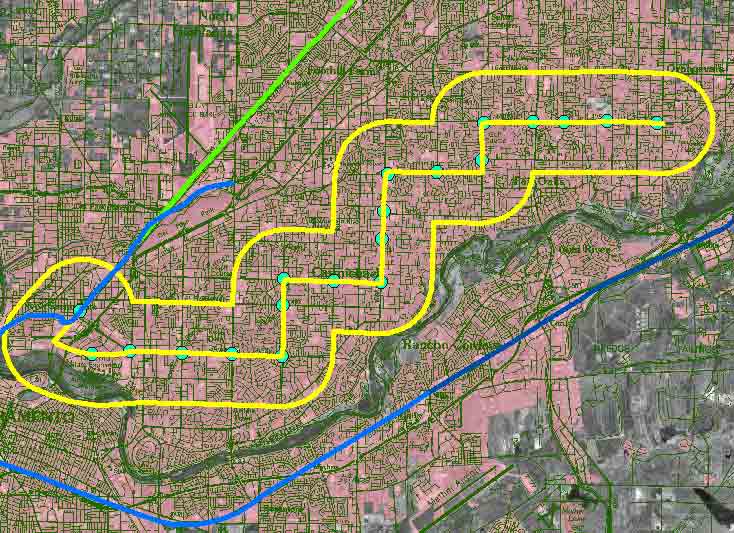
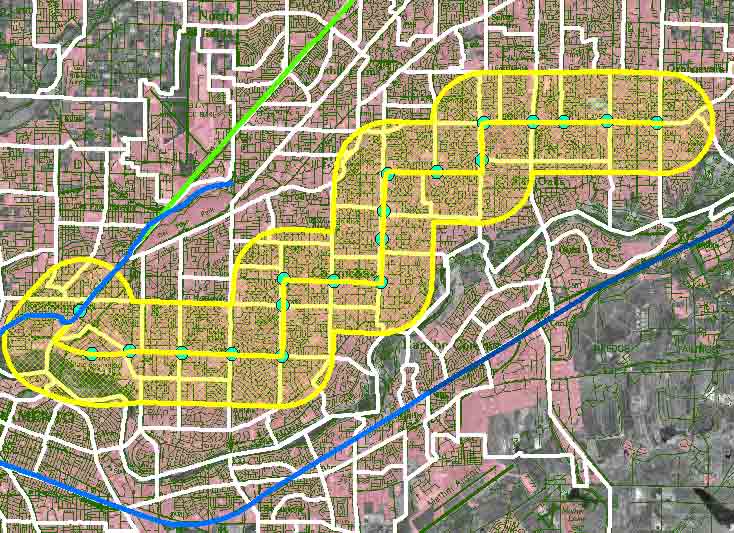
 (Top to Bottom) Proposed inter-urban route with stations. 1 mile buffer. 1 mile buffer with US Census tracts. Service population. | ||||||||||||||||||
|
Results | |||||||||||||||||||
|
This table summarizes the GIS analysis of the five different possible inter-urban routes. The route length is from the beginning to the end of the line. This length is not doubled for using double tracks on the route. | ||||||||||||||||||
|
Advantages of Proposed Inter-urban route | |||||||||||||||||||
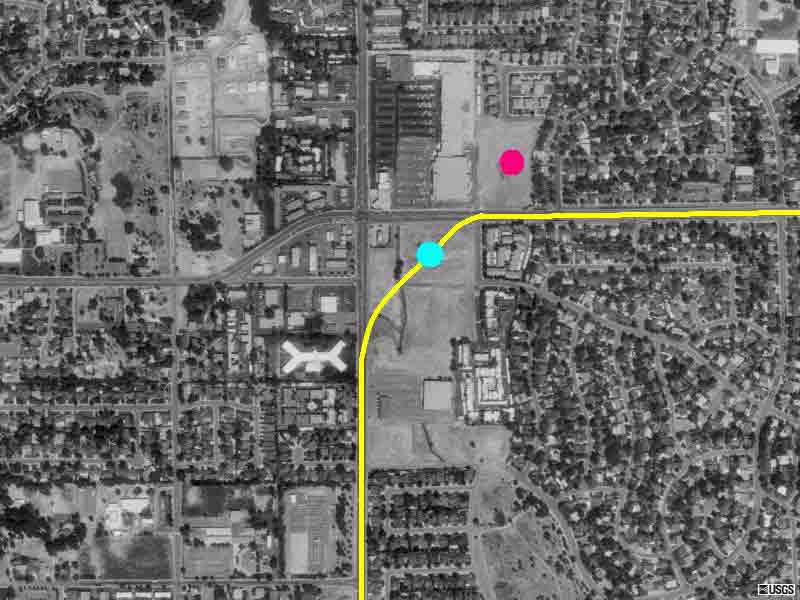 |
(Left) The intersection of Manzanita Ave. and Winding Way. There is a large undeveloped parcel of land there that would serve as a great transit center. The proposed route is shown as the yellow line, the transit center could be at the blue dot. The red dot is a new senior living center. The location is approximately half way along the proposed route, also a good attribute for a transit center. Buses can continue from here to points not adaquently served by light rail. | ||||||||||||||||||
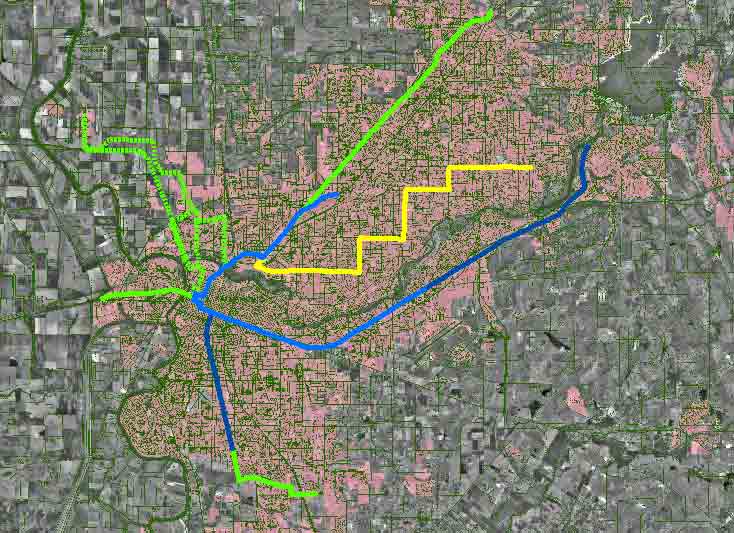 |
(Left) Vision of the Future Sacramento Light Rail System Yellow = proposed inter-urban route Light Blue = existing light rail Dark Blue = South Line and Folsom extensions Dotted Green = Natomas/Airport extension Solid Green = Roseville, South Line, & West Sac. extensionsn A look at the system from this scale shows how the inter-urban route makes the whole system more comprehensive. | ||||||||||||||||||
|
Analysis The service population results are similar to each other, and they should be. The different routes are trying to serve the same area in different ways, but the areas stay the same. The service population became less important in the final choice of possible routes because of the similar values. Only route 1 is negatively reflected in the service population results. | |||||||||||||||||||
|
Conclusions | |||||||||||||||||||
|
References Barrows, Matthew. December 6, 2002 Sacramento Bee. Folsom Light-rail line's cost soars. (from Sacbee.com website) California Department of Conservation, Division of Land Resource Protection, Farmland Mapping and Monitoring Program. 801 K Street Sacramento, CA 95814. http://www.conservation.ca.gov/dlrp/fmmp Environmental Science Associates Inc., 1992. Antelope Light Rail Extension Environmental Impact Report: Final. Sacramento, California. Environmental Science Associates Inc., 1994. Roseville LRT Extension Environmental Impact Report: Final. Sacramento, California. Gage, Daniel D., and B. E. Tsagris, 1960. Emerging Pattern of Commercial Sites: A Case Study of Directional Growth Problem in the Metropolitan Sacramento Area. Sacramento, California. Korve, Hans W., et al. 1996. Integration of Light Rail Transit into City Streets. Transit Cooperative Research Program. Washington D.C. Sacramento Area Council of Governments (SACOG), 2002. Metropolitan Transportation Plan for 2025 Final Draft. Sacramento, California. http://www.census.gov http://www.geocities.com/ortraxandroads/rollingstock.html http://www.geographynetwork.com/freeresources.html http://www.lightrail.com/projects.htm http://www.portlandtransit.org http://www.sacrt.com http://www.terraserver.homeadvisor.msn.com . | |||||||||||||||||||