|
 Background Concentrations of Copper and Zinc in
Soils and Waters of the U.S. | |
Mark Jones
American River College,
Geography 26: Data Acquisition in GIS; Fall 2002
Abstract Introduction Background Methods
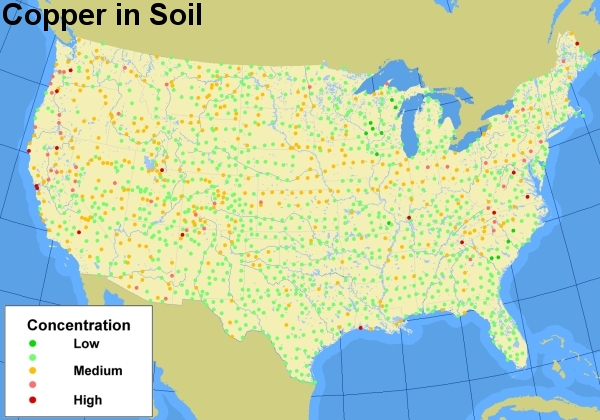
Results U.S. soil data were obtained from the USGS open file report 81-197 (Boerngen and Shacklette, 1981). This data set contains geochemical data from soils and other regoliths collected and analyzed by Hans Shacklette and colleagues beginning in 1958 and continuing until about 1976. Geochemical point-symbol maps were plotted from these data and published as USGS Professional Paper 1270 entitled "Element Concentrations in Soils and Other Surficial Materials of the Conterminous United States." The samples were collected at a depth of about 20 cm from sites that, insofar as possible, had surficial materials that were very little altered from their natural condition and that supported native plants. These data provide a low-density geochemical baseline for soils and other surficial materials in the conterminous U.S. The data set contains 1,323 samples for a sampling density of approximately one sample per 6,000 square kilometers. The data are most appropriately used to provide information on background concentrations of elements in soil. The major drawback with the data set is its extremely low number of samples for the entire conterminous U.S. However, it is a more representative sampling than the water data, due to the fact that the sampling effort followed a standard protocol and a statistically based sampling design. Analysis Figure 1 shows the results for copper in soil. The southern and southeastern regions of the U.S. generally have low levels of copper. There is a strip across the country, close to where Interstate 80 runs, where copper values are slightly elevated. The highest concentrations are found near the Appalachian mountain range, in the Rocky Mountains, and along the west coast.
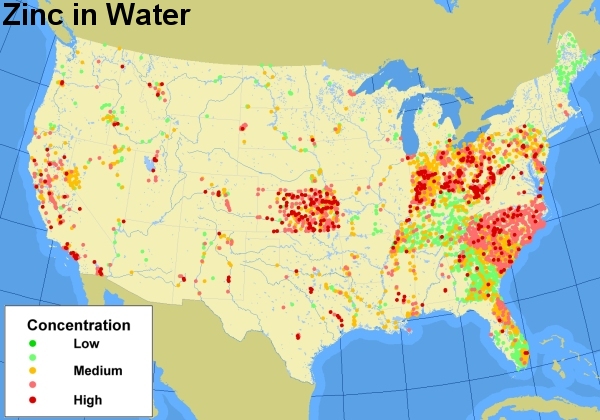
Figure 2 shows the results for zinc in soil. The values for zinc are varied and carry less spatial continuity than copper. The most apparent spatial trend is that the southeast U.S. has levels of low zinc, while the west and northwest U.S. have a greater concentration of high zinc. Figure 3 shows the results for total copper in water. Due to the large number of heterogeneous samples in the eastern U.S., it is difficult to determine large regions of similar metal concentrations based on the point map. The southeastern U.S. has low concentrations of total copper, but no other extrapolations are supported by the data. Figure 4 shows the results for total zinc in water. The eastern U.S. has many samples of differing concentrations, with the only area of clear low detection being Maine. Areas of high concentrations are Kansas, California, and most of the east coast.Conclusions This project and the accompanying maps represent a comprehensive effort to collect information on background concentrations of copper and zinc in the U.S. Soil data are representational, but are nearly 25 years old, while water data are considerably more sparse, but cover a larger range of years. Use of ArcView maps provides a valuable tool for visualization of the data as well as for grouping data into areas of similar background levels. This effort provides the data in a spatially explicit framework for further refinements of the database and development of ecologically and geochemically based metalloregions. For the U.S. waters, further information may be available from individual
states, but are not readily retrievable in electronic forms or in a manner
consistent with this spatially-dependant database. It would be useful for
states to coordinate their reporting of routine water quality monitoring
data in a manner that makes such results readily retrievable. For example, significant
amounts of water data for California were missing from the STORET database.
Similar data and maps could be developed for other metals of interest. In addition, the data could be spatially correlated with urban areas to remove locations potentially impacted by anthropogenic sources. This would provide a better representation of natural background levels. The data could also be used to perform spatial analysis with vegetation types, etc. References Boerngen, J.G., and H.T. Shacklette, 1981. Chemical analyses of soils and other surficial materials of the conterminous United States: U.S. Geological Survey Open-File Report 81-197. U.S. Geological Survey, Denver, CO. Connor, J.J. and H.T. Shacklette, 1975. Background geochemistry of some rocks, soils, plants, and vegetables in the conterminous United States. United States Government Printing Office, Washington, D.C. McClendon, J.H., 1976. Elemental abundance as a factor in the origins of mineral nutrient requirements. Journal of Molecular Evolution, 8:175-195. Shacklette, H.T. and J.G. Boerngen, 1984. Element concentrations in
soils and other surficial materials of the conterminous United States.
United States Government Printing Office, Washington, D.C. U.S. Environmental Protection Agency, 2000. The Storage and Retrieval of Water Quality Data. Retrieved from: http://www.epa.gov/storet/. | |||||||||