Author Information
Jack Kemp
American River College, Geography 26: Data Acquisition in GIS; Fall
2002
5316 L Street, Sacramento, CA, 95819
Tel: (916) 451-6862
E-mail: jkemp99@earthlink.net
Abstract
The utilization of GPS and GIS for bicycle-transportation advocacy
was assessed for two applications 1) development of a user-recommended
bicycle route network, and 2) documentation of hazardous locations on a
bicycle route. Problems associated with using a GPS to map bicycle routes
were identified, and include signal loss, and signal drift from the actual
route. GPS tracks would require editing and review before being submitted
into a geodatabase containing bicycle routes. Hazardous locations can be
clearly documented using a combination of GPS, digital photography, and
GIS mapping. Hazardous locations which are mapped could included
with a geodatabase containing bicycle routes.
Introduction
Field mapping using a Global Positioning Satellite (GPS) device and
integration of the field data with a Geographic Information System (GIS)
was evaluated as a tool for bicycle transportation advocacy. Two
case studies were evaluated:
1) Utilization of a GPS and GIS to map bicycle routes; and
2) Utilization of a GPS and GIS to map hazardous locations on bicycle
routes.
This document describes procedures used to collect, manage and evaluate
geographic and attribute data associated with bicycle routes and transportation
infrastructure. The objective of this study was to evaluate
the feasibility of using GPS and GIS as tools for bicycle advocacy.
Evaluation was based on several aspects, including the accuracy of data
collected with a GPS device, and requirements necessary to capture, manage,
and map the data using a GIS.
Background
The general public now has increased access to GPS devices and GIS
software as a result of rapidly declining costs for these tools.
The availability of these tools, combined with the removal of selective
availability for GPS, creates the possibility for bicyclists to map routes
and hazardous locations, and share this geographic information with other
cyclists and urban planners. The Internet further enhances the potential
for citizens to collect and disseminate geographic data.
The author envisions a web-based, public-access forum to promote and improve bicycle transportation using GPS and GIS. Bicycle routes actually used by cyclists could be mapped and posted on the Internet, and compared with officially mapped routes in order to select the safest, most efficient route for the individual user. Hazardous sections of bicycle routes could be mapped with reasonable accuracy using a GPS device, and submitted to agencies responsible for transportation planning and infrastructure.
Maps of urban and regional bicycle routes are becoming increasingly
available on the Internet. The attribute richness of these
maps varies considerably. Bicycles routes in the central Sacramento
urban region are posted at www.bikewaymap.com.,
which maps on-road and off-road route segments, and light rail stations.
The city of Portland, Oregon publishes a benchmark-standard bicycle transportation
map (http://www.trans.ci.portland.or.us/Bicycles/images/MapFinal.gif
). Mapped routes are assigned four categories, based on safety levels:
+ Multi_Use: No motorized vehicles (MVs);
+ Bike_Lanes: Bike lane shared with MVs on high traffic-volume streets;
+ Shared_Motorway: Bike lane shared with MVs on low traffic-volume
streets;
+ Difficult_Connections: Dangerous volumes of MV traffic.
Identification of hazardous locations is intuitive, but numerous factors can be assessed and quantified in order to assess the relative degree of danger posed by a site-specific of bicycle route. The presence or absence of MVs is the most critical factor, as implied by the Portland classification scheme. Other factors include:
+ Daily MV traffic count;
+ MV velocity;
+ Type of MV/Bicycle interaction (merger, intersection)
+ Lane width;
+ Traffic Controls (signs, stripes, warning lights);
+ Bicycle lane profile (sharp edges, curved edge);
+ Shared transport modes (pedestrian).
Additional information on bicycle route planning can be found in the Victoria Transport Policy Institute, 2002. Pedestrian and Bicycle Planning - A Guide to Best Practices (http://www.vtpi.org/0_nmt.htm). Bicycle route construction standards for the Sacramento region are published by the California Department of Transportation (CADOT) in Chapter 1000 of the Highway Design Manual. (CADOT, 1993).
Methods
Two stages of data collection and assessment were conducted:
1) field data collection using a GPS device, and 2) data management using
a GIS.
Field mapping was conducted using a Garmin XL12 GPS. A bicycle route was mapped using the Track option on the GPS. The Track option has the advantage of allowing data collection during active cycling, without requiring that cyclists operate the GPS. The Track mode was activated, and the GPS was placed in a bicycle pannier for the duration of the trip. The Track was converted to a route shapefile using ArcView and the ArcGarmin extension. The data was projected to register with the East Sacramento, CA 7.5 quadrangle (1980 revision, 1927 North American datum, polyconic projection).
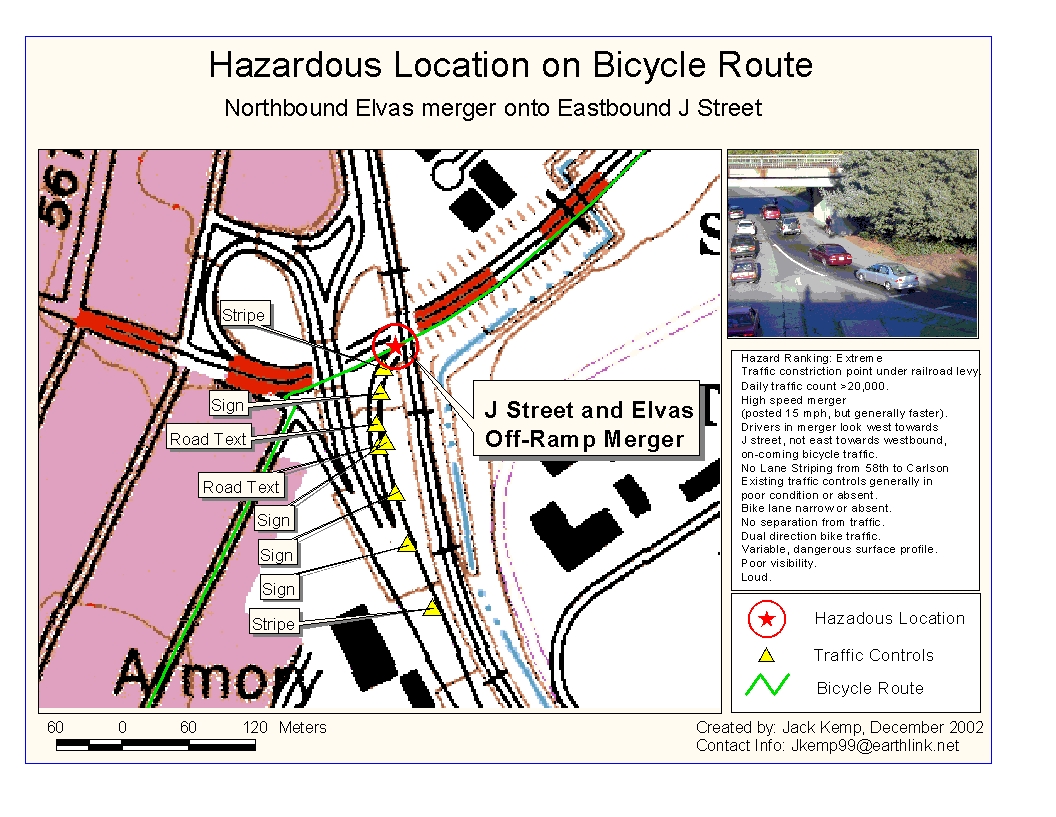
A hazardous location was mapped using a GPS by locating traffic controls associated with the eastbound/westbound section of a bicycle route in east Sacramento where northbound traffic from Elvas Avenue merges into eastbound traffic on J Street. Traffic controls mapped included signs, stripes, and road text. A digital camera was used to document the condition of each traffic control.
Traffic volume data for the intersection were obtained from the City
of Sacramento Public Works Department (http://www.pwsacramento.com/traffic/trafficcounts/list.cfm).
According to published data, Average Daily Traffic (ADT) counts for J Street
is approximately 17,000 in 1986. ADT counts for Elvas Ave were approximately
16,000 using 1998 data.
Results
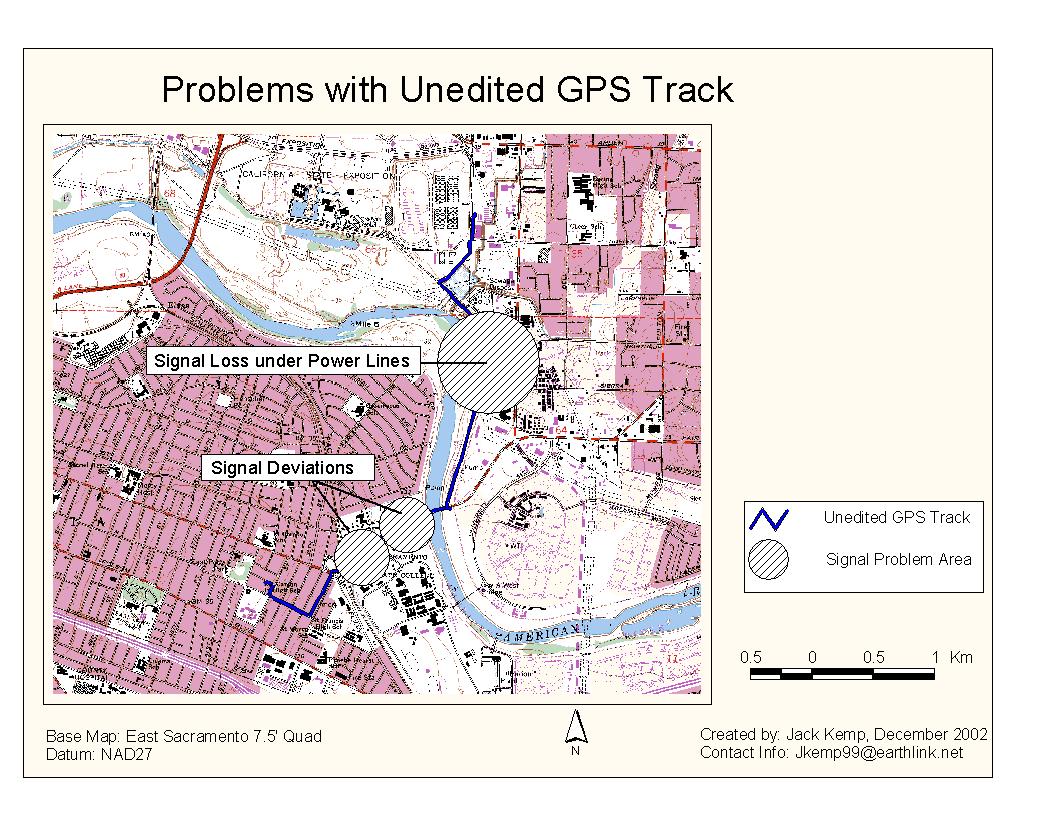
The Track was assessed for completeness and accuracy. The quality of
data obtained from the GPS in Track mode had several problems which could
affect the usefulness of using the data to accurately map routes. As shown
in Figure 1, the signal was lost when the path intersected a high-voltage
transmission corridor.
Figure 1: Problems with Unedited GPS Track
The GPS Track also had problems associated with signal drift.
The Track showed wide variance along a section of J Street, as indicated
in Figure 2.

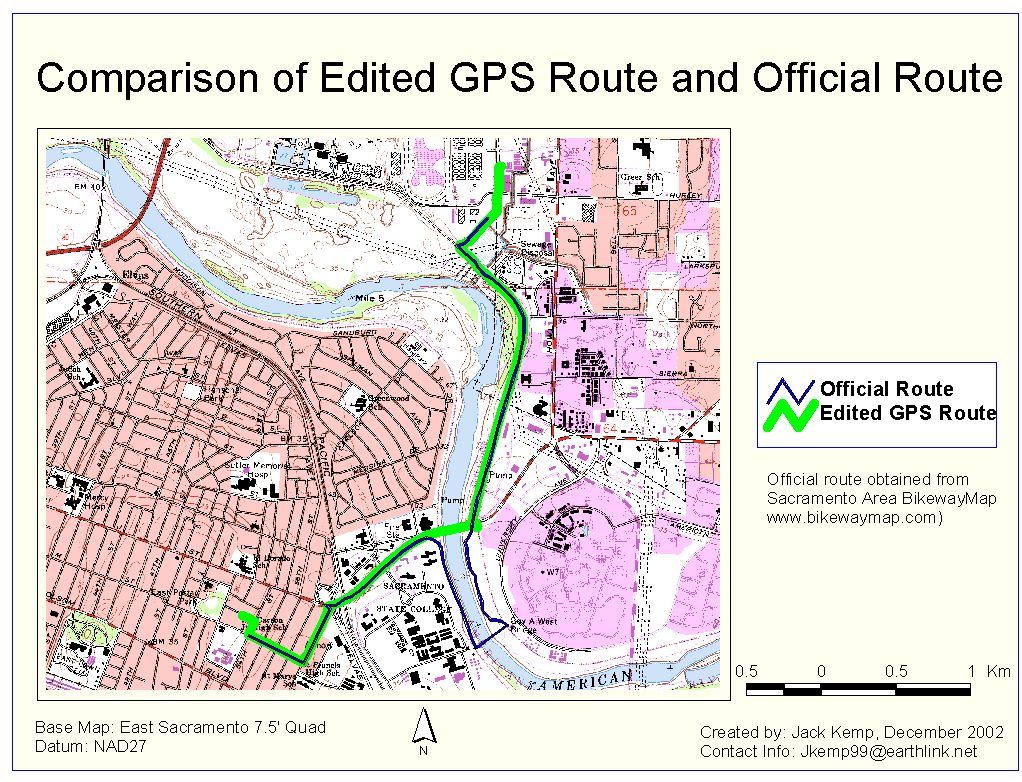
The Track was converted to a route shapefile, and edited to correct the missing segment under the powerlines, and to correct the route deviations along J street. The edited route was then compared with the official route posted at www.bikewaymap.com. The comparison of routes is shown in Figure 3. Notable on the official route is the detour away from the Fair Oaks Bridge.
Figure 3: Comparison of Edited GPS Route and Official Route
Traffic control features associated with the hazardous location at the Elvas Avenue/J Street merger were mapped using the GPS. The mapped features are indicated in Figure 4. General attributes of each feature such as condition (good/poor) and visibility were entered into the table containing the traffic control geospatial data. Digital photos were obtained for each mapped feature, and have been included in the ArcView project file as hot links. Independent review of a feature using the hot link could help clarify subjective qualities such as poor condition. The photographs also serve to document site conditions at the time of the survey. An overview photograph of the merger was included in Figure 4, along with text describing specific hazards associated with the location.
Analysis
Mapping bicycle routes using a GPS Track is effective method to acquire
reasonably accurate geospatial data. The Track method allows for
data collection while cycling, without the distraction of operating the
GPS device. However, the Track method can result in signal loss,
or data deviations from the actual route. The data loss and deviations
required that the original Track be edited to match the ground conditions.
This implies that all routes obtained using a GPS Track would require careful
quality control, and editing before being integrated into a geodatabase
suitable for public use. Review and editing is necessary to ensure
that the routes stored in a geodatabase are accurate and complete.
If recommended routes were submitted by multiple cyclists, a database manager
would be necessary in order to maintain data integrity, including issues
of coordinate system, datum, route completeness, and route accuracy.
A web-based map of bicycle routes used and recommended by cyclists would be an effective source of information, which could be compared with officially marked and managed routes. Each user could select the optimal route, based on individual safety and distance requirements.
Mapping hazardous locations using a GPS, and digital camera and GIS
is an effective method to clearly identify problem locations, and specific
problems associated with a location. However, the quality control problems
associated with route mapping would apply to mapping hazardous locations.
Data consistency would need to be enforced before the information is integrated
into a geodatabase. Feature attribute information would need to be
consistent with nomenclature used by urban planners and transportation
authorities.
Conclusions
The utilization of GPS and GIS for bicycle-transportation advocacy
was assessed for two applications 1) development of a user-recommended
bicycle route network, and 2) documentation of hazardous locations on a
bicycle route. Problems associated with using a GPS to map bicycle routes
were identified, and include signal loss, and track drift from the actual
route. Tracks would require editing and review before being submitted
into a geodatabase containing bicycle routes.
Hazardous locations can be clearly documented using a combination of
GPS, digital photography, and GIS mapping. Hazardous locations which
are mapped could included with a geodatabase containing bicycle routes.
The development of a user-based bicycle network could allow for numerous
related applications, specifically in conjunction with GPS and GIS technologies.
These related alternatives could include:
+ Development of consistent reporting format to communicate hazardous
locations to responsible municipal agencies;
+ Community based contribution and access to a bicycle network;
+ Collection of air quality data corresponding to cyclist exposure
levels;
+ Collection of noise pollution data corresponding to cyclist exposure
levels;
References
California Department of Transportation. July 1993. Highway Design
Manual, Chapter 1000, Bikeway Planning and Design.
The Victoria Transport Policy Institute, 2002. Pedestrian and Bicycle
Planning - A Guide to Best Practices (http://www.vtpi.org/0_nmt.htm).