|
Lily Douglas Geography 26 American River College Abstract Since its beginning in 1900, the Christmas Bird Count has provided valuable data on wintering bird populations in the United States and beyond. Variances in the data collection provide limitations that must be taken into consideration in any analysis. However, if these limitations are recognized, the data can still be entered into a GIS and used in population analyses. Introduction The National Audubon Society's annual Christmas Bird Count (CBC) has provided valuable bird population information for the past century. CBC data has been used by researchers and conservationists to study the long-term health and status of bird populations. Though a number of issues arise when evaluating the accuracy of CBC data collection, the Count still remains the longest running database in ornithology (National Audubon Society, 2003).
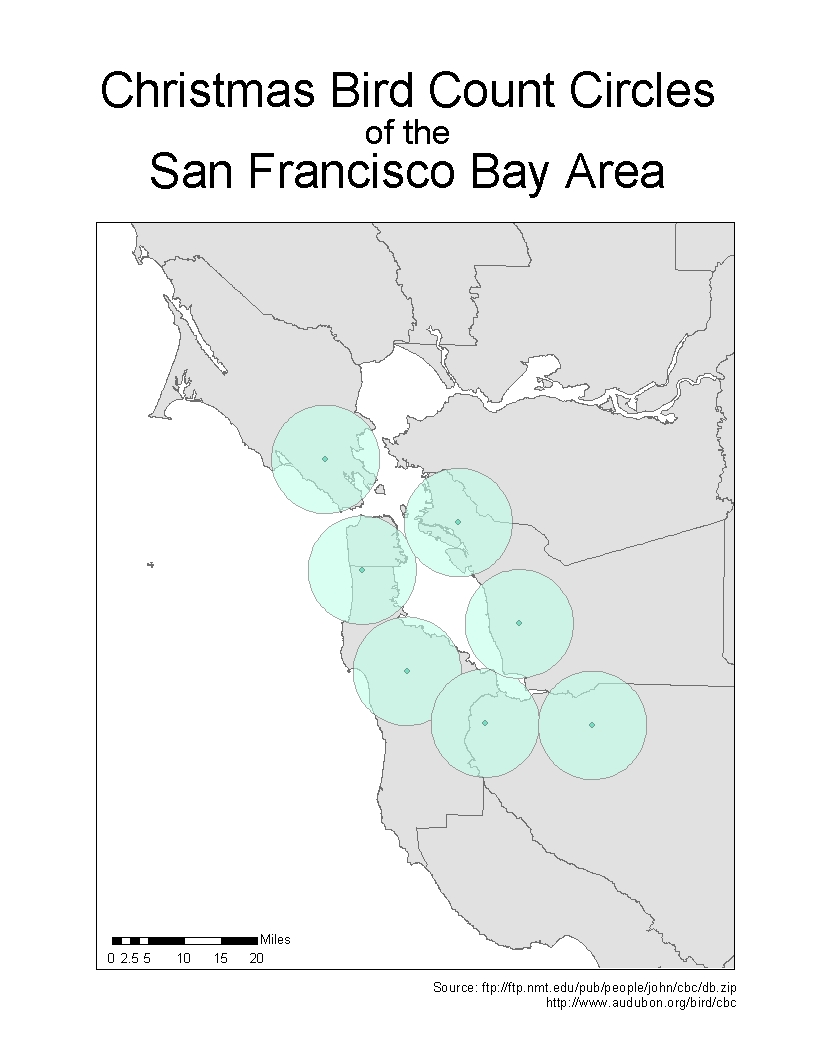
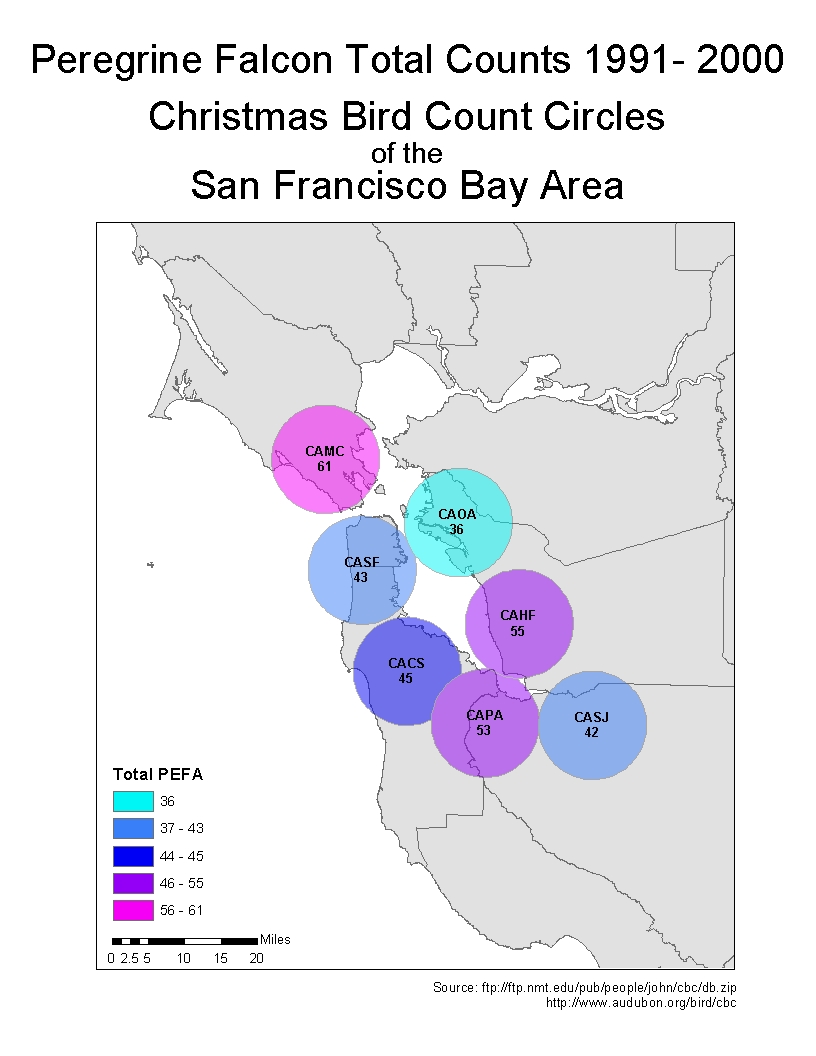
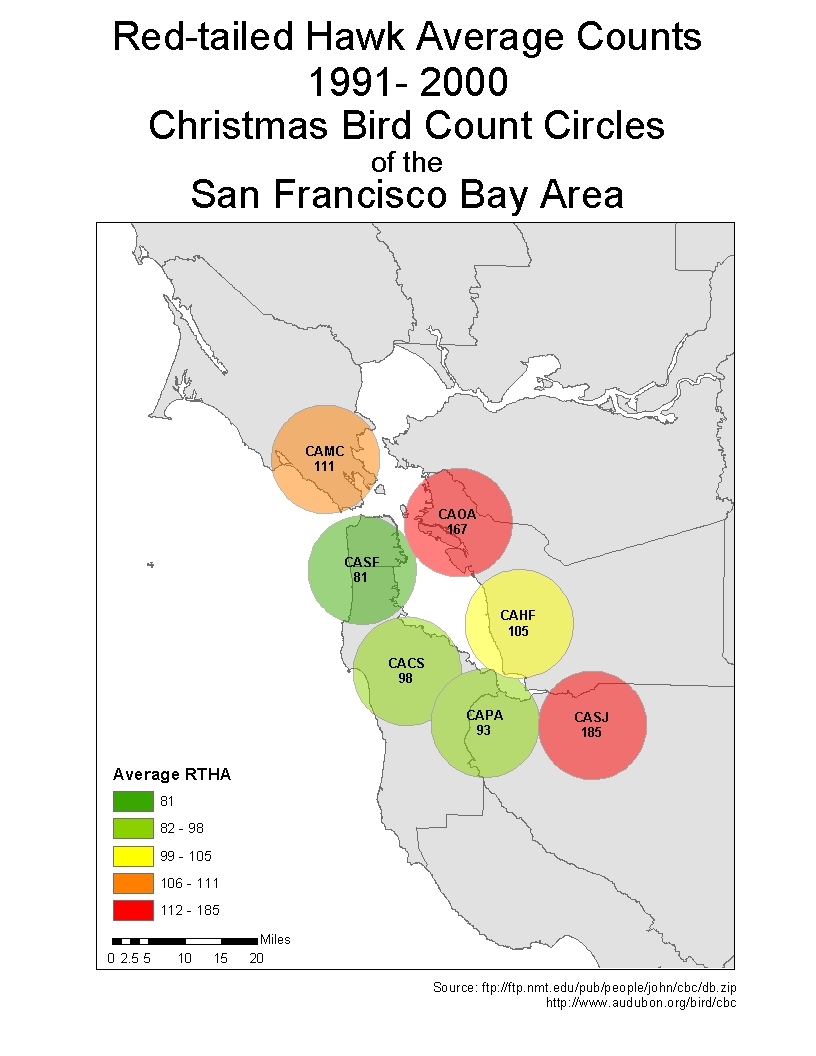
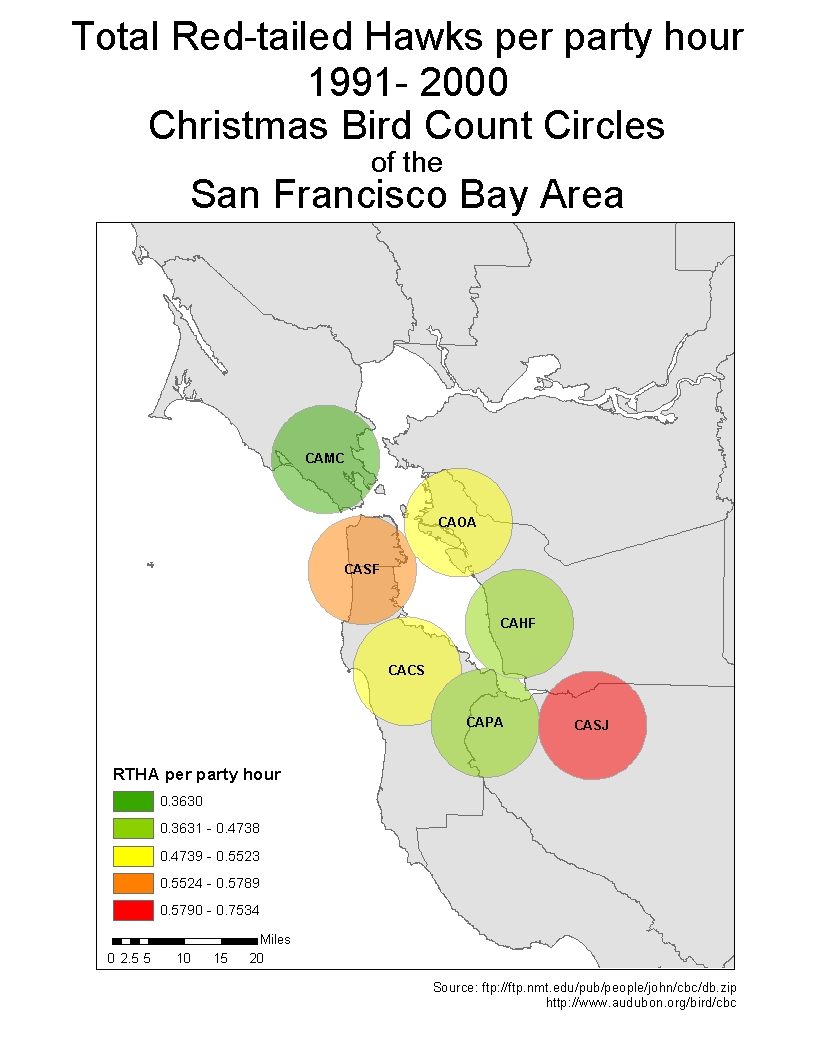
Count circles are 15 miles in diameter and each is assigned a compiler who manages the count participants and reports the data to the Audubon Society. Anybody can participate in the CBC, whether actively going out looking for birds or counting the birds that visit their backyard feeder throughout the day. Each count must be completed within the window of December 14th to January 5th of each year. Although Christmas Bird Count data is highly valuable, a number of considerations should be taken when using the data in any analysis, GIS or otherwise. Both the number of count circles and the number of participants have greatly increased since the CBC's beginnings. Additionally, more count circles occur around urban areas and fewer in more remote regions. Circles can also contain vastly different landscape, for example the San Francisco count circle contains a large amount of pelagic area. Although Audubon assures inexperienced birders that they will be partnered with "seasoned CBC veterans", not all participants are of equal skill. A number of studies have been conducted to both evaluate the credibility of CBC data as well as to develop strategies to accomodate its limitations. Sauer and Link (2002) developed statistics to be used in population change analyses using CBC data and suggested to always be sure and use analysis methods that take into account the limitations of the data. They also recommend that the CBC survey methods should be under constant revision in order to adapt to current needs. Sinclair (2001) used GIS techniques in an attempt to refine CBC data, including new data layers such as an aerial zone and printed maps to be provided to parties so they can be sure not to count outside their count circle or interior counting zone and mark their route throughout the day with relative precision. MethodsCBC data is made readily available on the web as well as in the annual publication American Birds. Additionally, maps of bird distributions and graphs of species trends over time can even be produced via BirdSource, a website designed and managed by the National Audubon Society and the Cornell Laboratory of Ornithology. Although CBC data acquisition isn't difficult, I chose to attempt to enter it into a GIS myself as the next step in data acquisition. In order to keep myself from becoming overwhelmed in this short-term project, I chose to limit both the number of count circles and bird species involved. Geographically I chose the San Francisco Bay Area since I participated in three counts myself when living there in the early 1990s. The seven counts surrounding the Bay proper are San Francisco (CASF), Crystal Springs (CACS), Palo Alto (CAPA), San Jose (CASJ), Hayward-Fremont (CAHF), Oakland (CAOA) and Marin County (southern) (CAMC). I limited species to diurnal raptors as I've always had an interest in them as a group, and I felt the number of species would fit the scope of this project. I also chose to concentrate on the ten-year period from 1991 to the year 2000.
Conclusion Christmas Bird Count data lends itself well to GIS analysis because of the spatial quality of the data. However, the limitations in the data must always be taken into consideration. As demonstrated in the two red-tailed hawk maps, results can be quite different depending on how the data is handled. As long as the quality of the data is taken into consideration by both the analyst and reviewer, the Christmas Bird Count is a valuable data source. Although the Christmas Bird Count may not be the most scientific, it is still an amazing event that brings the community together under a common interest. Audubon deems it "citizen science", anyone can be a part. I hope to continue to use this fledgling GIS in further classes in the program. ReferencesCalifornia Department of Fish and Game. Internet Map Services. 2002. Available http://imaps.dfg.ca.gov/ [2003 May 9]. Cornell Laboratory of Ornithology and National Audubon Society. BirdSource. 2002. Available http://www.birdsource.org/ [2003 May 9]. National Audubon Society. Audubon Science - Christmas Bird Count. 2003. Available http://www.audubon.org/bird/cbc/index.html [2003 May 9]. Park, Gary J. Degrees to Decimal Degrees Converter. 1998. Available http://gis.sam.usace.army.mil/support/degrees_to_decimal_degrees.htm [2003 May 9]. Klimkiewicz, Kathleen and Chandler S. Robbins. "Standard abbreviations for common names of birds". North American Bird Bander. 1978. 3:16-25. Available http://www.nmt.edu/~shipman/z/nom/bblrules.html [2003 May 9]. Sauer, John R and William A Link. "Using Christmas Bird Count Data in Analysis of Population Change". American Birds. June 2002: 10-14. Shipman, John W. The Christmas Bird Count database project. 2000. Available http://www.nmt.edu/~shipman/z/cbc/homepage.html [2003 May 9]. Sinclair, Jim. Refining the Data Collected During the Christmas Bird Count in Kingsville, Texas Utilizing GIS Techniques. 2001. Available http://users.tamuk.edu/ksjes03/CBC_Paper1.htm [2003 May 9]. |