Title
Building Terrain Models Using USGS DEMĺs
Author Information
Daniel Flanders
American River College, Geography 26: Data Acquisition in GIS; Spring 2003
Contact Information: flandoman@yahoo.com
Abstract
Digital Elevation Models (DEMĺs) are a powerful source of data in a geographic information system. This paper discusses the basic steps used to convert DEMĺs, as well as the benefits and limitations of these data sets.
Introduction
Three-dimensional terrain models are powerful tool for three reasons: First, They are visually appealing. Second, they offer a new perspective to data, and third, terrain models allow us to identify trends and patterns that are not readily apparent in traditional two-dimensional maps.
Common uses of terrain models include: Emergency and disaster preparedness and response, public safety and police operations, environmental impact studies, transportation planning, and telecommunications [view shed/ line-of-site] (Krysia,2003). One such model, the Digital Elevation Model (DEM) is particularly useful because it is widely available on the internet, it is easily converted to 3D, easy to integrate with USGS topographic maps, available for most areas within the U.S., comes in a variety of commonly used scales, can be used to create contours, slopes, aspects and hill shading. Most important, DEMĺs are available for FREE or at minimal cost. One major drawback in using this data is that few people know how to convert and display DEM data. As a result, I will cover the basic steps to acquire and display DEM data and discuss some of the pros and cons of DEMĺs.
Methods
Process Overview:
1. Download the data (DRG and DEM).
2. Unzip the data files
3. Convert the SDTS DEM into a GRID theme.
4. Georeference the DRG to the GRID (in ArcView/ArcMap)
5. Assign base heights of the DEM to the DRG and extrude (in ArcScene)*
6. Create contours, slope, and aspect GRID files (in ArcMap)*
*Must have 3d Analyst or Spatial Analysis extension license.
The first thing I did was to search of the World Wide Web (Google) for references to digital elevation models and Northern California GIS data. I was able to download the SDTS (Spatial Data Transfer Standard) compressed file of the Sacramento East 7.5ĺ 10m resolution DEM and the corresponding 1:24000 scale topographic map (Digital Raster Graphic or DRG) from the GIS Data Depot. Next, I uncompressed the both files and converted the DEM from SDTS to the ArcInfo GRID (raster) format using the sdts2dem converter. Afterwards, I opened both files in ArcMap, and georeferenced the topographic map to the GRID. Then, I opened both files in ArcScene and extruded the topographic map using the base heights from the GRID. I modified the properties setting to increase the amount of vertical exaggeration, gave the GRID smoother shading, and higher resolution. Last, I used the Spatial Analyst and 3D Analyst extensions to create contours, slopes, aspects and hill shades.
Results/Analysis
Although DEMĺs are available from a number of sites, I encountered a number of unforeseen problems. Some of the problems I encountered included: Non-graphical user interfaces, gaps in coverage areas, non-existent metadata, and intentionally slow download speeds. Of these problems, the two that presented the most difficulty were the non-graphical interfaces and the gaps in coverage. Some sites had graphical interfaces that allow the user to select the state or county and search by quadrangle name. This proved to be a convenient feature. Although there were proportionally more areas where there was no coverage available-- when compared to other non-graphical sites-- I was able to find the name and alphanumeric code for the quadrangle, and then go to another non-graphical site to download.
DEMĺs are an invaluable source of data, however, they are not without problems. First, it can be time consuming to find a specific DEM. Second, even in a compressed format; the files are large and slow to download. As an aside, some sites intentionally decrease the download speed unless you pay for the data. I encountered downloads of 4.8 kbs on a T1 line! (This is equivalent to downloading the file from a standard dial up account with a 56k modem) In addition, the large file size limits the number of DEMĺs that can be displayed at one time. Third, gaps and overlaps in coverage areas, poorly referenced DEMĺs as well as other quality issues can be frustrating, and require further processing to rectify. Fourth, The DEMĺs must be converted from their native format into a format that can be used by ArcGIS. This is not really an issue if when dealing with a relatively small number of files, however, it is a factor for larger projects. Last, DEMĺs have a low raster resolution that varies between 10 and 30 meters (approximately 32.5ĺ and 97.5ĺ cell size). This is fine for most areas and at most scales; however, a lot of information is lost at large scales or in areas of high relief. Even given these limitations the benefits of wide availability, easy conversion and integration, large coverage areas, common scales, functionality, and cost surely outweigh these minor drawbacks.
Figures and maps
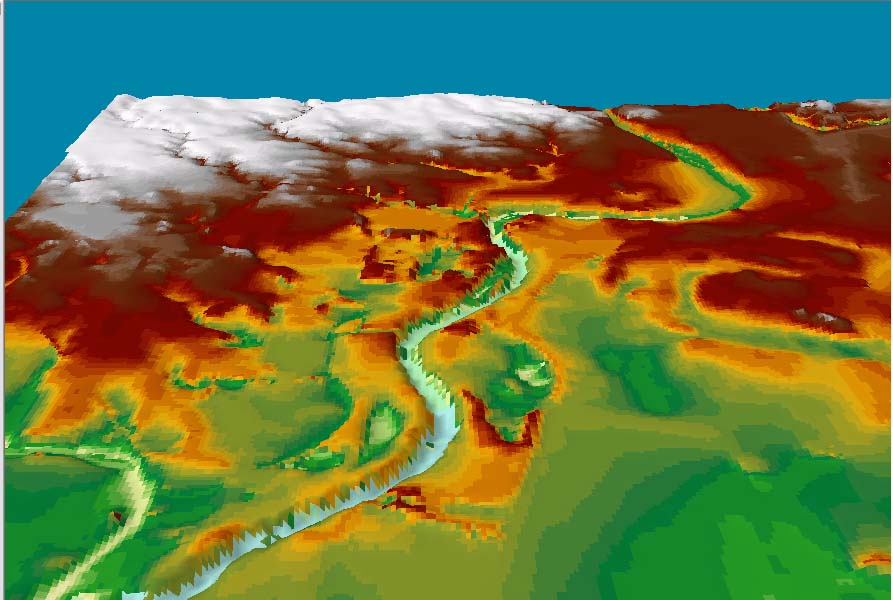
Sacramento East DEM with 10x Vertical Exageration
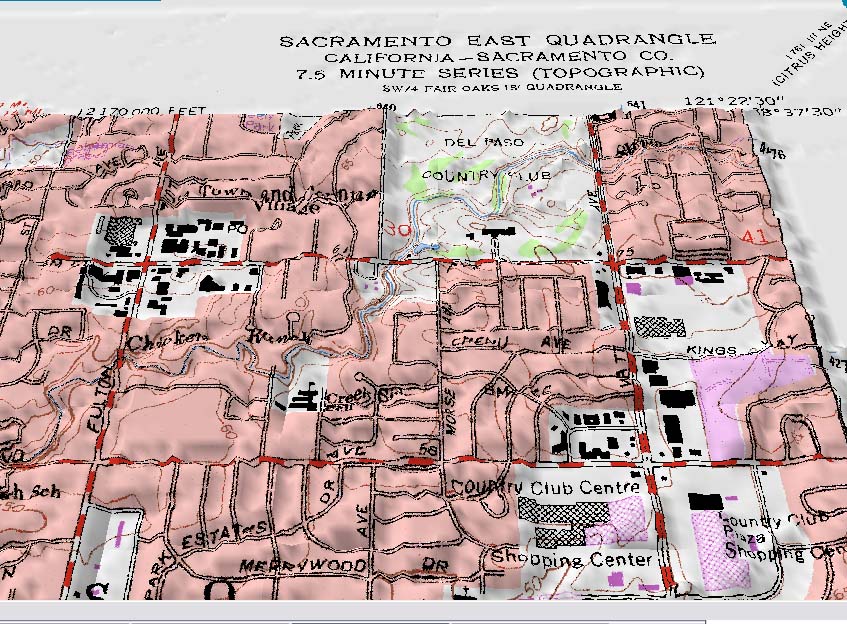
USGS Topo-Quad Extruded Using Base Heights From DEM
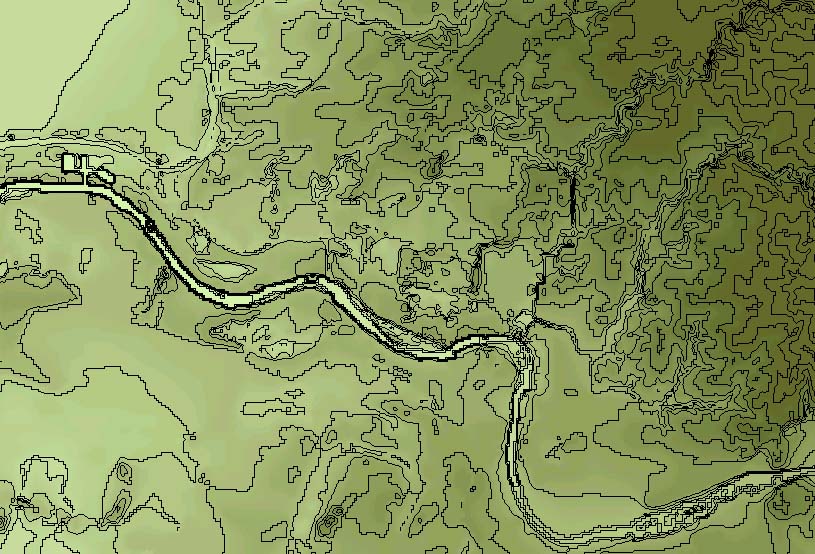
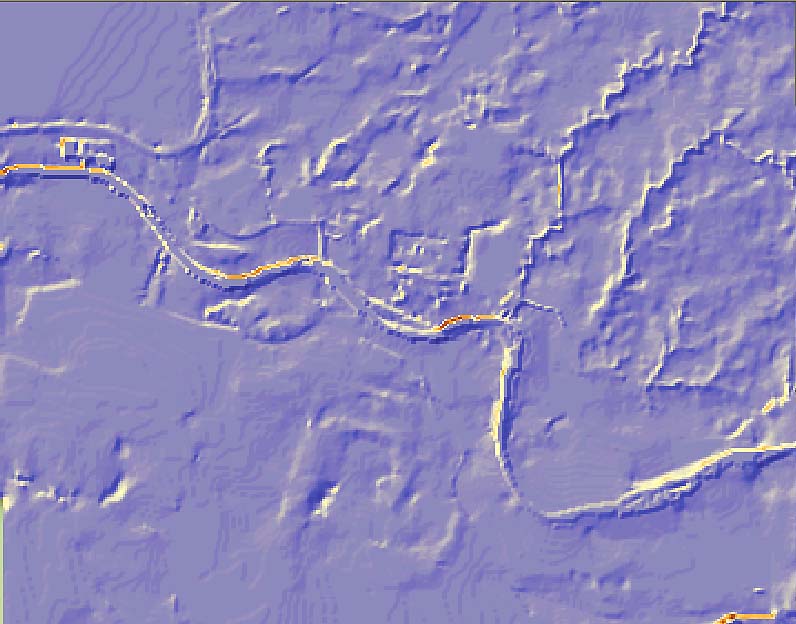
Slope Derived From DEM (darker lines indicate steeper slopes)
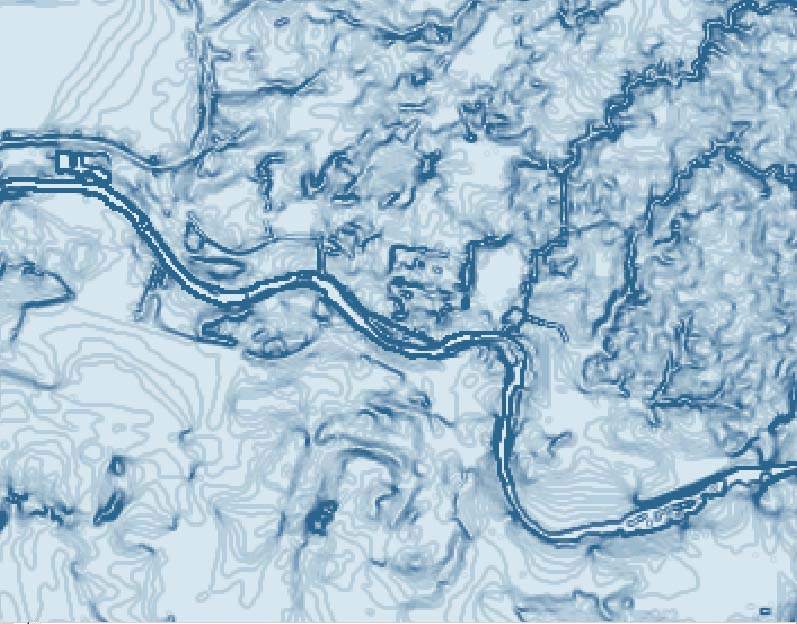
Contours Derived From DEM (contours appear broken, but are in fact continuous.)
Hillshade Derived From DEM (post processed in Adobe Photoshop7)
Conclusion
USGS DEMĺs are a powerful source of data that has many uses within a GIS. As terrain modeling becomes more and more important for industry, security, environmental regulation and planning, there needs to be some sort of data to fill the high accuracy, high resolution requirements. Currently, another technology, LIDAR (Light Detection And Ranging) satisfies these needs, but coverage is limited because of the prohibitive cost and size of the data sets. Another up and coming source of high quality data is NASA. The Shuttle Radar Topography missions are another source of high-quality data. However, it encounters many of the same difficulties as the USGS DEMĺs namely a relatively large raster cell size. Until something better comes a long, USGS DEMĺs remain an excellent resource.
References
Krysia. ôThe Power of Three-Dimensional Dataö PE&RS
February 2003, 115.
Price, Mike. ô3D Geologic Modeling in ArcScene.ö ArcUser.
October-December 2001, 46-49.
Price, Mike ôUsing the ArcScene Fly Tool.ö ArcUser.
October-December 2001, 50.
Price, Mike. ôRegistering Images in ArcGIS.ö ArcUser.
January-March 2002, 48-51.
Shephard, Nathan. ôAnimation in ArcScene.ö ArcUser.
February-March 2003, 8-10.
Zimmer, RJ. In Line with GIS: DEMs
Source: http://www.profsurv.com/ps_scripts/article.idc?id=715
Accessed: 2003.05.10
Other Links
SDTS Home Page http://mcmcweb.er.usgs.gov/sdts/
What is SDTS? http://mcmcweb.er.usgs.gov/sdts/whatsdts.html
USGS SDTS 7.5' DEMs available online http://mcmcweb.er.usgs.gov/sdts/hosts.html
SDTS search by coordinates http://www.atdi-us.com/
Public Domain software for SDTS http://mcmcweb.er.usgs.gov/sdts/public_domain.html
Translator for SDTS DEM Files http://www.cs.arizona.edu/topovista/sdts2dem/
Free evaluation version of WinZip http://www.winzip.com/ddchomea.htm
Colin Brooksĺ ôGIS data links for northern California and other useful GIS-related linksö http://www.pacificsites.com/~cbrooks/gis1.shtml