Title
Determining The Most Suitable Elementary School For My God-Child |
|
Author
Janet Ochikubo
American River College,
Geography 26: Data Acquisition in GIS; Spring 2003
Contact Information
(Address, phone, email: Optional) |
|
Abstract
A geographical information system
was used in selecting the most qualified school for my God-Child. The
system displayed the caliber of academics each school provided, the proximity of
the schools to my God-Child's residence and the in class ratio of teacher to
students for each school. In addition, it demonstrated that although Gates
Elementary School was not the closest school, it did remain within the 10-mile
buffer boundaries, had the highest quality of education and the best teacher to
students ratio. Therefore,with the help of the geographical information system
and some analysis, I was able to determine that Gates Elementary School was the
most suitable school for my God-Child and that it may be possible to use a
Geographical information system to solve almost any predicament.
|
|
Introduction
Parents of all ethnicities
and background one day prepare to face the problem of where to send their
children to elementary school. Elementary school is the first step in
preparing the child for a University education. Therefore, it is important
that the most suitable school is chosen. However, with numerous schools to
decide from, selecting a school can be quite difficult. I am in this particular
situation. I do not have children of my own, however, I do have a God-Child
preparing to enter elementary school. As a result, to ensure that my God-Child
attends the most suitable Elementary School as possible, I will utilize a
Geographic Information System to help relieve some of the difficulty in selecting
a school. The following requirements, quality of education, proximity, and
teacher to student ratio, make the school a potential for candidacy.
Consequently,I will rank the schools according to standardized test scores
and label the ranked scores on a map. Then I will add a buffer to the map so
that only neighboring schools to my God-Child's residence will be considered.
In addition, I will group the schools according to their teacher to student
ratio and label them on the existing map. Finally, I will analyze the
map to determine which of the schools are the most qualified. In the end, I hope
that the Geographic Information System can be instumental in selecting a
suitable elementary School for my God-Child.
|
|
Background
The most important factor in
determining which Elementary School my God-Child will attend is the caliber of
education my he is receiving . Because I think it is most important for My
God-Child to graduate from a University and usually if the children perform
well on the California Standards Test, that indicates they are
receiving a quality education and will eventually graduate from college.
In addition,if my God-Child is surrounded by children
who perform well in school and on the test, I believe he is more likely to
duplicate this behavior. Therefore, I have collected the California Standards
test scores of every Elementary School in the Roseville
Unified School District from the website http://www.greatschools.net/modperl/
browse_district/506/ca and ranked
the school according to their student's performance. I chose the Roseville Unified
School District because that is the district he belongs to. Using a gps unit,
I then created a point map of the schools and his residence and
attached to the school points, a number, representing the level of the student's
academic performance on the California Standards Test. This
map shows the schools with the best academic performance.
The second factor is the proximity of the elementary school to my God-Child's
Roseville residence. His parents are full-time employees, therefore, the school
must not be located more than 10miles from their 3316 Mammmoth Drive residence
in Roseville. As a result, I will create a map using a 10-Mile buffer from the
residence. My intention is to create a map that will clearly show the schools
that come within a 10 mile radius of the house.
The third factor in determining a suitable elementary school for my God-Child
will be an assessment of the teacher to student ratio that I was able to aquire
from http://www.greatschools.net/cgi-bin/ca/other/4141#teachers. The smaller
the ratio the more attention I believe he will receive from the teacher
and therefore the better the education he will receive. I will add to the
existing map the ratio rankings. Hence, I will have produced a map
that will clearly indicate the most suitable schools for my God-Child
and all I will be left with to accomplish is to analyze the final map. |
| Waypoint# |
School Name |
English |
Math |
Test Rank |
Ratio |
| 1 |
Cresmont
|
57%
|
63%
|
3
|
1:20
|
| 2 |
Sargeant
|
59%
|
54%
|
5
|
1:19
|
| 3 |
Sierra Gardens
|
39%
|
33%
|
8
|
1:20
|
| 4 |
Cirby
|
34%
|
31%
|
11
|
1:18
|
| 5 |
Kaseberg
|
36%
|
32%
|
9
|
1:19
|
| 6 |
Woodbridge
|
31%
|
35%
|
10
|
1:18
|
| 7 |
Spanger
|
52%
|
43%
|
7
|
1:19
|
| 8 |
Diamond Creek
|
56%
|
53%
|
6
|
No Data
|
| 9 |
Brown
|
62%
|
63%
|
2
|
1:19
|
| 10 |
Gates
|
69%
|
76%
|
1
|
1:17
|
| 11 |
Stoneridge
|
50%
|
56%
|
4
|
No Data
|
This is a table showing the data which includes
the California Standard Test Scores and Ratio.
|
|
|
|
Methods
In creating the map of each
Elementary Schools academic performance. I first acquired the gps points
of every school in the Roseville Unified School District and my God-Child's
residence. I had to set my Garmin to NAD 83 with a UTM projection. Then
I took waypoints with the Garmin by pushing down the mark button and
pressing enter. I then used waypoints plus to create a comma delimited
file. To do this , I hooked up the Garmin to the computer then downloaded
the gps points on to Waypoints Plus. I then plotted the waypoints by
selecting Plot Waypoints and saved the waypoints as a comma
delimited text file. My next step was ranking the schools according to
their students academic performance from one to ten. I gave the schools with the
highest percentage the lowest numbers then gave accordingly,the schools with
the lowest percentage the highest numbers. I added an academic performance
field and a schools name field to the comma delimited text file and populated
the column with my
rankings. Finally, I opened ArcMap and went to the tools menu and selected
add x,y coordinates. I then went to the table of contents and highlightted the
school theme, right-clicked, selected properties, selected the
labels menu and selected expression. Inside the window I typed (School
Name) & vbNewLine & (Academic Performance). All the windows were closed.
Right clicking once again on the schools theme I selected label features
from the context menu. Displayed on the screen were points representing
schools, with their school name and academic performance score associated
with it. Determining which schools were in the vicinity of my God-Child's
residence was my next step. To accomplish this, I buffered a
distance of 10 miles from the residence using the Buffer Wizard. The
result was a 10-Mile buffer surrounding my God-Child's home. My third
step was adding the ratio, teacher to students. I created five categories.
The first was very good, the second was good, the third was average,
the fourth was average and the fifth was No Data. If the data had a
ratio of 1 to 17, I gave it a very good. If the data had a ratio of
1 to 18, I gave it a good. If the data had a ratio of 1 to 19, I gave
it an average. If the data had a ratio of 1 to 20, I gave it a below
average. And finally if the data was not available, I gave it a No Data.
I then added a field called Ratio to the comma delimited text file and
populated the column. I right clicked on my schoool theme, highlighted
properties and selected the label menu. Again I clicked on expressions
and added & vbNewLine & (Ratio). Closed all the windows
and right clicked on schools then selected label features. Displayed on
the screen was a map showing the levels of teacher to students ratio,
a number for academic performance, school name, and a 10-mile buffer.
I added the USGS topoquad tiffs as background to show the schools and
residence relative to geographic features.
My final product was a map that took into account the student's
academic performance, location of school relative to my God-Child's home,
and teacher to students ratio.
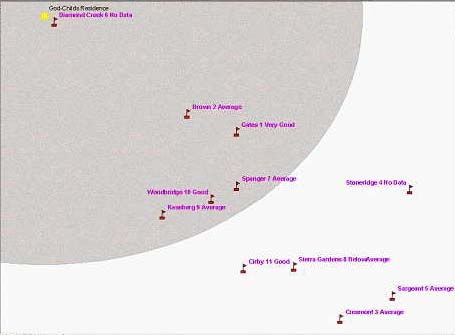
|
| This is a map showing my God-Child's residence,
the locations of all the schools, their names, the ranked California Test
Scores, the 10-Mile buffer, and the teacher to students ratio.
|
|
|
Results In the end, ranking the schools based
on thir academic performance resulted in Gates Elementary being the school
with the highest quality of education,including a score of one, followed by
Brown with two, Cresmont
with three, Stoneridge with four, Sargeant with five, and Diamond Creek
with six. I felt that if the ranked score was higher than six, I seriously
wouldn't consider those schools. But I left the other schools in the map
just to see how they would compare when the other factors were applied.
Then when I used a 10-mile buffer to view all the schools that were in
close proximity to my God-Child's reseidence, I found that , Diamond Creek,
was the closest followwed by , Brown, Gates, Spanger, Woodbridge and
Kaseberg. These schools were contained inside the buffer. Finally, I
rated the schools according to the teacher to students ratio. The end
result was that Diamond Creek and Stoneridge had no data. Therefore, I
didn't consider these two schools at all. Sierra Gardens was below average
so that was tossed out of the running. Crestmont, Sargeant, Spanger,
Brown, and Kaseberg were average. Woodbridge and Cirby are good and only
Gates was very good. Therefore, Gates had the best teacher to students
ratio.
|
|
|
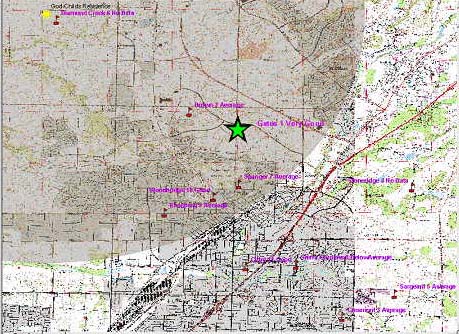
|
Map This is my final Map that represents
Gates Elementary School as the star, indicating it is the most suitable
Elementary School for my God-Child.
|
|
|
|
Analysis Although, I originally wanted
academics to be the most important factor,
my God-Childs parent's informed me that proximity must be the most
important factor because there was no practical way that they could
transport their child to a school that was more than 10 miles away. So,
first I eliminated all the schools outside of the buffer. That left me
with Diamond Creek, Brown, Gates, Spanger, Woodbridge, and Kaseberg. Then
out of these six schools Gates and Brown were the two best schools
respectively, according to academics and of these two schools Gates also
had a better ratio 1 to 17 compared to Brown's 1 to 19. Brown is also
closer. However, Gates had two factors that were better than Brown.
In addition, Gates was inside the buffer boundary. As a result, Gates
was determined to be the most suitable school for my God-Child.
|
|
Conclusions
By resolving the predicament of which school
my God-Child should attend, I've demonstrated that a Geographical
Information System could be used in selecting a school for any child or
loved one and that it could be used to resolve almost any situation.
In addition, I believe that this Geographical Information System was
instrumental in helping me determine the most suitable school for my
God-Child.
|
|
References
California Department of
Education. (2001-2002) Roseville City Elementary Schools
Source: http//www.greatschools.net/modperl/browse_district/506/ca
California Department of Education. (2001-2002) School Information
Source : http://www.greatschools.net/cgi_bin/ca/other/4141#teachers
California Department of Education. (2001-2002) School Information
Source: http://www.greatschools.net/cgi-bin/ca/ach_more/4141
|
|
|