| Title UTILIZING GPS/GIS FOR City of Fairfield STREET SIGN ENVENTORY | |
|
Author Jaime Sabile American River College, Geography 26: Data Acquisition in GIS; Spring 2003 | |
|
Abstract Local government has the responsibility of maintaining the structural integrity of city streets and to insure that it is safe for the public who must use it on a daily basis. Traffic safety issues are accomplished through the use of various traffic devices placed on, near, or next to the traveled roadway. Combined with police enforcement, though not perfect, it is an effective safety system. The primary goal of traffic devices is to alert motorist and pedestrians alike of traffic regulations and street configurations that affect everyone’s safety. When a traffic accident occurs on the roadway and the involved parties end up in litigation, a local agency at times has become a party in the suit. So, in order to protect itself from liability, the city I work for incorporated a sign inventory with maintenance history that can be provided to the courts if required. | |
|
Introduction The City of Fairfield with a population of approx. 100,000 is located in the heart of Solano County. It is 37 miles west of Sacramento and 42 miles east of San Francisco. Interstate 80 freeway, which connects the two major metropolitan cities, runs thru the middle of Fairfield. The city currently has 37.5 miles of arterial streets, 75.5 miles of collector streets and 126.5 miles of residential streets. Employed by the City of Fairfield, I currently work in the Transportation Division under Public Works Department. The division is responsible for tracking traffic devices that are scattered throughout the city. It is in our office that “work-order” for an installation of traffic devices are generated, a request that usually comes from the Traffic Engineer. It is then routed to our corporation yard office where sign crews are dispatched to install them. From the time the work-order is generated up to the time that the sign is installed, it is tracked through a unique identifying number. Once the traffic sign is installed, the crew signs and dates the work order and routes it back to our office. The work order is then put into a binder and becomes public record. A history is then generated on that sign every time the sign crew performs maintenance on it. There are two classes of traffic control devices, electrical and non-electrical, and all have to be maintained by the Public Works Department. Of the two, non-electrical devices such as posted signs and pavement markings are the most common and require more manpower and man-hours to maintain. Posted signs must be periodically cleaned, reset, and replaced and pavement markings are periodically repainted as it wears out. When a traffic accident occurs on the roadway and ends up in litigation, the courts may request the maintenance records of these traffic devices. The city must then prove to the court that the traffic devices in place at the time of the accident, was in good condition and was not a contributing factor to that accident. It’s easy to see that a well managed inventory system and good maintenance records are essential to limiting the liability of any local government. The purpose of this project is to learn how GPS and GIS can be utilized to replace the existing and obsolete street sign inventory in Fairfield. By capturing coordinate information of specific posted signs using GPS in the field, I plan to convert the coordinate information into point features that can be projected and saved as a shape-file. Finally, layer these points using GIS on top of aerials with street curb edges. | |
|
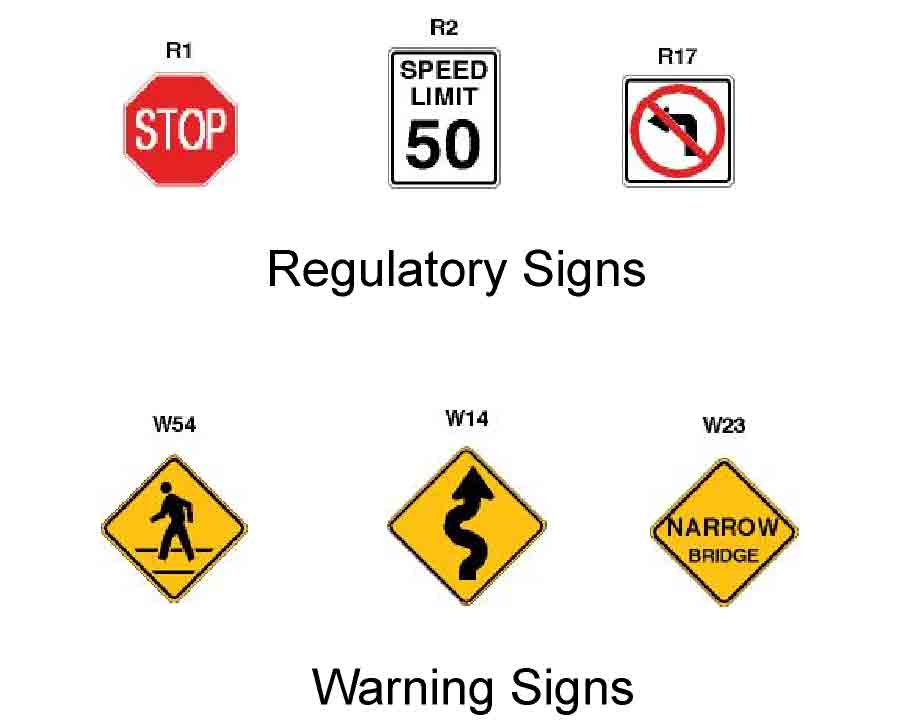
Background Back in the mid-seventies, there was an alarming trend of traffic related court cases throughout the state of California involving local governments. Although the City of Fairfield were never involved in a lawsuit, this statistical information prompted the management to implement a sign inventory system that would help protect itself from such liability. Along with the inventory, they wanted to include the most important information of all, records of maintenance history that can be generated at any time it is needed. To build this database, the city had to decide what traffic devices warranted inventory and what kind of information it needed to keep on those devices. Typical traffic devices found in the field are traffic signals, pavement makings and posted signs. Posted signs were categorized into Regulatory, Warning, and Guides. Regulatory signs are those | |
| posted to limit what a motorist can and cannot do in the interest of safety. Examples are Stop signs, Speed Limit signs, and No left Turn signs. Warning signs are intended to educate and caution the motorist of impending conditions on the road ahead, which could be a safety hazard if the motorist is not made aware of it. Examples are Pedestrian Crossing sign, Curve Ahead sign, and Narrow Bridge Ahead signs. |
 |
The first step the city took was to gather traffic accident data that would show specific patterns. Next, they had to
decide which signs should be
inventoried first. After studying the accident data that spanned five-year period, it became apparent to them that the
number one traffic device, which needed to be inventoried and maintained, are Stop Signs. The data clearly showed that traffic collisions on intersections controlled
by Stop signs were reflecting more major injury to the occupants of the vehicles involved. The reason for this is
that vehicles are converging at right angles as they approach the intersection. The driver is specifically vulnerable
if it is broad sided by another vehicle at the driver’s door. The study showed that broadside collisions accounted for
more injury and fatality when compared to other traffic related accidents. It made sense that Stop signs should the
first signs to be inventoried because they are specifically installed in an intersection to control and assign right
of way for all motorist and pedestrians.
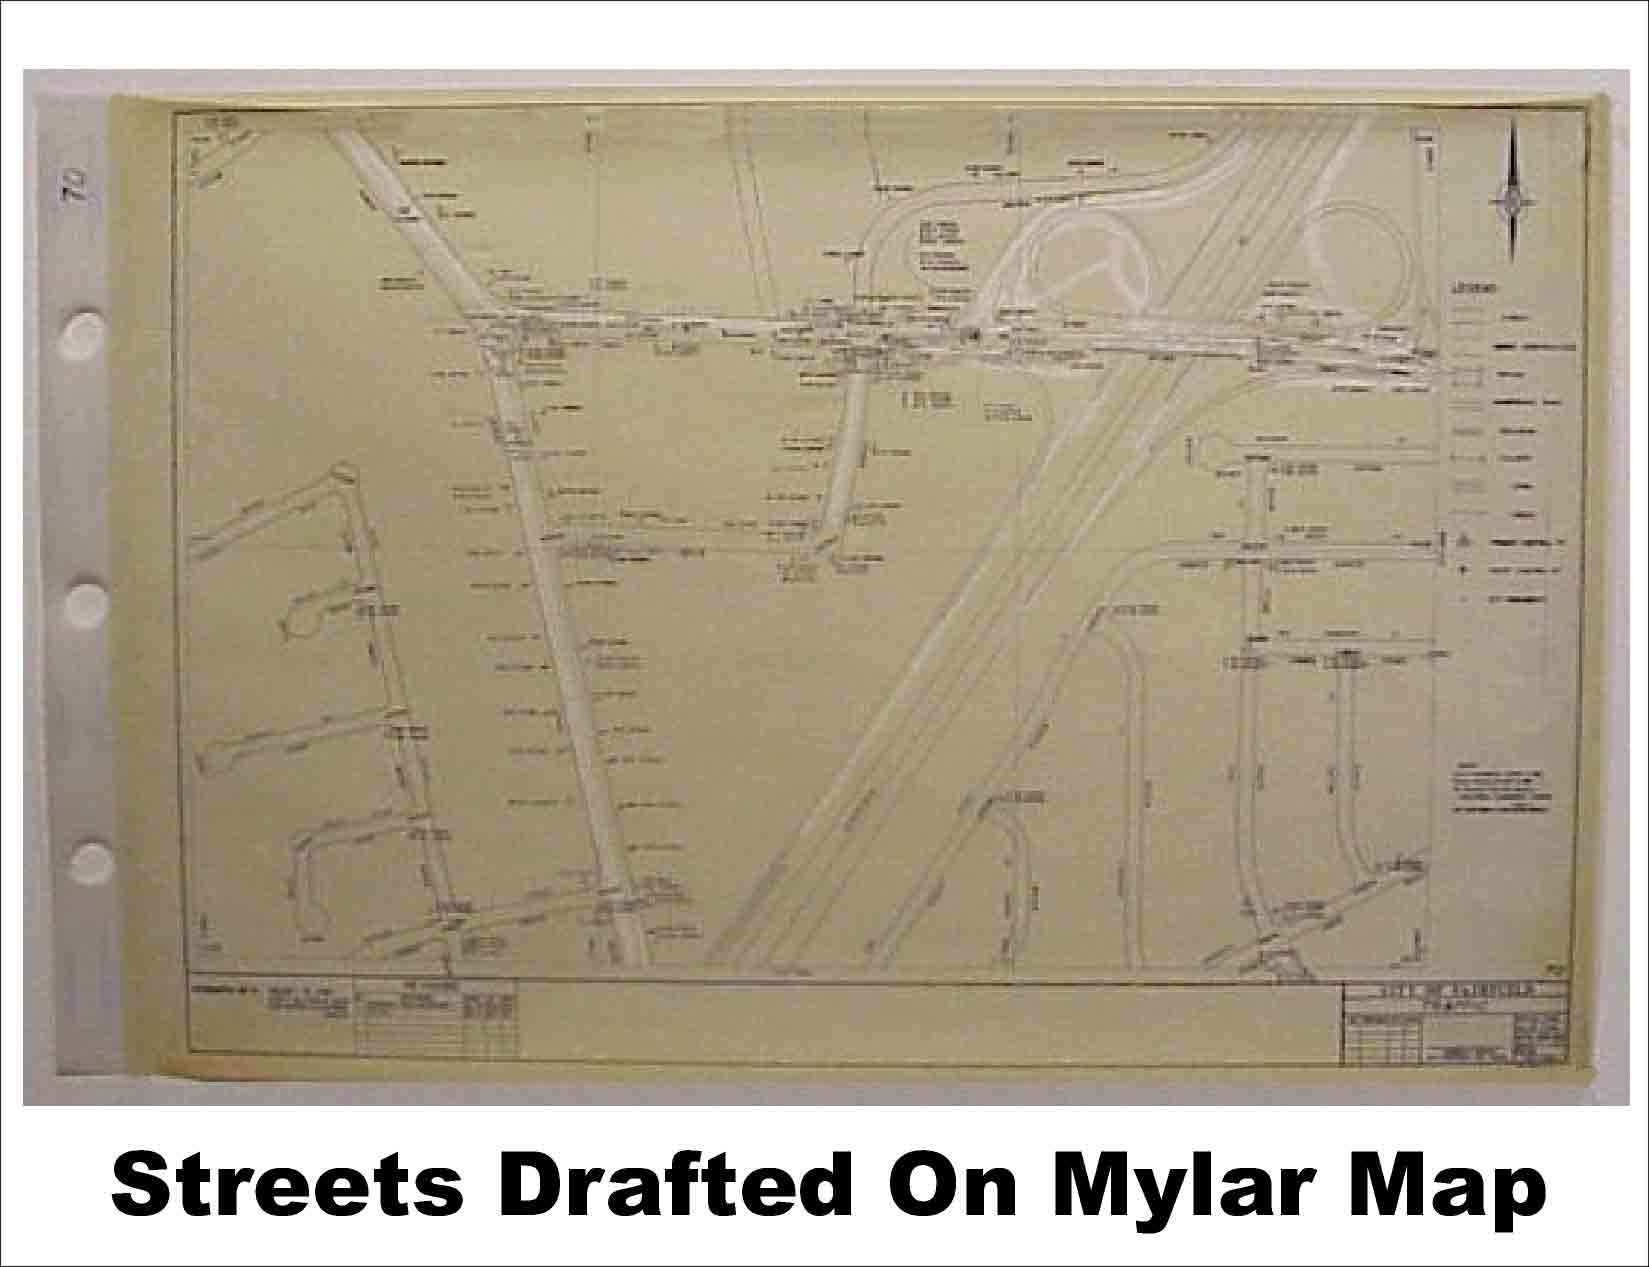
At the time I was hired by the city, it had in place a sign inventory program, which was all done by hand. Since the city was relatively small in size, one person was able to gather the data and drafted the symbol for each of the sign inventoried with pen and ink on mylar sheets. Work-orders were kept in binders and indexed by unique numbers sequentially, which was tagged to the paperwork when it first went out from the Traffic Section.Drafting the signs on the mylar is fairly easy since the street maps were broken into panels and drawn at 1” = 100’. By using an engineering scale, the |
| staff can draw the symbol where they need to be on the map. Of course one would have to take a measuring wheel out in the field and determine the distance of the sign relative to a fixed point, typically a point known as curve-returns. Curve-returns are points where a radius curve at one corner of an intersection is tangent to the straight face of curb line of the roadway. |
 |
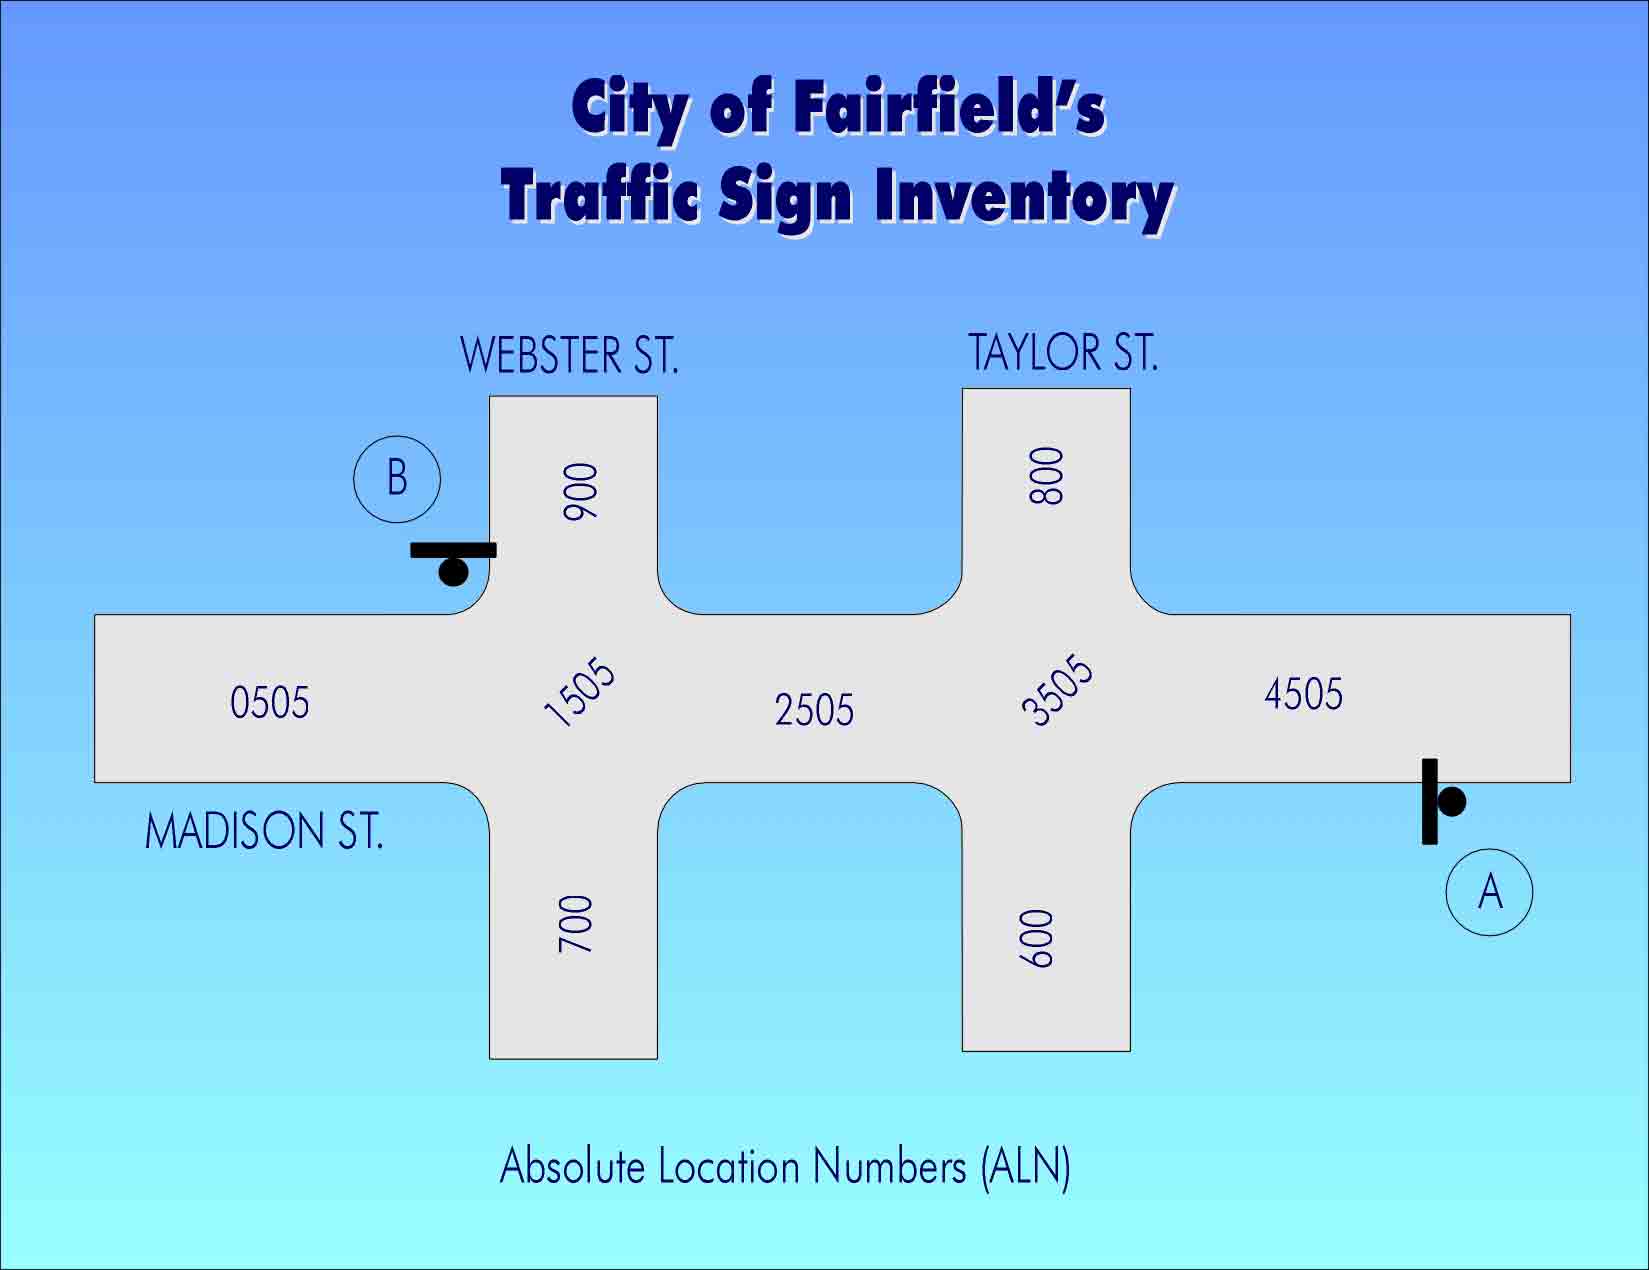
| Since streets have segments and intersections and can stretch for miles,they had to come up with a way to locate these signs within that street.With a few days of brainstorming, the staff came up with “Absolute Location Numbers” system or ALN numbers. Basically, a stretch of street will have an ALN numbers where it begins, an ALN number assigned to the first intersection, another ALN on the following segment,and so on until it ends. The longer the street, the more ALN numbers are assigned to that street. Signs were tied to only one ALN number. The problem is, there was no rhyme or reason on how these ALN numbers were determined. It seemed that the staff just pulled a series of five numbers arbitrarily out of thin air. | |
| When the use of computers at the office became the norm and software such as Dbase and FoxPro were being offered,the city took the steps to convert the available data into electronic forms. The city gave the task to one of its programmers and he developed a database in FoxPro which incorporated sign ID numbers, sign type, location in relation to an ALN number of a |
| street, and maintenance history. In terms of how the program looked, it was very
pleasing to the eye. But when it came to functionality, it had a lot of problems. Every time a problem is brought to
the programmer’s attention and he fixed it, another problem took its place. Sometimes it took months to fix it and
it took another month to discover that something else was not working properly. The program never fully functioned
properly. Eventually, the programmer took another job and no one was assigned to fix the program. The database sat
unusable. With the economy not doing well for many years and the revenue to fund new positions are slowly dwindling,
the traffic sign inventory has stalled.
A few years ago, there were talk about implementing GIS in the city but budget concerns and staffing issues became an
obstacle to getting it started.
Although the plan originated from our Engineering Division with the goal of using the system to map out underground utilities, I saw that GIS can be a great tool to help the city in other ways. For starter, I thought about reviving the sign inventory. My plan is to convince the decision makers at city hall that we badly need GIS and that they should look at the bigger picture and invest the time and resources to implement it. I think part of the problem is that they have just a vague idea of what GIS can do. I believe in this system so much that I began studying whole heartily what it can do, including enrolling in these classes so I can get a certification on it. |
|
Methods I began the project with preplanning. I knew I wanted to inventory Stop signs but toyed with the idea of adding other items such as traffic signal, streetlights and fire hydrants. Then I had to decide on the boundary of the project, and where I should start. Finally, how and what I needed to process the information so that it can be projected in GIS and displayed. Time constraint narrowed my choice to collecting only data of Stop signs in the area around City Hall. The area was chosen because it is a prominent feature when viewed from an aerial photograph (since it took up a whole block) and can easily be identified by the management. I figured this would make selling the idea of reviving the GIS program a lot more attractive to management. The study area would include one block north of and one block south of City Hall. To process my data, I contacted ESRI, creator of Arc View 8, and took advantage of their GIS student purchase program. I learned about this program through the college staff a few months before, which basically allowed me to purchase the GIS software at considerable savings and use it for this and future projects. Also, this would enable me to work on my project at home instead of traveling all the way to Sacramento to use the lab computers. | |
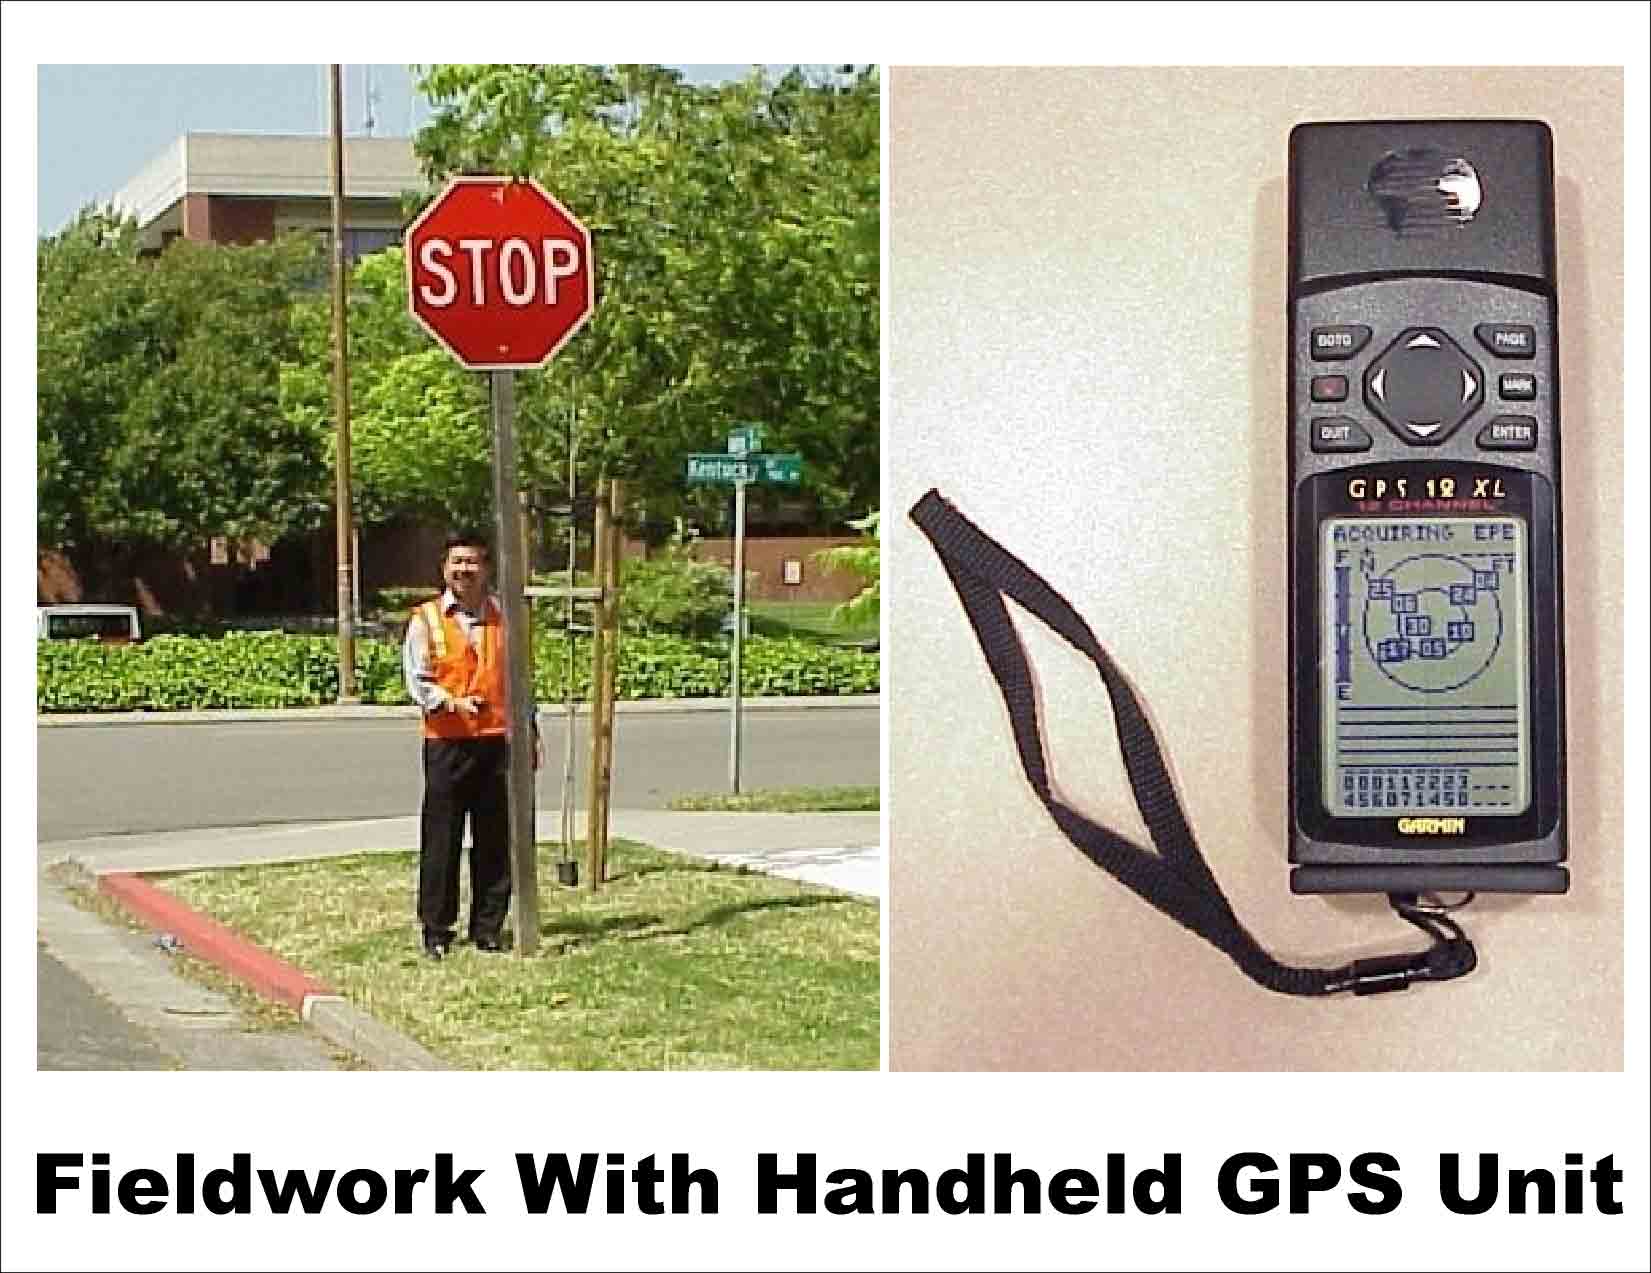
So, while I was waiting for the shipment of the software, I went out in the field and gathered my data using the GPS handheld unit known as Garmin 12XL. This unit was a loaner from the college. At the same time, I also researched how I can get the other data needed for this project. Historically, the Engineering Division has provided us city streets |
| data in CAD forms along with aerial panels but I had no idea if these were drawn in a
format that can be layered in GIS. When the ESRI product finally arrived, I was excited and eagerly started on my project.
The box was opened, CD removed from packaging and loaded on to the CD ROM reader. My excitement turned to disappointment
and despair when an error message on the computer screen stated that this program failed to load because I needed Windows
2000 to run it. The sales representative at ESRI forgot to mention to me that this software was written for Windows 2000
and it will not run on any other operating systems. My computer is still running Windows 98 second edition and it was
evident to me that this software is useless unless I upgrade to Windows 2000. Financially strapped, there was no way I
could do the upgrade by the time this project was due. After frantically making enter-office phone calls, I was surprised
and delighted to learn that the city had a copy of GeoMedia Professional software laying around in Engineering. No one had
taken the time to learn and use this program since the city did not have GIS. GeoMedia Professional, which is made by
Intergraph Corp. in Huntsville, Alabama, is a GIS software package that rivals ESRI’s ArcInfo. Although it has only about
20% registered user nationwide compared to ESRI’s 80%, it turns out to be a powerful GIS product and mirrors what ArcInfo
can do. Because Engineering and Transportation uses MicroStation J as a CAD program, it had acquired the program a few
years before from Intergraph Corp. as companion software. With this, I was able to proceed with completing this project.
The other issue that I had to work around was the conversion of Garmin’s handheld waypoints data acquired earlier. I still needed ArcView 3 and the use of Waypoint plug-in software (available for download through the internet), which allows for the downloading of coordinate data stored in Garmin’s GPS unit. The way I solved this problem was just plain luck and determination. A few years earier, a sales representative from Haselbach Surveying Instruments Inc. came to our Engineering division and introduced a survey grade GPS unit made by Leica Geosytems. In his presentation, he suggested that the value of this GPS unit goes beyond using it for surveying. He stated that the unit can be used to gather field data for GIS use. The city had not made any |
commitment on purchasing new equipment for surveying and GIS but did not discount the idea either. So periodically the sales representative would stop by our office to check in to find out where we are with our GIS endeavor. I contacted him to find out when he planned to stop by the office and discussed an idea I had in mind. I proposed the idea that if he is willing to let me demo their |
|
GPS units, I will be able to give an honest account of my experience using the unit. By
doing this, I felt it would be a win-win situation for both of us. Although he lives in Reno, Nevada, he agreed to come down and help me with the project. It turned out that his mother lives about 25 miles from Fairfield and had not
seen her for months and this gave him the incentive to come down and work with me. As agreed, we met a week later after
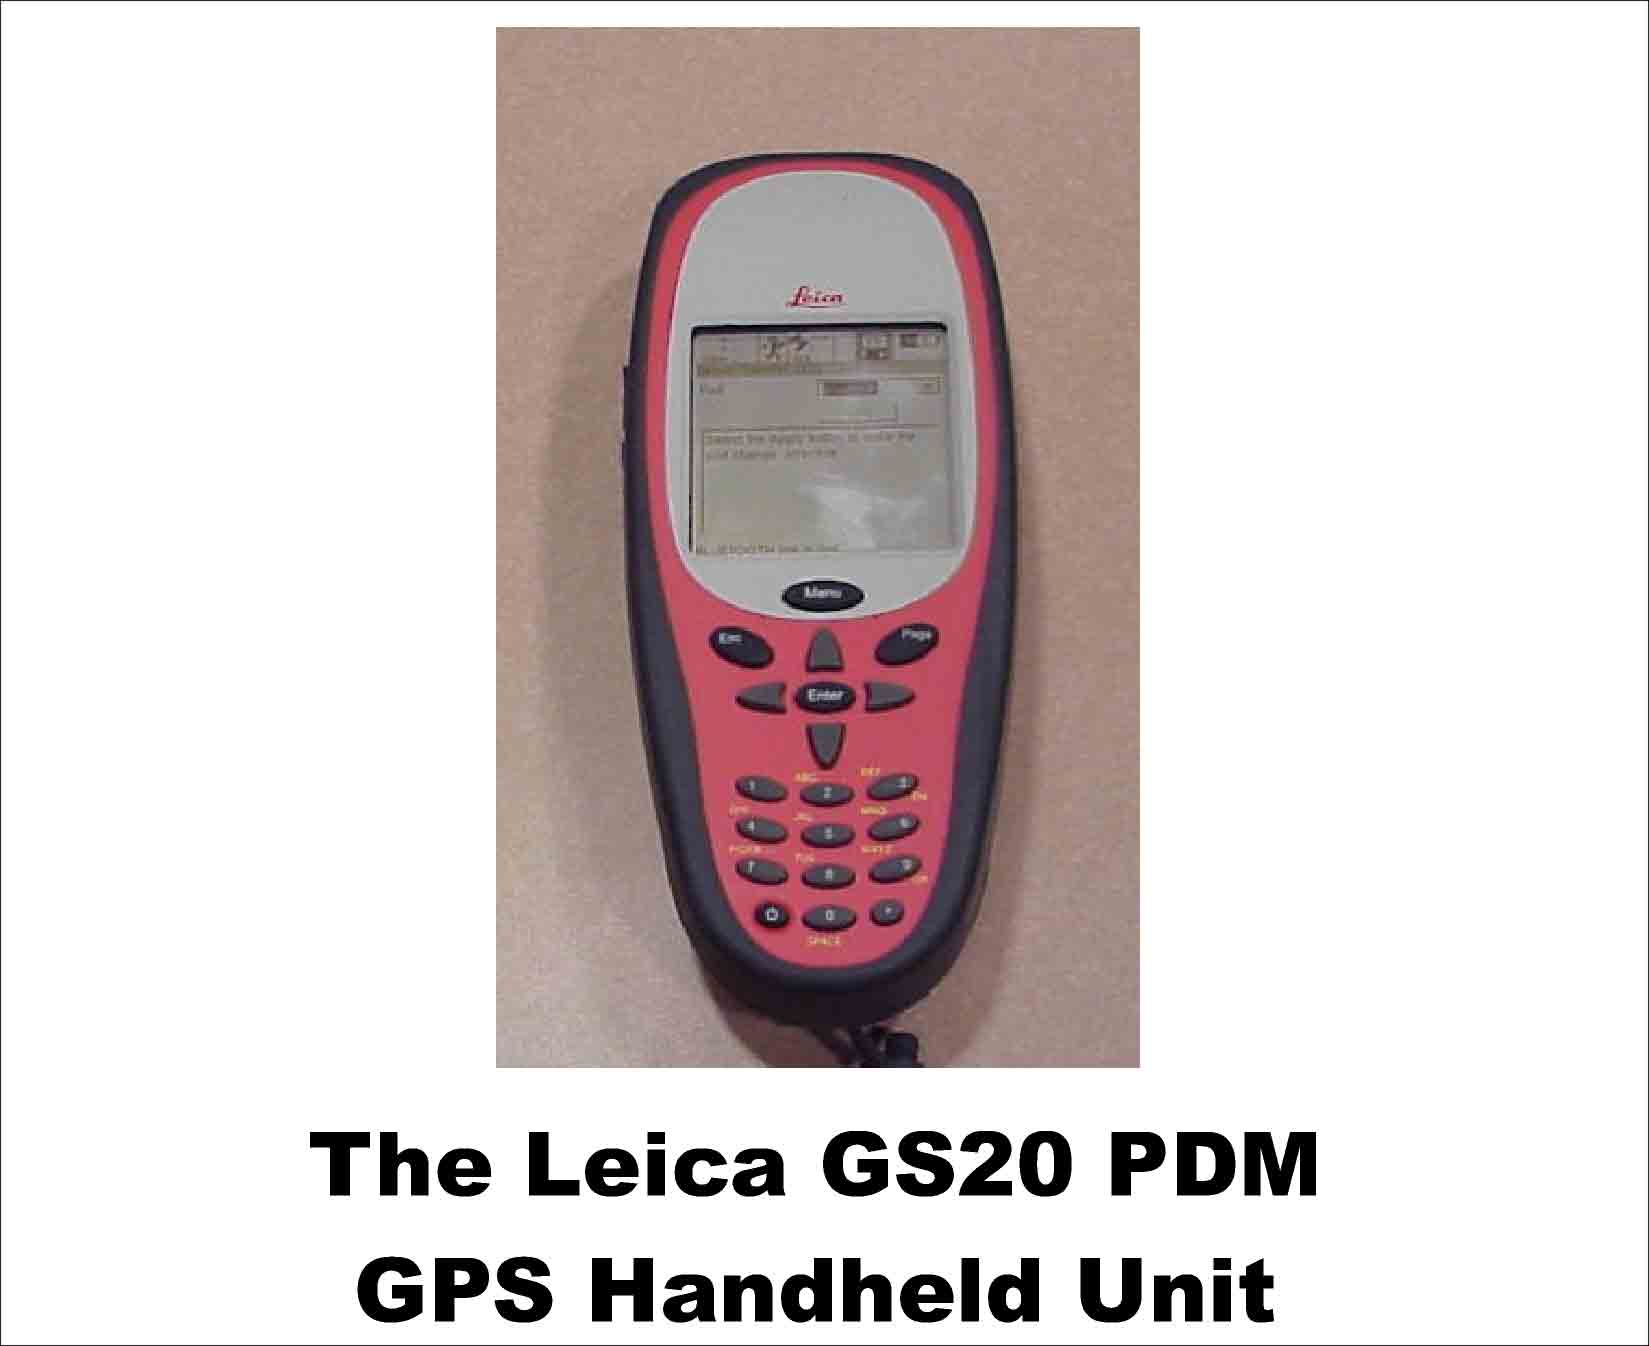
work hours in the field collected the data again. This time we used the Leica GS20 PDM handheld GPS unit that he brought
with him. |
|
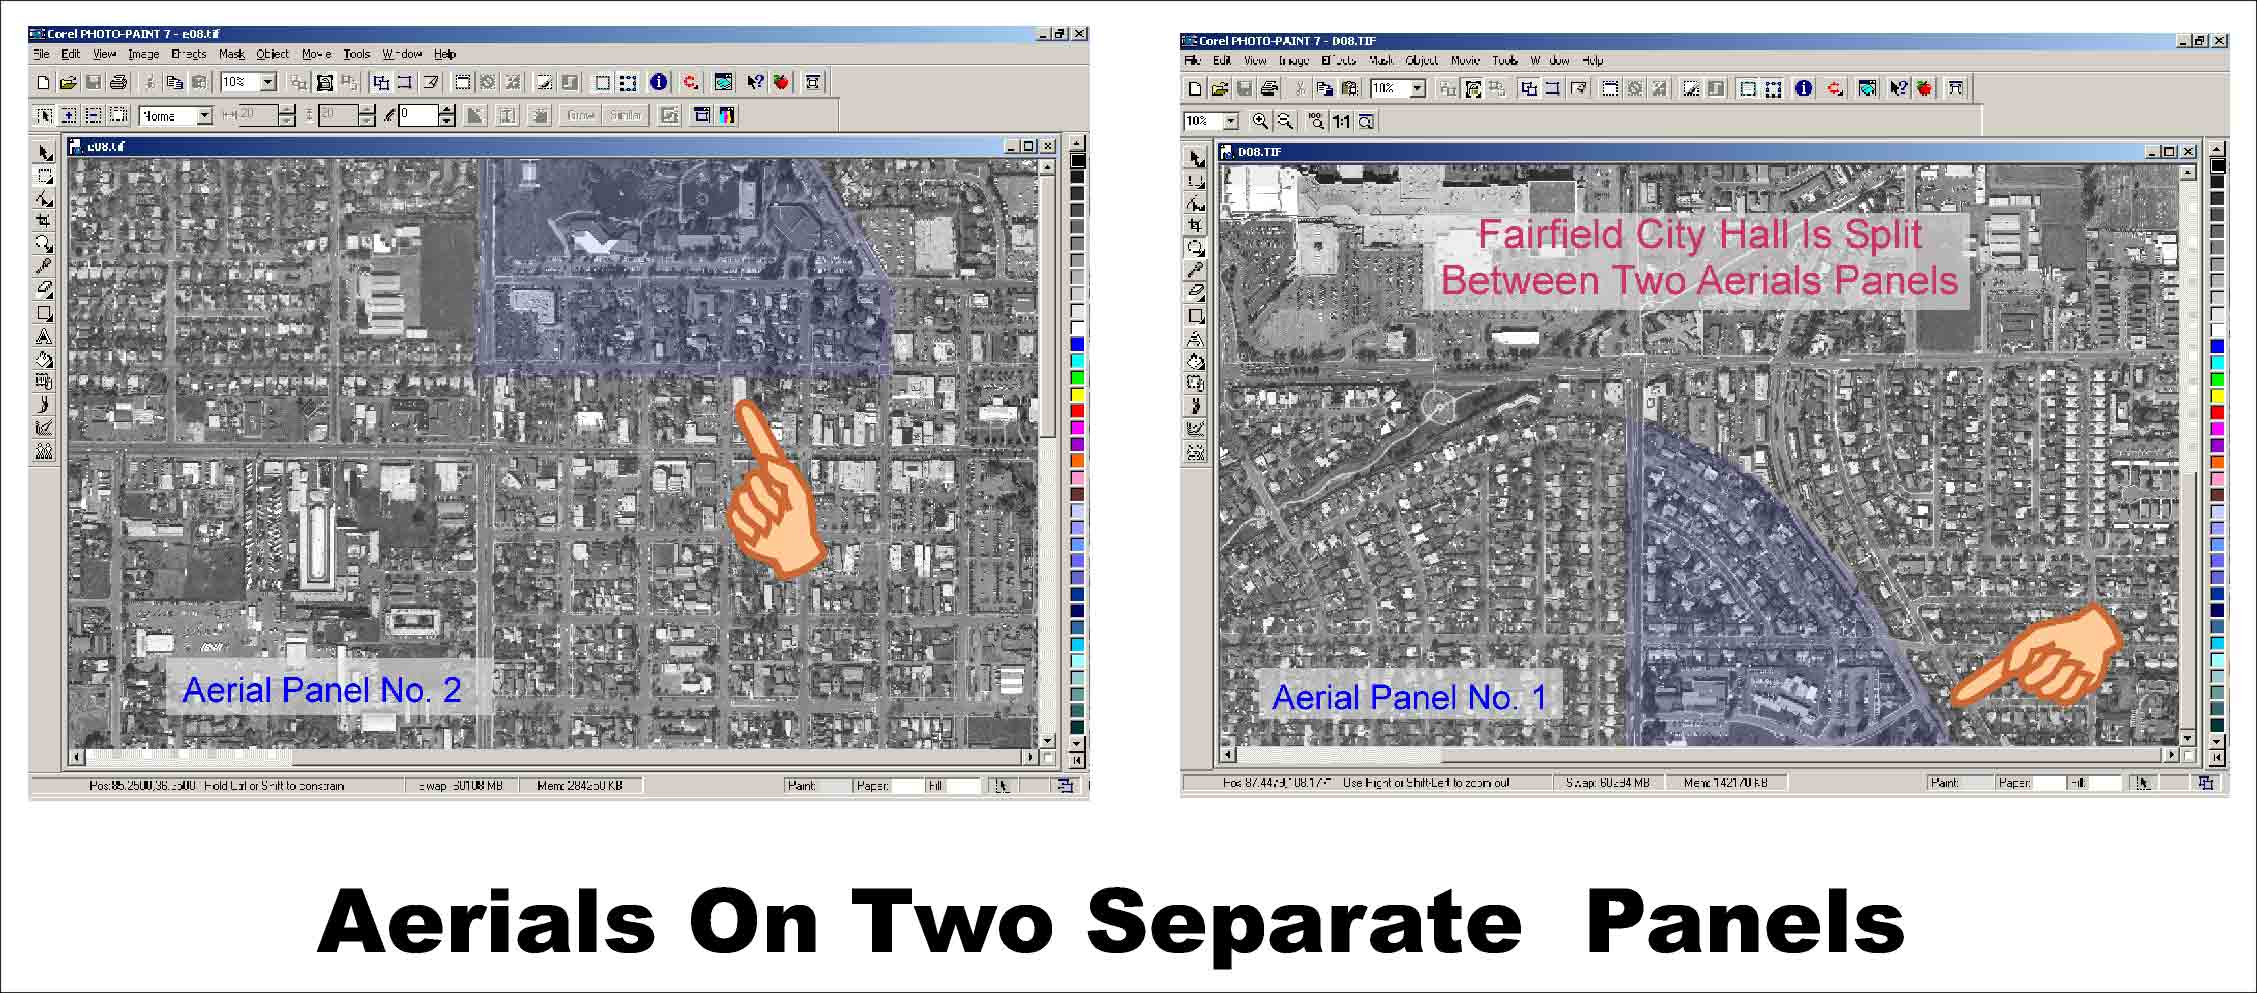
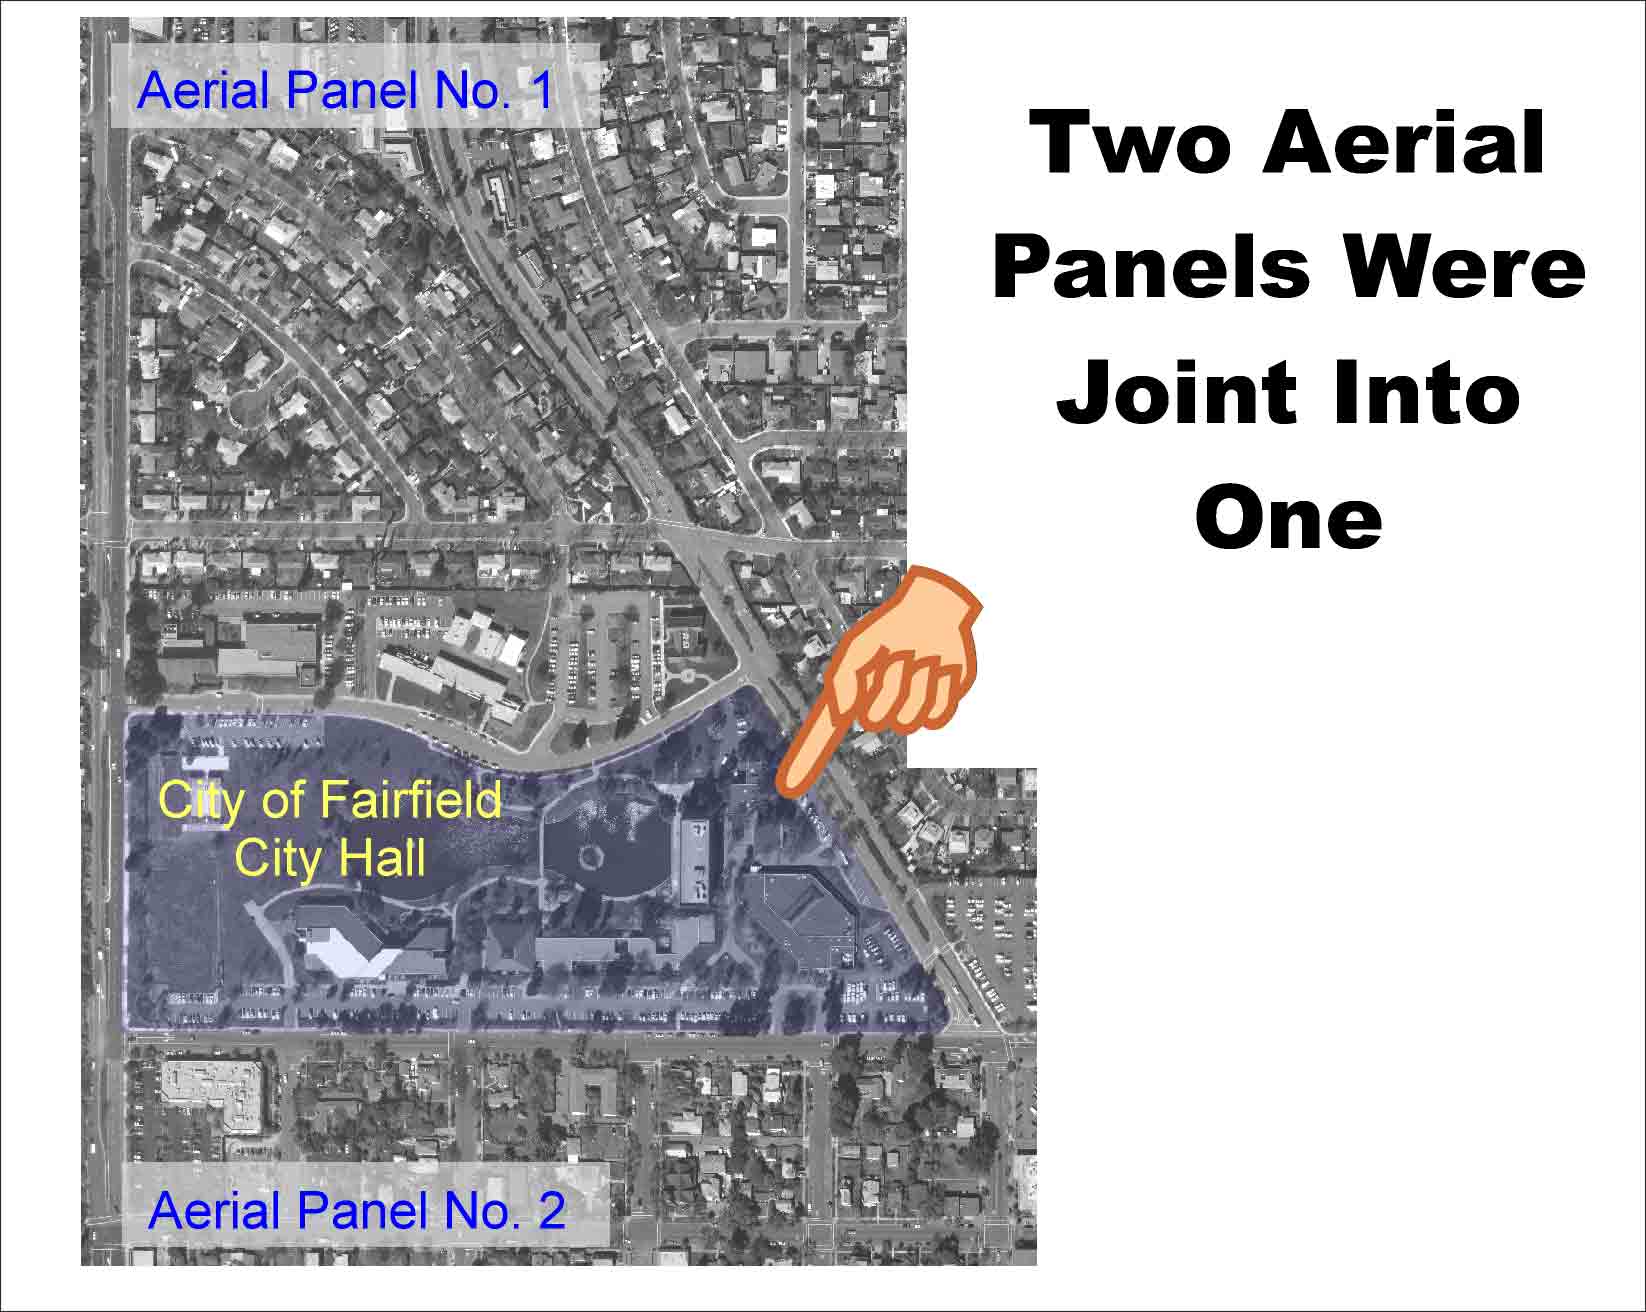
Results The Leica GS20 PDM unit is easy to use. It comes with preloaded software that takes care of downloads and file conversions. We were able to set up feature classes and attributes information prior to collecting the data. Once powered up, it located the available satellites and gave us the coordinate for each of the signs. What I did experience with the Garmin and Leica units was that one must stand at the location at an average of 3 to 5 minutes. There are plenty of trees and other obstructions that prevent quick satellite fix. So the thought of going to a sign, take a reading and within a few seconds, moving on to the next sign, was a misconception on my part. In fact it took us about an hour to do 15 signs. The thought of hiring a consultant to collect the data perhaps will be more efficient and wise time management.. City Hall was split between two aerial panels. What I did was bring the two panels into Corel Photopaint, joined them as one and cropped the area of the project. This enabled me to highlight City Hall and one block north and south of it for presentation purposes. It was then brought into Geomedia Professional. |
|
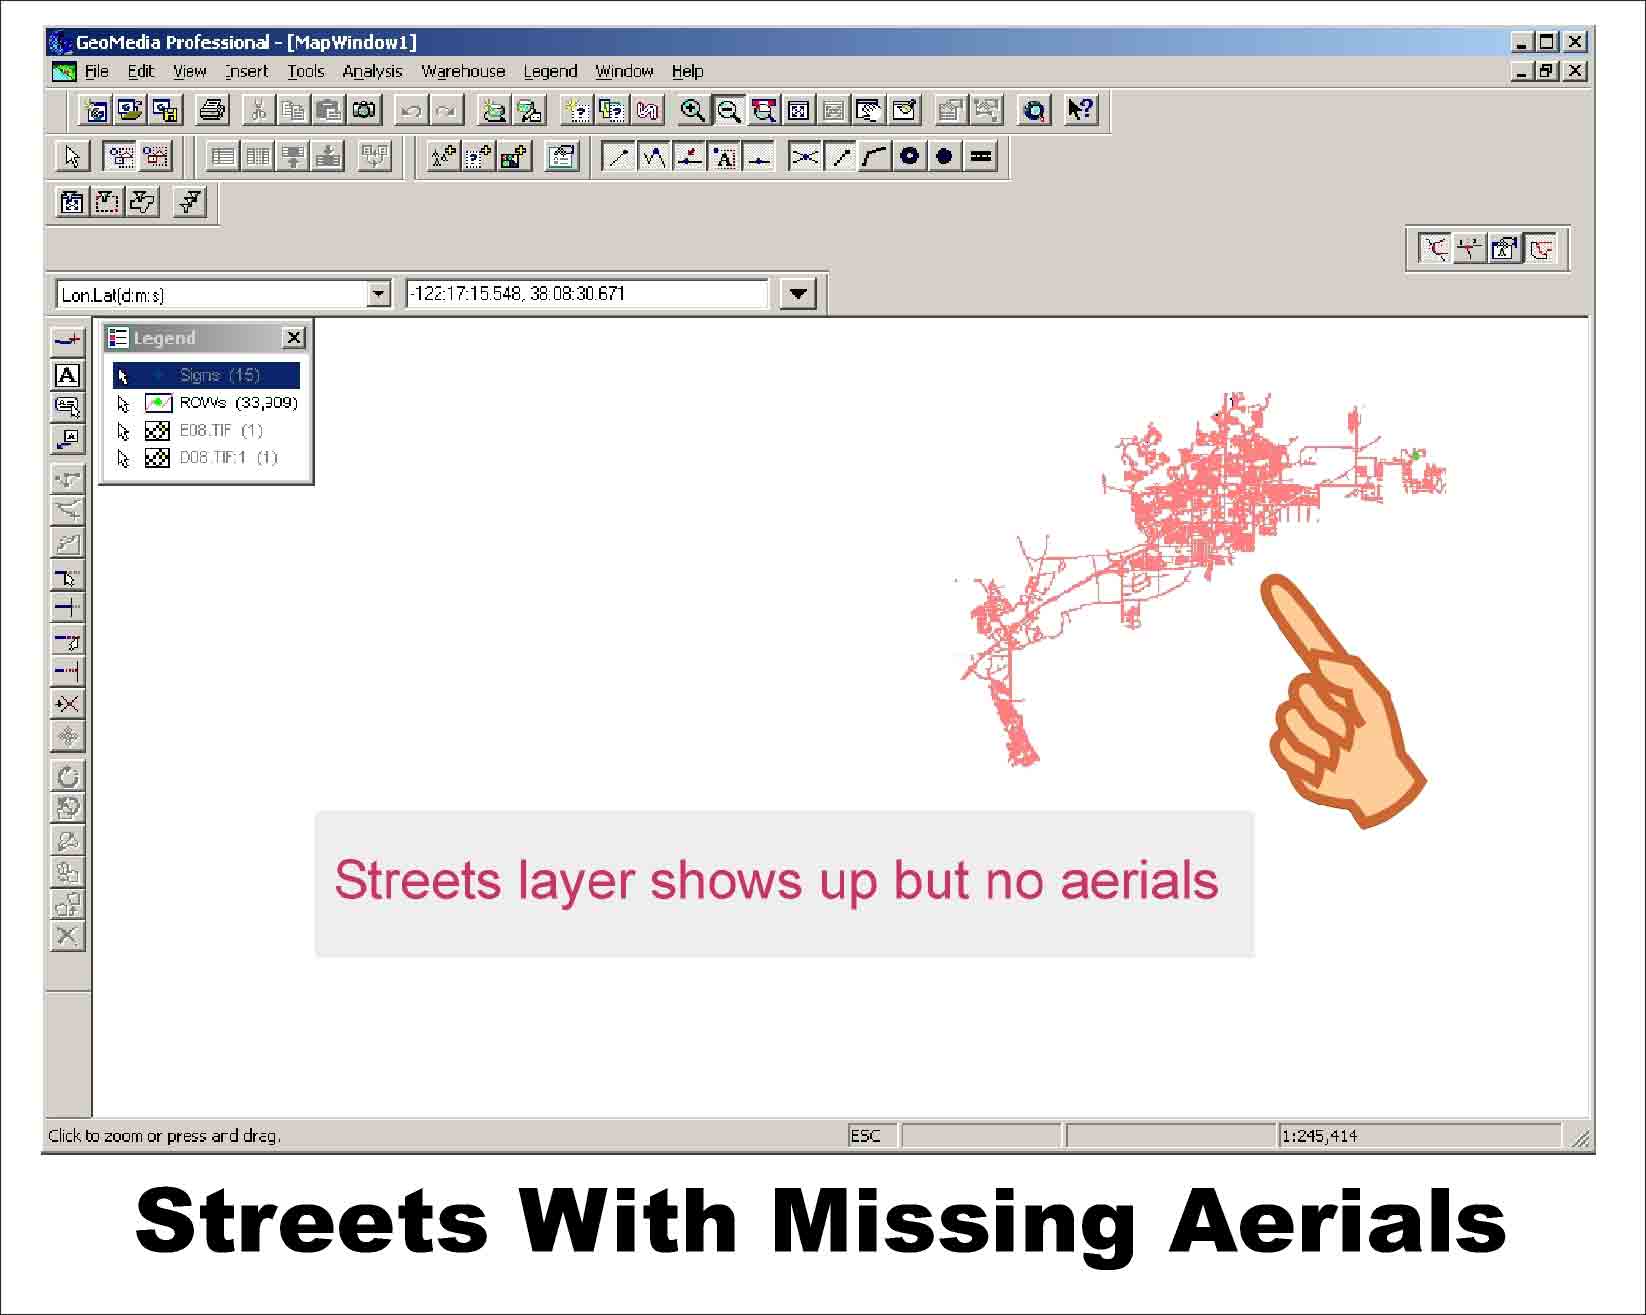
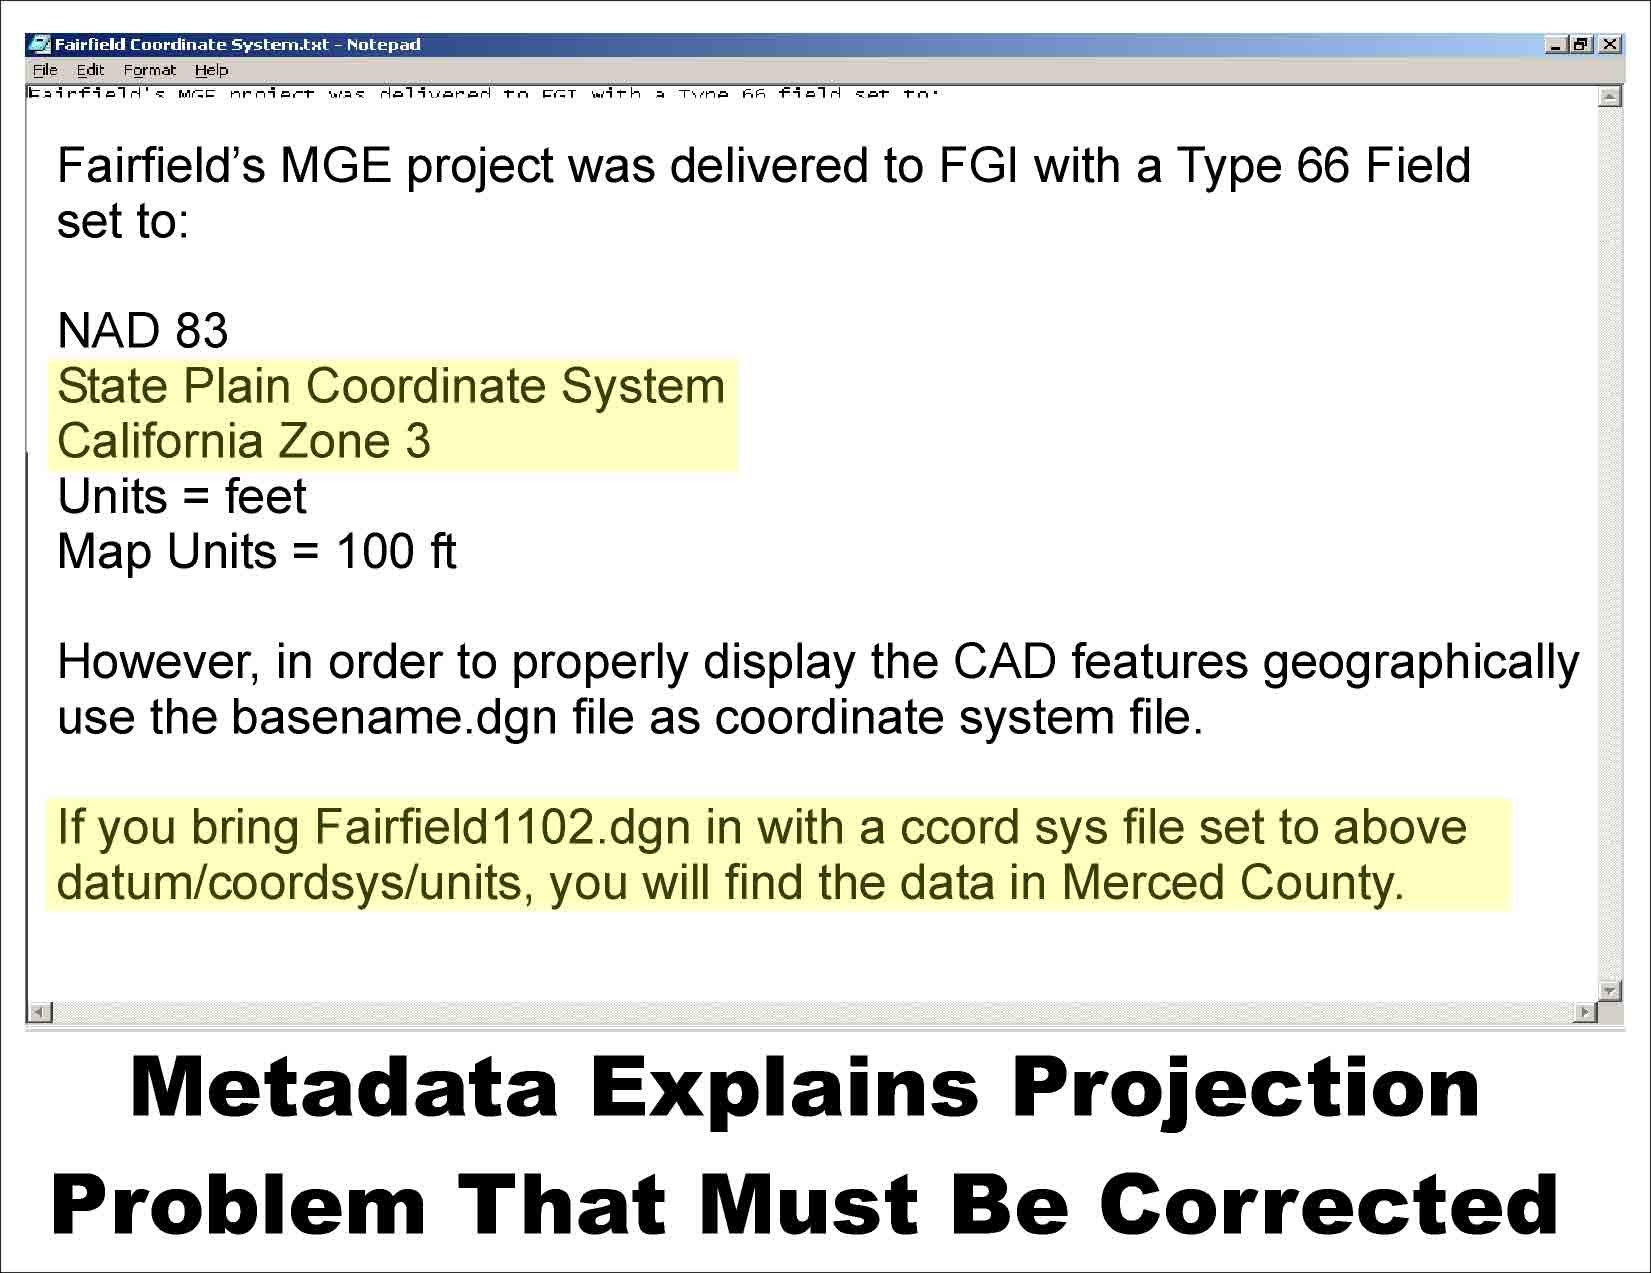
Next, I brought the street CAD as layer 2 in GeoMedia Pro and ran into some problem. The street layer was visible but the aerials where no where to be found. When I removed the streets layer and refreshed the screen, the aerials came up. I suspected that the aerials and the street layers where in different projections but I didn't know which one had the correct one. After, a long trial and error process, I was able to locate the metadata for the streets CAD file and it stated that this data was projected using the wrong state plane coordinate system. The state plane used was Zone 3 instead of Zone 2. This made a big difference in where the streets where in relation to the aerials. In a matter of fact, the metadata warns that it will show up in Merced County, which is over a hundred miles away.
| 
|
|
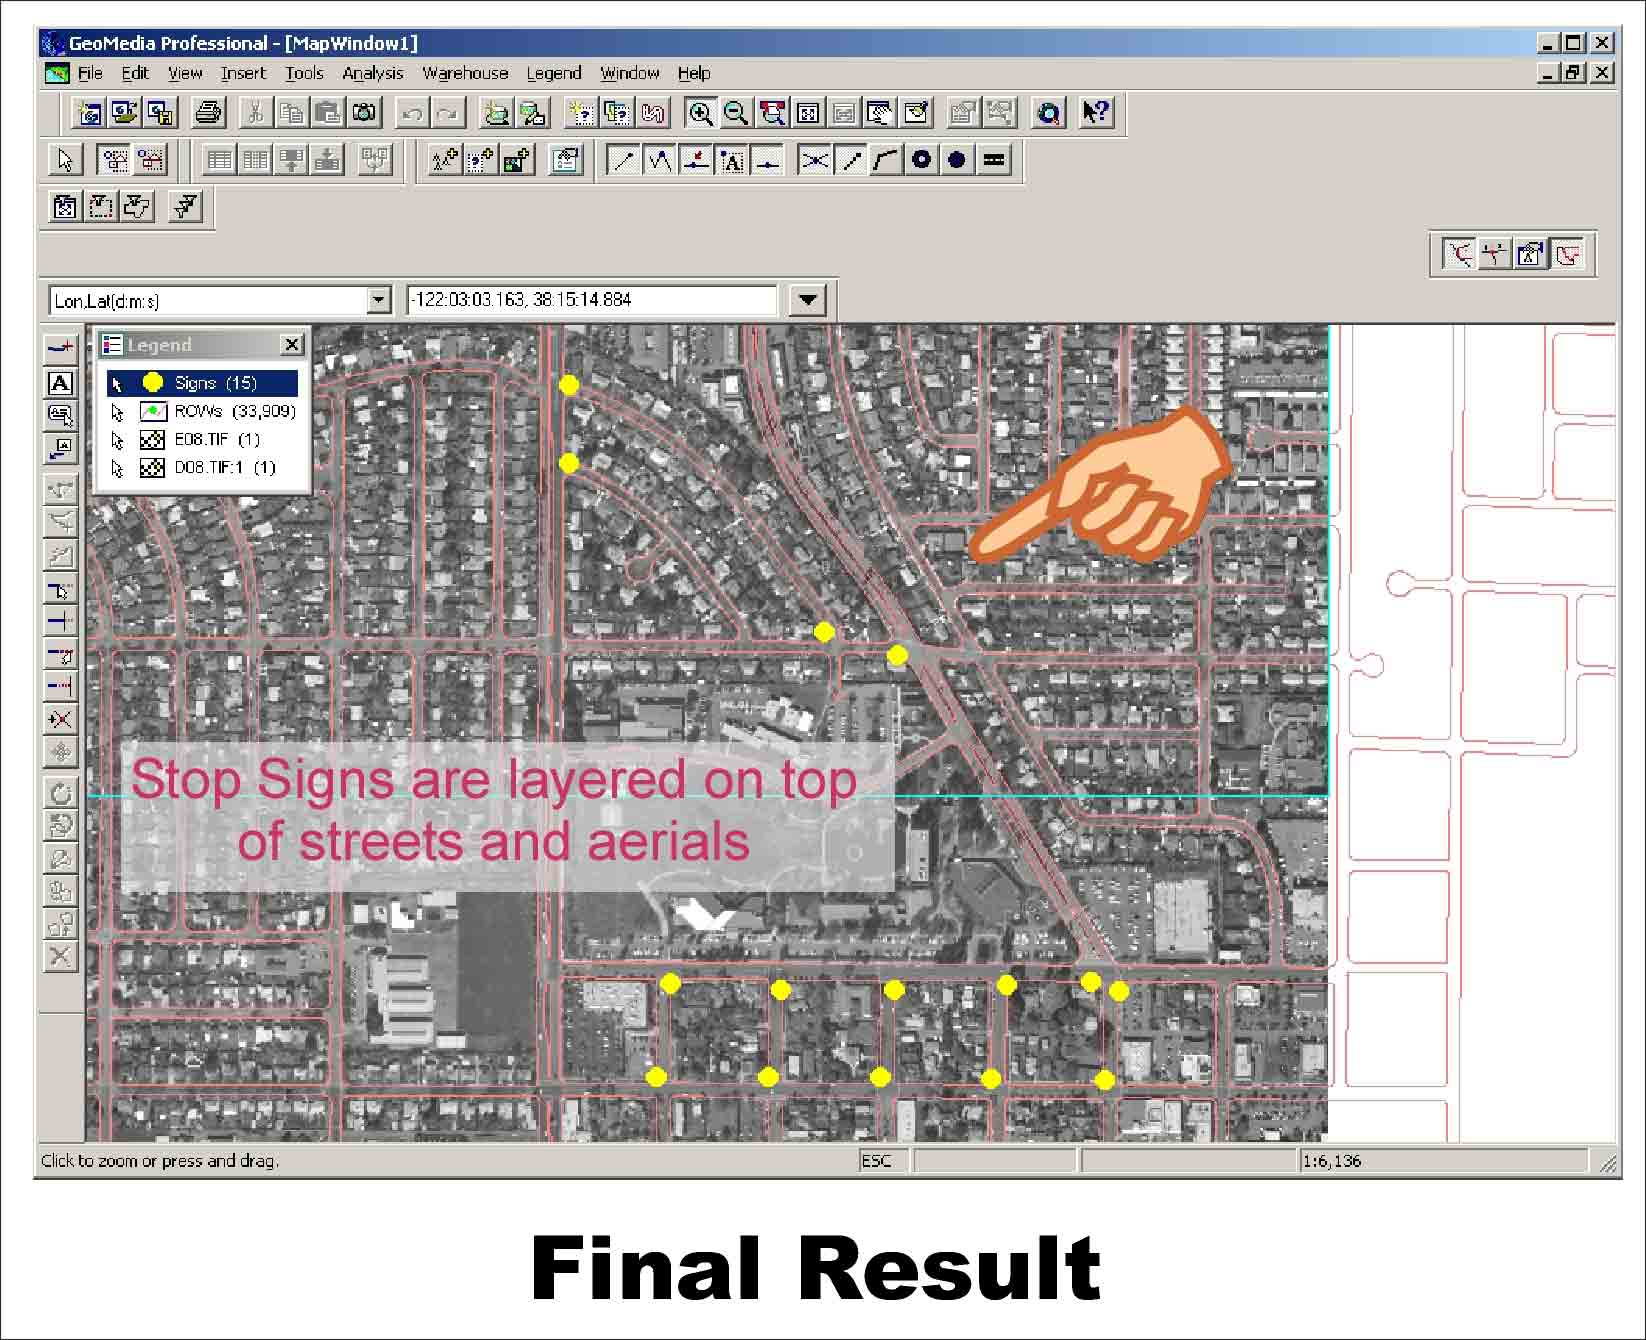
Using GeoMedia Professional's reprojections command, I was able to bring the aerial and the streets CAD file together. When I brought the data that we collected in the field earlier, it also projected at the right location. It could not be seen at first because the points were in dark blue color and the size were very small but after changing the color of the points to yellow and making them larger, the result was dramatic. I had successfully layered the three data together and completed my first GIS project.
| 
|
|
Analysis One of the things that I’ve learned from this project is that there are many things that can go wrong. First in foremost, is my assumption that the new software I purchased, ArcView 8 by ESRI, was going to make my task a lot more simpler and would enable me to complete my project in much sooner time. Technologies today are constantly changing and new products are continually upgraded. It appears that what is the latest tools today may be obsolete a year later. The City of Fairfield ran into the same problem when it came to building its database. By not keeping up with the changes in technologies, the data has become useless by today’s GIS standards. What is promising is that today's technology can help rebuild this database in much shorter time and with greater accuracy.
| Conclusions GIS is a wonderful tool. I am convinced that any local government and private enterprises can benefit from what it can do. Gathering good data is the most important part of GIS and can be the most difficult and most expensive. Then one must know what to do with it once it’s acquired. I’ve learned that there are good products out there, such as the Leica handheld GPS unit, which can help in gathering these data. There are many things I still need to learn about GIS and what else it can be used in the city. Through this project, I did learn the importance of good metadata. I hope that this project will help me convince the decision makers to implement GIS in the city.
| References Harrington, Andrew 2001. GPS/GIS INTEGRATION, What’s the Ideal GPS Satellite Configuration? Geoworld, April 2001. Khisty, C. Jotin, 1990.Transportation Engineering – An Introduction, Prentice Hall, Inc., Washington University 1990. Vail, George 2002. Sign Inventory and GASB 34 Compliance, Public Works, March 2003. http://www.pwmag.com Links California Department of Transportation, Traffic Manual, Chapter 4 – Signs Source: http://www.dot.ca.gov/hq/traffops/signtech/signdel/chp4/chap4.htm#4-03 Accessed: 2003.04.22 City of Fairfield Demographics Source: http://www.ci.fairfield.ca.us/about_fairfield/demographics.htm Accessed: 2003.04.22 Leica Geosystems Product Information http://www.leica-geosystems.com/products/accessories/gps/index.htm Accessed: 2003.05.03 |