|
||||||||||||||||||||||||||||||||||||||||||||||||||||||||||||||||||||
|
|
||||||||||||||||||||||||||||||||||||||||||||||||||||||||||||||||||||
|
ABSTRACT The mosquito potential of land cover in Western Fresno County, California, as mapped by the State Department of Water Resources, was derived using a Breeding, Feeding, Resting ecological model in ArcView 8. A spatial diffusion model, using the resultant mosquito potential surface and land cover-based weighted buffers, was developed to predict the spread of mosquito-borne diseases such as West Nile Virus from an initial introduction point throughout the environment. Results showed that differences in land cover influenced the speed with which the virus spread across the landscape, indicating that detailed land cover information could be integrated into current West Nile Virus prediction models to improve their precision.
|
||||||||||||||||||||||||||||||||||||||||||||||||||||||||||||||||||||
|
INTRODUCTION In August 2003, the first identification of West Nile Virus (WNV) was made in California, four years after first being identified in New York. As had been predicted, WNV obtained its foothold in California in the salt marshes and irrigation canals of the Imperial Valley. Warm temperatures, standing water and immediate proximity to Mexico where the disease had already been established and its location on the Pacific Flyway made the Imperial Valley an ideal environment for the encephalitis-like disease spread by mosquitoes and birds. Within two months of the initial evidence of WNV's arrival in Imperial County, monitoring of mosquito pools, dead birds and 'sentinel' chickens had identified its presence in San Diego, Orange, Los Angeles, Riverside, and San Bernardino Counties. By October, 2003, a laborer working along the Santa Ana River in Riverside County and an 'irrigation master' in Imperial County became the first two California-infected human cases. At the time of this writing, one case of WNV has been identified in a horse in San Diego County. Of concern is the inevitable arrival of the virus in California's Central Valley, a 400-by-60 mile region of contiguous irrigated agriculture, waterways, wetlands and rapidly expanding urban areas. The Central Valley's abundant moisture, hot summer temperatures, pastures and feedlots, duck marshes and wildlife refuges, and riparian woodlands and orchards provide an environment suitable to large populations of mosquitoes and migratory birds. Rapid expansion of the virus among those populations is expected. In preparation for WNV's arrival, California has implemented a monitoring and surveillance program built on three legs: Mosquito pool testing, testing of dead birds and regular testing of 'sentinel' chickens sited at approximately 200 strategic locations around the state. Additionally, required reporting by veterinarians provides warning of the virus's arrival -- horses and humans are the two primary mammalian victims of the disease). A variety of models using these point-based surveillance data have been developed to predict WNV outbreaks and migration patterns. Satellite-based remote sensing imagery as well as climatic data have been show to provide useful information for timing likely outbreaks. The point-based identification of WNV 'events' is being used in New York City and Pennsylvania to interpolate areas of likely outbreak that require remediation. Models using remote sensing inputs have generally been satisfied to interpret the observed "greening-up" of agricultural fields as a surrogate for moisture conditions favorable to breeding mosquitoes. Mosquitoes and birds, however, have habitat preferences more complex that the mere presence or absence of a crop or the application of irrigation water. Were actual land cover and crop type information employed, the varying transmissibility and impedance characteristics of each cover's environment might result in models that are more closely attuned to local reality. It is reasonable to believe that this added precision would improve the accuracy and utility of current models. This project evaluates land cover in Fresno County, California, as mapped by the California Department of Water Resources, to develop a cover-based mosquito potential index that can serve as a surrogate measure WNV's probability of being present. Additionally, a land cover-driven model for predicting the spatial diffusion of mosquito-borne diseases is presented.
|
||||||||||||||||||||||||||||||||||||||||||||||||||||||||||||||||||||
|
BACKGROUND West Nile Virus is an encephalitis-like viral disease that is spread by birds and the mosquitoes that bite them and pass it on to humans and animals. It attacks the central nervous system. In 80 percent of those infected by WNV, no symptoms are present. Twenty percent of those infected can present symptoms such as rash, swollen lymph glands, headache, body ache, nausea, vomiting, fever and weakness. Severe symptoms such as high fever, neck stiffness, headaches, coma, convulsions, vision loss and paralysis are seen in slightly less than 1 percent of cases. Long term symptoms and death occur in the most severe infections. The first identification of WNV in the United States was made in New York City in 1999. In four years, the disease has spread to portions of all coterminous states except Oregon and Washington. Particularly hard hit have been the states of Colorado and South Dakota, the latter suffering disproportionately due to it's small population. In 2002, over 4,000 people were infected with West Nile Virus and 284 died. Birds are the host for the virus, particularly those of the Corvidae family. Ravens, crows, jays (blue and gray) and magpies appear to be defenseless against the disease, with near 100 percent mortality. Testing dead birds for the virus provides one of the earliest warnings of the iys presence in an area. Over 130 species of birds have been infected by WNV. In 2002, avian deaths in the U.S. increased five-fold over 2001, mirroring a ten-fold drop in the numbers of several bird species in Costa Rica since WNV spread to that area (Epstein and Causey, 2003).
Mosquitoes that bite infected birds are the vectors that transmit the
disease to other birds, amphibians and mammals. Humans and horses
demonstrate the least resistance to the disease of all mammals. They are
considered to be "terminal hosts" in that they cannot pass the
disease on to mosquitoes that bite them after infection, however humans
can transmit the disease by blood transfusions, organ donations,
breastfeeding and across the placenta during pregnancy. There is no vaccine or treatment for
the disease in humans, although a successful vaccine is available for
horses. As a public health matter, controlling mosquitoes is the primary
means of short-circuiting further transmission (Bourne, n.d.). |
||||||||||||||||||||||||||||||||||||||||||||||||||||||||||||||||||||
|
||||||||||||||||||||||||||||||||||||||||||||||||||||||||||||||||||||
|
REVIEW OF LITERATURE AND RESEARCH The serious nature of the emerging disease has fueled research to find ways to predict the timing of outbreaks where the disease is already established and its likelihood of moving to new areas. This has taken the form of remote sensing studies to identify environmental indicators of climate, moisture and other factors associated with mosquito ecology. Additionally, considerable work has been done evaluating models that predict the disease's progression based on point-identification of locations where WNV has been found in dead birds, mosquitoes and sentinel chickens. Ahearn and Markokwski (2003) have developed a GIS-based model that uses dead bird and mosquito modeling, as well as a database of tens of thousands of mapped and geo-referenced "catchment basins" to manage WNV in New York City. An army of public health workers, directed by GIS technology and equipped with GPS devices, cell phones and foot-powered scooters, respond to outbreaks and regularly monitor and treat pre-defined sites around the city. The model uses a 0.5-mile grid overlaid across the city. Each day, the centroid of each cell is evaluated to count all dead birds found within a 1.5-mile radius and a 21-day window, values developed from specific knowledge about WNV ecology. The buffer distance was selected because it represents roughly twice the feeding distance of the Culex Pipiens mosquito species and it ensures that the model behaves as a continuous surface. The 21-day window represents three amplification cycles (from infection to death) of the disease within the bird population.
The program generates daily color maps showing areas of disease risk
and intensity and uses animation to show propagation over time. The
information is used to direct mitigation crews. The State of Pennsylvania has implemented a spatially-driven surveillance program for following and responding to the spread of WNV in the State (Conrad, 2001). Information is collected on the presence of the virus in any vector and identification of mosquito-breeding areas to define likely areas where the disease has spread and to apply control measures. Projection of GIS technology into the field has resulted in near-instantaneous accessibility of site data to analysts and decision makers. Beck, et al. (2000) applied remote sensing technology to the study of "landscape epidemiology" and described how remotely sensed data have been used in health applications to detect and map environmental variables related to the distribution of vector-borne and other diseases. Increasingly, sensor-configurations for future satellite programs are being designed with disease monitoring in mind. Landscape epidemiology involves the identification of geographical areas where disease is transmitted (Unknown, n.d. Landscape Epidemiology and RS/GIS). It is a ecological approach that involves the interactions and associations between elements of the physical and cultural environments (Unknown, n.d. Landscape Epidemiology and RS/GIS.). The presupposition underlying landscape epidemiology is that vegetation, geological factors, climate, etc. define an environment conducive to specific pathogens. If we understand the landscape elements and the science that controls them, we can make predictive generalizations about that environment. Rogers, et al. (2002) used 1-km resolution AVHRR imagery to determine Land Surface Temperature for the U.S. in order to predict the timing of WNV outbreaks following the winter dormancy of mosquitoes. Such remote sensing techniques generally equate the spring and early summer "green up" of vegetation with the presence of moisture, a necessary condition for mosquitoes to lay their eggs. NASA's Center for Health Applications of Aerospace Related Technologies is evaluating how remote sensing and GIS can be used to identify areas in the Sacramento Valley favorable to both birds and mosquitoes and the spread of encephalitis, a disease with symptoms and a profile similar to WNV (Unknown , 2002. NASA researchers developing tools to help track and predict West Nile Virus). Nearly all vector-borne diseases are linked to the vegetated environment during some aspect of their transmission cycle ( Beck, Lobitz, and Wood, 2000); in many cases, this vegetation can be sensed remotely from space. The spatial and temporal distribution of vector or reservoir and host species may relate to the occurrence and distribution of specific vegetation or crop types, not simply to whether an area has forests or grasslands, or "greened-up" vegetation. Research conducted by NASA Ames Research Center and other collaborators between 1987 and 1995 (Beck, n.d.) used multi-temporal Landsat Thematic Mapper (TM) data to identify and map "landscape elements" and to analyze the relationship between landscape elements and mosquito-human contact risk (i.e., malaria risk) in 40 Costa Rican villages. Stepwise discriminant and regression analyses indicated that the proportions of transitional wetlands and unmanaged pasture were the most important landscape elements in terms of explaining mosquito abundance. The two landscape elements were used to accurately (over 90 percent) distinguish villages with high and low mosquito abundance. Robert, et al. (n.d.) identified the mosaic of water bodies and the proximity of surrounding vegetation to be determinate of the distribution and density of mosquitoes around villages. Lathrop, et al. (2002) noted that host-seeking mosquitoes exhibit a contagious distribution, probably in response to cues related to landscape features, microclimatic conditions, and the distribution of blood-meal hosts. Field trapping indicates that C. tarsalis is consistently most abundant near elevated vegetation and least abundant in open fields, sand spits or over open water. Where there is elevated elevation, female mosquitoes tend to concentrate at the ecotone as well as within orchards and cattails, perhaps due to reduced wind velocity, particularly on the leeward side. On a regional scale, vernal pool landscapes of the Central Valley's eastern margin may play an important role in WNV's spread. In addition to enhancing the migratory bird habitats of the valley floor, during times of drought, they are thought to force the concentration of mosquitoes and birds into close proximity, greatly increasing the opportunity for WNV transmission.. Vernal pools are also significant on the continental scale of the Pacific Flyway corridor (Silveira, 1998). Early WNV studies indicate California's rice fields may play a larger role than rice fields in other states (Katz, 2003). While only a small portion of California's 50 mosquito species are generally found in rice fields, one of those species is the Culex tarsalis, the primary WNV vector in the West. It's rice-dwelling cousin, Anopheles freeborni, is more prevalent, but it avoids birds and feeds primarily on mammals. C. tarsalis feeds on both birds and mammals. A NASA study of rice fields in the Sacramento Valley found that early rice emergence and canopy development was associated with higher mosquito populations (Wood, n.d.). The highest populations of mosquitoes were found in rice fields with early canopy development that were in proximity to pastures. Washino and Wood (n.d.) summarized their rice research by proposing an ecological model based on the mosquito life cycle. Female mosquitoes, soon after emerging from the larval stage, mate and acquire a bloodmeal. Mosquitoes' primary food is nectar, not blood. But females require a blood meal before they can lay their eggs, usually three days later. The bloodmeal is followed by seeking out shaded rest areas such as fruit orchards or native vegetation where they can acquire carbohydrate meals and be sheltered from the sun and wind while an enzyme from the blood matures her eggs. Because the female's body weight doubles after the bloodmeal (Mosquito Trap Depot, n.d.), having a rest area close by increases the chance that she will reach shelter and survive. After the blood meal has been digested, the mosquito will oviposit her eggs and begin the cycle again. Their lives are a short 7-10 days and they will lay eggs two or three times before dying (Perich and Gleiser, 2003). C. tarsalis species oviposits approximately 190 eggs at a time (Reisen, W., 1993). Because of their short life span, mosquitoes that find themselves in close proximity to breeding, feeding and resting sites will be more successful than those who don't. They will produce more offspring. Based on the literature reviewed, the Breeding, Feeding, Resting paradigm was determined to be the most applicable to this project. Detailed crop type data was available from the California Department of Water Resources (California Department of Water Resources. Land Use Surveys.) land and water use mapping program and had already been digitized and was available for download over the Internet. CDWR had also published extensive data regarding applied water to many of the major irrigated crops in the state(California Department of Water Resources, 1994). Using the presence of natural standing water or average applied water for the 135 unique land covers mapped by CDWR in the Valley, it was possible to score each type for moisture that might be available for breeding mosquitoes. Treating applied irrigation that might puddle or run off into ditches from field crops or orchards may seem dramatically different than the thousands of acres of standing water in rice fields. It is and the scoring can account for that. But Culex tarsalis, the most important vector of arboviruses like WNV in western North America (Reisen, W., 1993), is a ubiquitous opportunist that will take advantage of a wide range of wet conditions. The larvae tolerate a wide range of water conditions (Alameda County Mosquito Abatement District, Larval Habitats of California Mosquitoes) and may be abundant in agricultural tailwater, alkaline lake beds, fresh and saline wetlands up to 1% salinity, secondary treated sewage effluent and oil field run-off. Development ranges from 7 days to 4 weeks depending on temperature and food availability. Fewer than 5 percent of larvae survive. Its distribution is widespread up to 9,800 feet and is most abundant in hot valley areas with agricultural usage of water (Alameda County Mosquito Abatement District, Culex Mosquitoes of California). C. tarsalis species oviposits approximately 190 eggs at a time (Reisen, W., 1993). The larvae tolerate a wide range of water conditions and may be abundant in agricultural tailwater, alkaline lake beds, fresh and saline wetlands, secondary treated sewage effluent and oil field run-off. Development ranges from 7 days to 4 weeks depending on temperature and food availability. Fewer than 5 percent of larvae survive. Just as breeding scores could be assigned, the cover types on the CDWR maps could be scored for likely availability of bloodmeals -- a lettuce field ranking low, native vegetation higher and duck marshes, pastures and feedlots the highest. Each covertype could be characterized by its canopy coverage and the resting habitat it offered a mosquito following a bloodmeal. Combining the scoring of breeding, feeding and resting suitability for each cover, an intrinsic mosquito potential index could be computed for each cover type. As Washino and Woods noted, mosquito counts within rice fields varied considerably. There was no intrinsic level of mosquito activity for rice. Counts in sampled areas surrounded by other rice fields or by low-lying field crops were consistently lower than those from rice field sample sites in close proximity to bloodmeal sources (e.g., pastures) and resting habitats (e.g. peach orchards). To more accurately determine a particular location's mosquito potential, proximity or neighborhood factors that contribute to population variations would have to be considered. The geographic technique for doing this analysis would require buffers around areas of interest. The literature provides a range of distances over which mosquitoes are likely to wander in search of bloodmeals. During host seeking flights, they can fly up to 17 miles, according to Reisen (1993), although they generally average about 100 yards a day from breeding sites in riparian and agricultural habitats. Wood (n.d.) analyzed proximity factors within 2 km buffers of rice fields in the Sacramento Valley. In a study of malaria risk in Chiapas, Mexico, a 1-km radius around villages was used. This 1-km radius was based on the typical flight range of an adult Anopheles albimanus mosquito; within this flight range, she must find bloodmeals, resting sites, and larval habitat in order to reproduce (Beck, Louisa R., n.d. Malaria in Chiapas, Mexico). Robert, et al. (n.d.) observed that the majority of mosquitoes stayed within a short distance (<500m) of their last blood meal.
|
||||||||||||||||||||||||||||||||||||||||||||||||||||||||||||||||||||
|
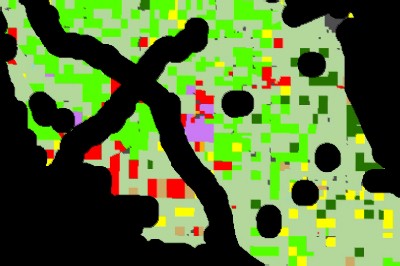
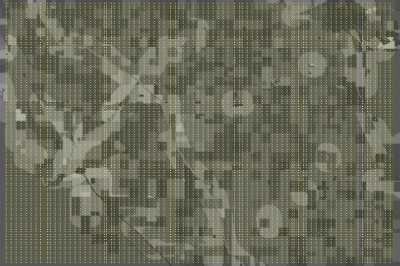
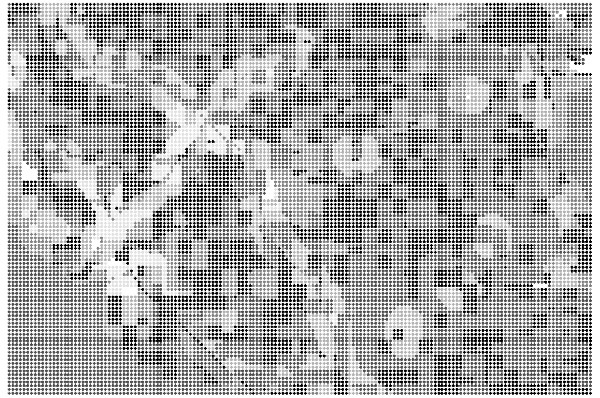
METHODS For over 30 years, the California Department of Water Resources has mapped land use across the state. Counties are mapped on a 4-8 year repeating cycle on 1:24,000 scale maps. In recent years, these land use surveys have been digitized and made available for distribution in ArcView compatible shapefile format. The data is distributed in 1927 NAD UTM projection. This projection was used in this study. All 22 counties in the Central Valley were downloaded and combined into a seamless area. While the entire region was analyzed and a Mosquito Potential Index computed, the data set's size was an obstacle to designing and testing the spatial diffusion model portion of the project. So, a 1994 survey conducted in Fresno County was selected to obtain land cover data for analysis and diffusion model development. The data was downloaded from the Water Resources website as a full-county file (i.e. all 1:24,000 quadrangles already mosaicked together). To model the data, it was necessary to convert DWR's covertype designations to categories meaningful to the analysis. A two-phase ecological model was applied to the vegetation cover to define the intrinsic mosquito potential of each cover type as well as the extrinsic potential resulting from certain covers being found in proximity to each other. The mosquito potential intrinsic to each cover type was defined by its suitability to the three phases of the mosquito life cycle -- Breeding, Feeding and Resting. Separate Breeding, Feeding and Resting surfaces were defined from the DWR land use map by linking it to a database containing assigned scores for each cover (see Appendix A). Breeding scores, ranging from 1 to 5 were assigned to each covertype based on an assessment of available moisture; in the case of agricultural covers, the scores were based on average applied irrigation water for that crop type. Assignment of scores was based on "best judgment" and was subjective in some cases, although the relative rankings of the different covers are believed to be accurate. Feeding scores were based on the likely availability of blood meals at the cover type. Some native classes, like wetlands and marshes, rated fairly high, while bean fields rated low. Feedlots, poultry farms and pastures received the highest score (e.g. 5). Resting scores were based on a cover's canopy and ability to provide shade and protection from the wind. Beans and tomatoes ranked low while crops like cotton ranked higher. Orchards ranked highest. Anyone wishing to pursue this further would want to begin by re-evaluating the scoring used here. The three resulting maps were multiplied together, using ArcView's Spatial Analyst software to create a map of intrinsic mosquito potential. Values ranged from a low of 1 to a potential high of 125. A second analysis was conducted to identify areas where extrinsic factors would be expected to increase mosquito populations above those that simple cover type would predict. Cover types with high Breeding scores or high Feeding scores or high Resting scores had 1 km buffers applied to them (See Appendix A). The resultant surface showed areas where all three high scoring buffers coincided. These areas were ones where proximity of cover types provided the optimum habitat for mosquitoes. This buffer surface, with the optimum areas given a value of 2 and the unaffected areas given a value of 1, was multiplied against the intrinsic mosquito potential surface to create the final mosquito potential index. Values ranged from a low of 1 to a potential high of 250. This was the surface to be modeled to determine how the vegetation would influence the spatial diffusion of WNV across the landscape. ArcView 8.x does not provide any kind of diffusion function. Using the Spatial Analyst, it would be simple to identify the optimum route WNV might follow from Point A to Point B, but one must be in the ArcInfo environment to do the kind of network modeling that would let us see the infinite number of routes from Point A to all other points in all directions. Further, the Mosquito Potential Index created, above, showed areas of high and low potential -- a type of elevation map. The routing functions in Spatial Analyst would treat these differences in potential like differences in topographical relief when that is not what the variations in potential represent. An area with high potential is one in which we would expect a large population of mosquitoes and, therefore, a higher probability of WNV passing through the area at a greater speed and exerting a greater influence on surrounding areas. The Mosquito Potential surface is actually a transmissibility/impedence surface and not an elevation surface. It defines speed of transmission. This is not part of the ArcView 8.x package. Johnson, et al (2001) has developed an application in ArcView 3.2 for mapping the spread of weeds over time that would seem to have met the needs of this study, but it was written in the Avenue programming language and would not work with ArcView 8.x nor could it be easily modified (personal communication with the author). The solution was to transform the Mosquito Potential Index (MPI) surface into one compatible with the tools provided by ArcView 8.x that could used to model spatial diffusion, namely Select By Location and Buffer. This was accomplished by placing a shapefile made up of a network of regularly-spaced points over the MPI surface and transferring the index values from the MPI to the intersecting points. Movement across this network of points could be accomplished by using buffers, the diameters of which were related to the value of their mosquito index. A buffer would "capture" adjacent points which could, in turn, be buffered according to their index values. In this way, a WNV event could begin at a point and travel outward to surrounding points as a function of each location's index value. Even this solution could not be accomplished in a straightforward manner using ArcView-out-of-the-box. It was necessary to download three different scripts from the ESRI website, created by users kind enough to share their work: FishNet (Nicholas), Polygon to Centroid 1.1 (Solorzano, 2001) and GridSpot (Rathert, 2003). FishNet created a polygon shapefile consisting of a regularly-spaced, user defined grid. For this study, a 210 meter grid cell size was created to overlay the 30-meter-cell-sized MPI raster file. The Polygon to Centroid script created another shapefile that consisted of the centroids of the fishnet polygon file. Finally, GridSpot was used to transfer the MPI scores from the raster image to the point file. Using this surface, a WNV event (e.g. a trap captures a mosquito that tests positive for the virus) was simulated at a point by placing a buffer around it that was sized relative to its MPI. The smallest buffer had to be large enough to "capture" all the adjacent points in the grid, otherwise the model would come to a screeching halt. The procedure then called for MPI-based buffers to be placed around all the captured points, thus advancing the spread of the virus. The new points captured were likewise buffered and the areal extent of WNV extended. As the iterations proceeded, the influence of the various cover types and the proximity factors became apparent. The spreading pattern was not a "bulls-eye, but an irregular, cumulus-like land cover-driven explosion across the landscape.
|
||||||||||||||||||||||||||||||||||||||||||||||||||||||||||||||||||||
|
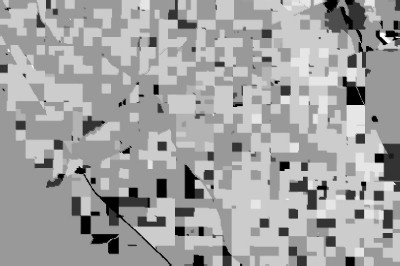
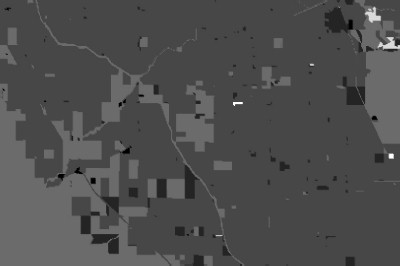
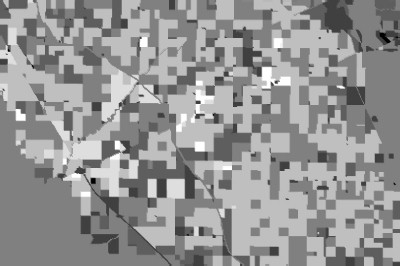
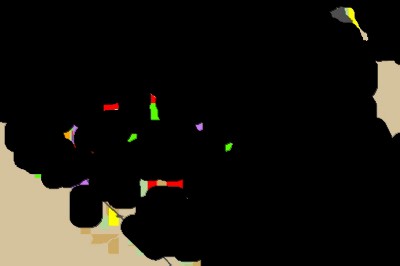
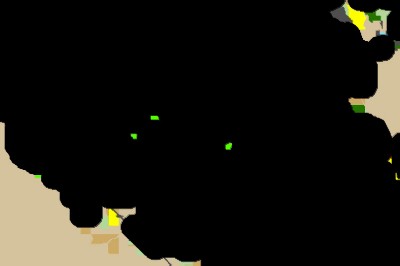
RESULTS What follows is a step-by-step presentation of the data and the procedure:
|
||||||||||||||||||||||||||||||||||||||||||||||||||||||||||||||||||||
|
ANALYSIS As seen above, the procedure developed here works. But there is significant room for improvement and further development. First, the spatial diffusion modeling requires the user to iteratively select/buffer/expand, select/buffer/expand. In the early stages, this process goes quickly, but by the time one reaches the 40th iteration, each cycle can take 15-20 minutes to accomplish. This is not practical unless there is no other way to get the information. However, the process appears to be one that could be automated with macro commands. this would not speed up the procedure but it would make it one that the user could start at the end of day to run over night. Second, like any model, it is no better than the inputs. The values used here for Breeding, Feeding and Resting scores for each cover should certainly be subjected to scrutiny and modification by other, better-informed minds. If the concept of land cover-derived MPI is useful, revisiting the assumptions used in those scores would be worthwhile. Third, there are many, many factors that explain the dispersal of mosquitoes and the diseases they carry. By no means is the land cover the only, or perhaps, even major, factor. The MPI derived here, is proposed as an additional layer of information that may improve the spatial precision of predictions made with other models. Fourth, ArcView 8.x appeared to be buggy at times. The animation, above, was created from approximately 45 select/buffer/expand iterations. It required the better part of a day to create those 45 layers. However, when they were to be added together in Spatial Analyst's Raster Calculator, they simply would not add. A cryptic failure message shed no light and a successful test of adding just two layers together could not be repeated despite many efforts. After waiting several days for the frustration level to drop, another attempt was made, and was successful -- for 32 layers. But them it quit cooperating. No explanation for it, but anyone wishing to use this spatial diffusion procedure or in any other way put the software through its paces should expect frustrations and delays. Mastering the learning curve will, of course, allay some of these problems.
|
||||||||||||||||||||||||||||||||||||||||||||||||||||||||||||||||||||
|
|
||||||||||||||||||||||||||||||||||||||||||||||||||||||||||||||||||||
|
CONCLUSIONS Land cover is not homogenous. It imposes both barriers and advantages to movement. This has been shown to be the case for mosquito populations, and by inference, the diseases they carry. If the actual land cover types are known, it should be possible to create modeling surfaces that can add further local precision to models based on remote sensing of temperature or green-up or to models derived from interpolations of widely-spaced WNV events seen in the field. At a point in time, the virus occupies a certain space. At a point in the future, it will occupy a different space. Something will account for that difference. The data analyzed here indicates that land cover can account for at least some of that difference. The procedure developed here for predicting the spatial diffusion of West Nile Virus is applicable to many other phenomena that are characterized by spatial diffusion. While tedious as presently implemented, it can be a useful tool when the higher-end capabilities of ArcInfo or other pricier, more-high-powered packages are not available.
|
||||||||||||||||||||||||||||||||||||||||||||||||||||||||||||||||||||
|
REFERENCES Ahearn, Sean and Daniel Markokwski, 2003. Review of 2002 Geographic Data and Modeling, in West Nile Virus: Monitoring, Modeling & Remediation: A GIS Perspective [Streaming Audio]. LinksPoint Online Conference, January 22nd, 2003. Alameda County Mosquito Abatement District. Culex Mosquitoes of California. Alameda County Mosquito Abatement District. Larval Habitats of California Mosquitoes. Beck, Louisa R., n.d. Malaria in Chiapas, Mexico. Global Monitoring and Human Health Program Louisa R. Beck, Bradley M. Lobitz, and Byron L. Wood, 2000. Remote Sensing and Human Health: New Sensors and New Opportunities. Emerging Infectious Diseases Journal, Vol. 6, No. 3, March-April 2000. Bourne, Debra. Mosquito Surveillance for West Nile Virus. In, Managing for West Nile Virus Infection in the USA, Wildlife Information Network. California Department of Water Resources. Land Use Surveys. California Department of Water Resources. California County Land Use Index. California Department of Water Resources. Standard Land Use Legend. California Department of Water Resources, 1994. Ranges of Units of Evapotranspiration of Applied Water. Bulletin 160-93 - The California Water Plan Update. California Pest Management Center, n.d. California Crop Calendars. Western Region Pest Management Center, United States Department of Agriculture, Cooperative State Research, Education and Extension Service. Conrad, Eric R., 2001. Tracking Diseases with GIS. Arc-User, July-September 2001. Crans, Wayne J., 1989. Resting boxes as mosquito surveillance tools. Proceedings of the Eighty-Second Annual Meeting of the New Jersey Mosquito Control Association, Inc. 1989, pp 53-57. Epstein, Paul and Douglas Causey, 2003. West Nile Virus could be "bigger than SARS" in 2003. The Hastings Group. May 14, 2003. Forbes, Michael, 2003. GIS Takes a Bite Out of the West Nile Virus. GeoWorld, March 6, 2003. Johnson, Joshua, Jeffrey D. Hamerlinck and John H. Gillham, 2001. An ArcView-Based Application for the Management of Noxious Weed Species in Wyoming. 21st Annual ESRI International User Conference, July 9-13, 2001. Katz, Marni, 2003. Help take the bite out of West Nile virus: Work with local mosquito-control districts to reduce disease potential. Rice Farming Magazine, May 2003. Lathrop, Hugh D., Branka Lathrop and William K. Reisen, 2002. Nocturnal Microhabitat Distribution of Adult Culex tarsalis (Diptera: Culicidae) Impacts Control Effectiveness. Entomological Society of America Mosquito Trap Depot., n.d. Advertisement: The Mosquito Magnet. Nicholas, Robert, 2003. FishNet (ArcScript downloaded from Esri.com website) Perich, Michael J. and Raquel M. Gleiser, 2003. ‘Operation Mosquito’ Fights Bites. Louisiana Agriculture, Vol. 46, No. 3, Summer 2003. Pesticide Environmental Stewardship Program. Enhanced Wetland Mosquito Control Using GIS Environmental Monitoring. Rathert, Dan, 2003. GridSpot (ArcScript downloaded from Esri.com website) Reisen, W., 1993. The western encephalitis mosquito, Culex tarsalis. Wing Beats, Vol. 4(2):16. Robert, Leon and Penny Masuoka, Don Roberts, Russ Coleman and Richard Kiang . Remote Sensing and GIS Studies of Malaria in Thailand. In, Roberts, Don and Penny Masuoka. Environmental Determinants of Vector-borne Disease. Center for Application of Remote Sensing and GIS in Public Health, Uniformed Services University of the Health Sciences, Bethesda, Maryland. Rogers, David J., Monica F. Myers, Compton J. Tucker, Perry F. Smith, Dennis J. White, P. Bryon Backenson, Millicent Eidson, Laura D. Kramer, Bernhard Bakker and Simon I. Hay, 2002. Predicting the Distribution of West Nile Fever in North America using Satellite Sensor Data. Photogrammetric Engineering & Remote Sensing, Volume 68, Number 2, February 2002. Silveira, Joseph G., 1998. Avian use of vernal pools and implications for conservation practice. In: C.W. Witham, E.T. Bauder, D. Belk, W.R. Ferren Jr., and R. Ornduff (Editors), Ecology, Conservation, and Management of Vernal Pool Ecosystems – Proceedings from a 1996 Conference. California Native Plant Society, Sacramento, CA. 1998. Pg 92-106. Solorzano, Juan Pablo, 2001. Polygon to Centroid 1.1 (ArcScript downloaded from Esri.com website) Theophilades, Constandinos N., Sean C. Ahearn, Sue Grady and Mario Merlino, 2003. Identifying West Nile Virus Risk Areas: The Dynamic Continuous-Area Space-Time System. American Journal of Epidemiology, 2003; 157:843-854. Washino, R. K., and B. L. Wood. n.d. Application of remote sensing to vector arthropod surveillance and control. American Journal of Tropical Medicine and Hygiene. Wood, Byron., n.d. California Rice Field Mosquitoes. Global Monitoring and Human Health Program. Wood, Byron., n.d. Land Use Around Rice Fields within Buffers. Global Monitoring and Human Health Program. Unknown, n.d. Geographic Information Systems and the Monitoring and Prevention of Malaria. Occupational and Environmental Medicine Program. University of Colorado Health Sciences Center. Unknown, n.d. Landscape Epidemiology and RS/GIS. Center for Health Applications of Aerospace Related Technologies, Ecosystem Science and Technology Branch, Earth Science Division, NASA Ames Research Center. Unknown , 2002. NASA researchers developing tools to help track and predict West Nile Virus. Top Story, Goddard Space Flight Center, October 08, 2002. Unknown, 2003. West Nile clobbers Colorado's horses. DVM Newsmagazine, November 10, 2003. |
||||||||||||||||||||||||||||||||||||||||||||||||||||||||||||||||||||
|
APPENDICES Appendix A - Mosquito Potential Index by Land Cover / Covers Buffered for Proximity Analysis |
||||||||||||||||||||||||||||||||||||||||||||||||||||||||||||||||||||
|
ACKNOWLEDGMENTS I wish to acknowledge the California Department of Water Resource's Division of Planning and Local Assistance. DPLA's Land and Water Use Program produces a wealth of cartographic land cover data -- now in digital GIS-compatible form -- that cannot be duplicated elsewhere. I encourage anyone interested in agricultural GIS, remote sensing and land use issues to become familiar with it. |