| Title Exploring the Presence of Filipinos in South Sacramento  | |
|
Author Ronnie I. Caluza American River College, Geography 350: Data Acquisition in GIS; Fall 2003 E-mail: CaluzaR@hotmail.com | |
|
Abstract While most demographic studies on the web analyze large racial and ethnic groups over a wide study area, I chose to explore a subcategory of a racial group over a local area--specifically the Filipino population in South Sacramento. I chose this topic partly because I am Filipino myself and also because so little research has been done on the topic. Using painstakingly gathered census and field data, I mapped the area’s Filipino population and examined my maps for any noteworthy population patterns. As expected, the maps I produced clearly show that Sacramento County’s Filipino population is most prevalent in the South Sacramento area. While more detailed inferences can made from analyzing the maps, these inferences should be used as avenues for further investigation and should not be used as firm conclusions. | |
|
Introduction With the wealth of census data available today the spatial distribution of different races and ethnic groups has been studied by several organizations, including the U.S. Census Bureau itself. While many of these studies are well done, the majority of them are greatly generalized, encompassing a broad area (statewide or nationwide) but rarely targeting a local area. Furthermore, these reports normally study people in broad categories such as racial and ethnic groups (Black, Asian, Hispanic) and rarely show the influence that a subcategory of one of these groups has had over an area. Because studies with such specific parameters are so seldom undertaken, I decided I should give one a try. I chose to examine the presence of Filipinos in Southern Sacramento and the surrounding southern vicinity. According to Census 2000, Filipinos are the second largest Asian group in Sacramento and are the largest Asian group in Elk Grove. Despite being such a large percentage of the Asian population, their presence in these areas is not obvious and is arguably less obvious than that of smaller Asian ethnic groups such as the Koreans, Vietnamese, and Japanese--including in parts of Southern Sacramento and Elk Grove (a region which I will refer to as South Sacramento for simplicity) where most reside. Through internet and field methods, I attempted to gather as much data as I could about the South Sacramento Filipino population in a spatial context in order to examine spatial patterns created by the population. Though there was the chance I’d fail to find any noteworthy patterns I felt that simply attempting to map the South Sacramento Filipino population at all was a worthwhile effort since the population isn’t something that is studied very often. I planned to map the Filipino population by census tract using 1990 and 2000 Census data in order to show the growth of the Filipino community in the South Sacramento region. I also planned to map places catering to the Filipino Community (meeting places, restaurants, other services) by using data I would gather with a GPS receiver. These I searched for based on word of mouth (since I am Filipino myself) and from the business cards of Filipino professionals--these cards can usually be found at Filipino restaurants. I wanted to get a sense of how closely these locations would coincide with the census tracts having the highest percentages of Filipinos in the population. | |
|
Background As mentioned above the Filipino population is a significant percentage of the Asian population in Sacramento and Elk Grove. The table below provides other informative statistics: 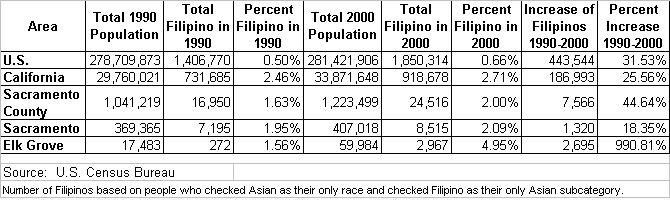 Using internet search methods, I found no previous studies on the presence of Filipinos in South Sacramento. Only the The Electronic Map Library (a collection of maps created by Prof. William Bowen, CSU Northridge Geography Dept.) had a map of Filipinos in the Sacramento Metropolitan Area. However this map was somewhat outdated using 1990 data. It is possible to make a map of Filipino population at the census tract level by using the U.S. Census Bureau’s American Factfinder site. This site makes available immense amounts of Census 2000 data and some 1990 census data. American Factfinder allows you to map many types of data right on the site, although with all the parameters you need to set and all the data you have to choose from, creating the map you want is not easy. However once you get the hang of it, you can make a decent map. I made this map on the site. | |
|
Methods Initially I hoped to make a mini atlas of sorts for South Sacramento’s Filipino Population. I planned to map Filipino population by tract in 1990 and 2000 for comparison and also wanted to map the locations of places associated with the Filipino Community such as community gathering places, restaurants, and other services (cargo delivery, money wiring services, stores selling Filipino groceries, etc). I also considered mapping Filipino Population at the census block level in the tracts with the highest percentages of Filipinos, using aerial photos as the basemaps for these more detailed, larger scale maps. The data acquisition process for this project was done in two phases:
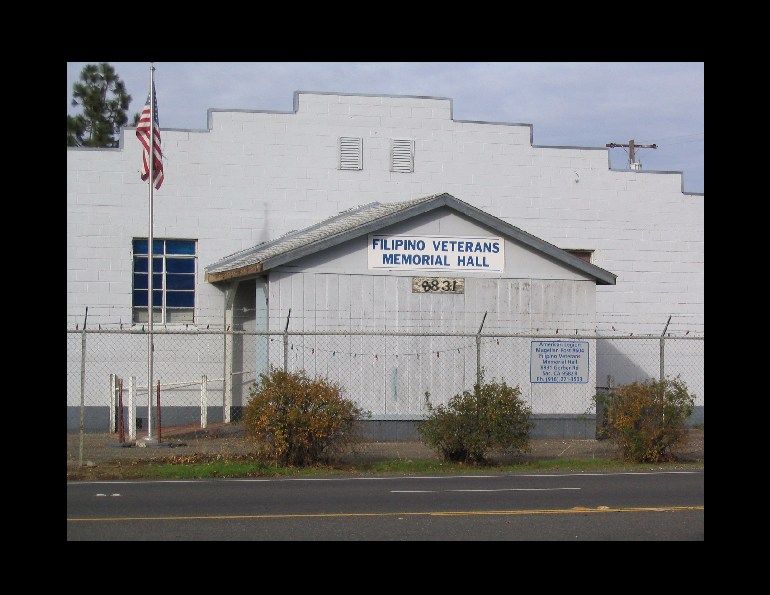
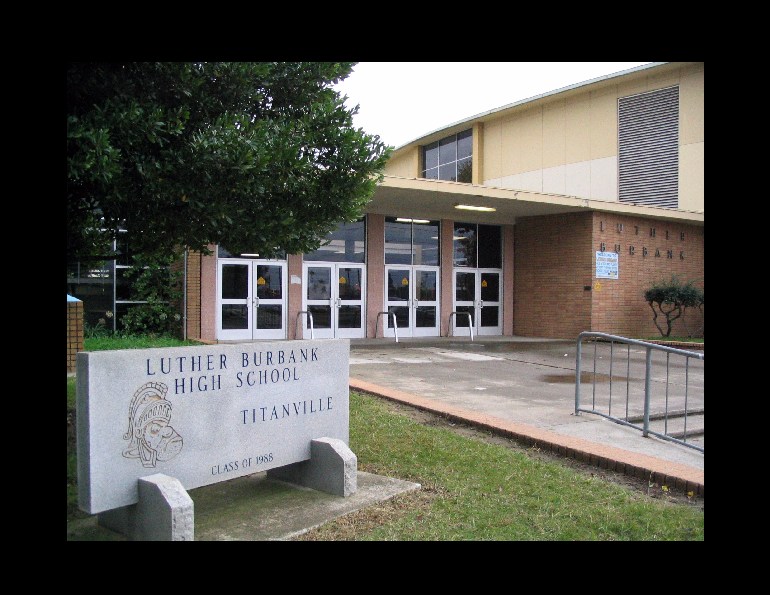
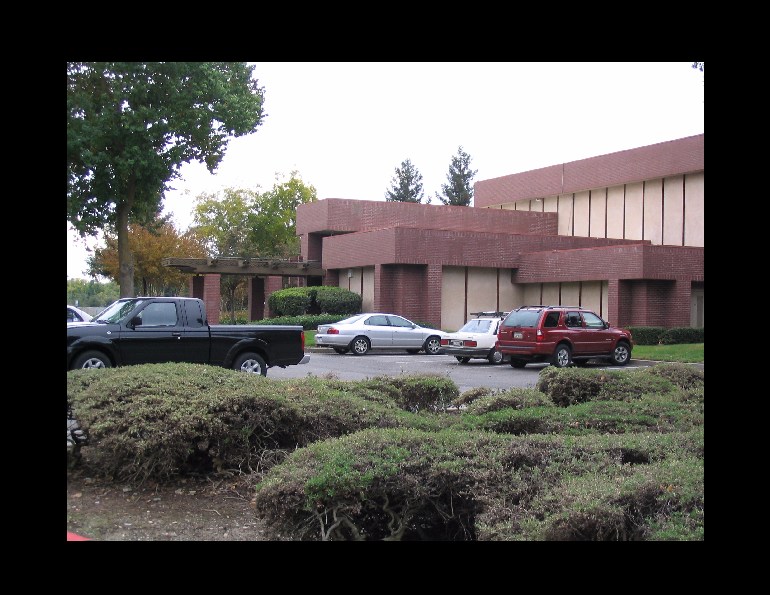
I downloaded a shapefile of California’s major roads/highways from CaSIL. This was a frustrating experience because for the longest time I couldn’t figure out how to georeference the shapefile. After hours of trial and error I realized that I needed to create a new spatial reference system in ArcCatalog based on the information in the prj file. Much data is available from ESRI’s Downloadable Data site which allows you to download Census TIGER files in shapefile format (the U.S. Census Bureau’s site does not have TIGER files in available shapefile format). From this site I collected several Sacramento County shapefiles: the county border, census tracts (1990 and 2000), census blocks, and roads. I also downloaded a Census Tract Demographics table (SF1) that could be joined to the census tracts shapefiles in order to map attribute data. Unfortunately this table lacked racial subcategories and only had the general racial and ethnic categories: Black, White, Asian, Hispanic, etc. I needed to use the U.S. Census Bureau’s American Factfinder site to get the census tract data for racial subcategories. Obtaining this data was a learning process for several reasons. Most significantly, there are so many categories to choose from that finding the one you want and figuring out what’s available is not easy. Furthermore, choosing or customize the table you want involves the use of many dropdown menus (including a couple long ones) in the Census Bureau’s database. Initially I was putting this data into ArcGIS readable format the hard way--I acquired the tabular data by copying and pasting it into an Excel spreadsheet. Then, because this pasted data lacked unique IDs, I proceeded to key in the matching unique IDs as shown in the dbf file of the census tract shapefile I’d obtained from ESRI. Eventually, I figured out a couple ways to make life easier. I realized that I could download my customized table directly from the census site in Excel (.xls) format--much neater than cutting and pasting. This downloaded table still lacked matching unique IDs (a primary key) that would allow for a tabular join. However, once I figured out how to open up the census tracts shapefile’s dbf file in Excel I realized I could copy and paste the column of unique IDs to the downloaded table--easy! Once I finished my tables I saved them in dbf format so that it could be opened in ArcMap. Finally, I had created census tract data tables for 3 categories: people who claimed to be only Filipino in 1990, people who claimed to be only Filipino in 2000, and the 2000 foreign-born population that was born in the Philippines. I could have also used totals for people who claimed to be Filipino in combination with some other category (people of mixed ethnic and racial backgrounds), but I chose not to for simplicity. Data on the subcategories of races was not available at the census block level so I scrapped plans to map Filipino population at the block level in tracts having high percentages of Filipinos. In the second phase of the data acquisition process I drove around South Sacramento with a GPS receiver to mark the locations of places catering to the Filipino community--I also took some digital photographs. Marking waypoints was easy with my Garmin eTrex Legend receiver. Unfortunately I ran into problems when trying to convert my waypoints into a shapefile. I used the CA. Dept. of Fish and Game's "VB Garmin" software that easily converts waypoints to shapefiles when downloading points from Garmin's GPS 12XL (an outdated model). Unfortunately, this software was not compatable with my Garmin eTrex Legend for it would not convert the downloaded points into shapefiles. However, since the software did download and list my waypoints, I was able to transcribe that list and enter it into an Excel spreadsheet which, like the downloaded census tables, could be saved in dbf format. | |
|
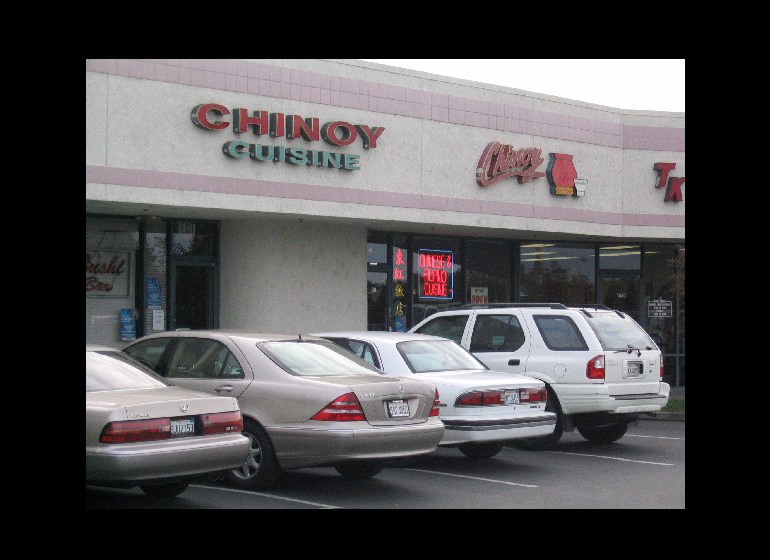
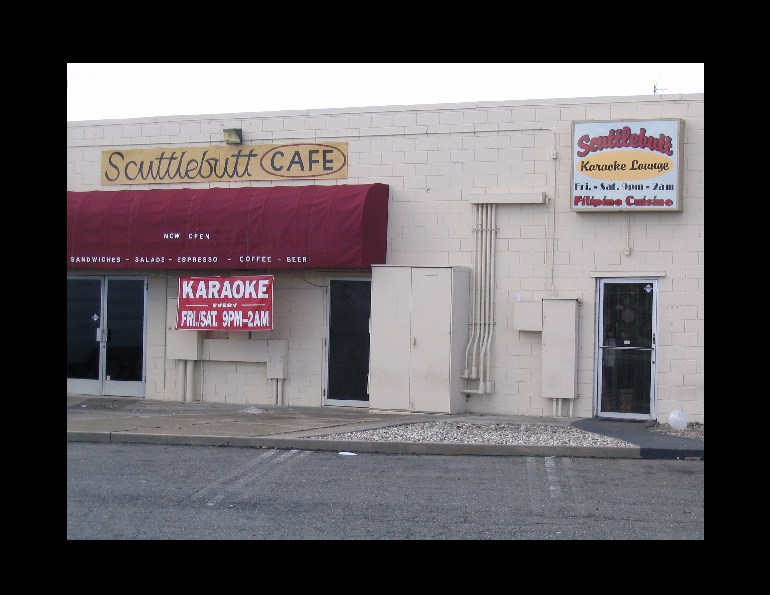
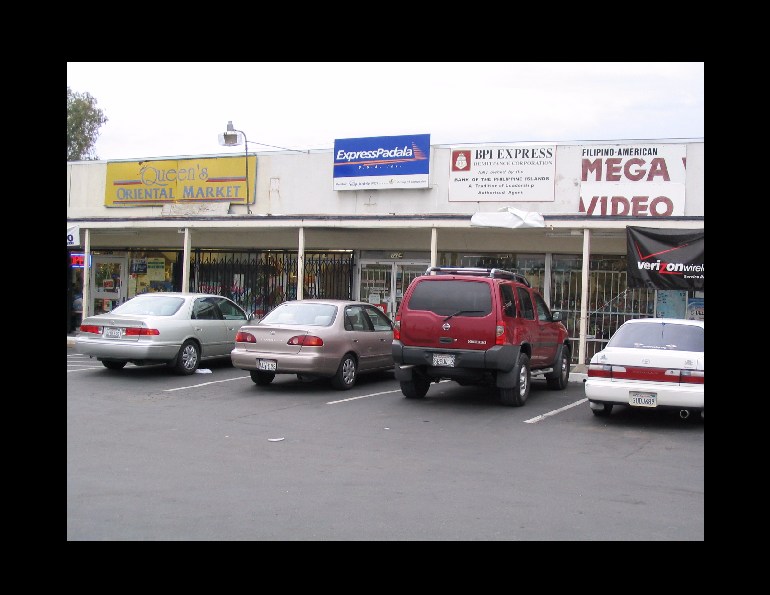
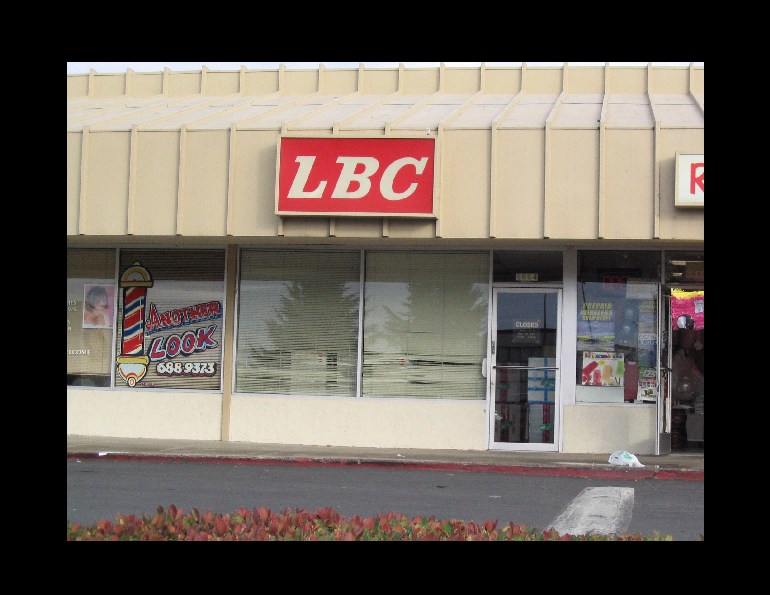
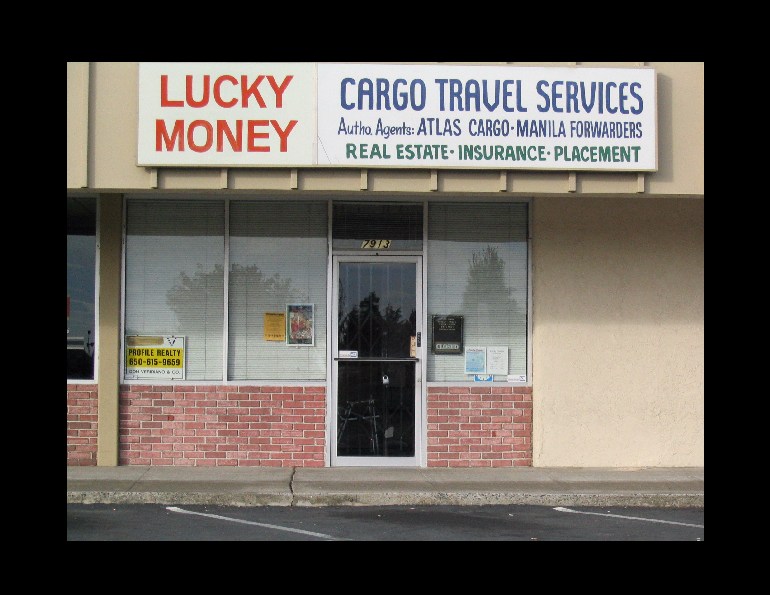
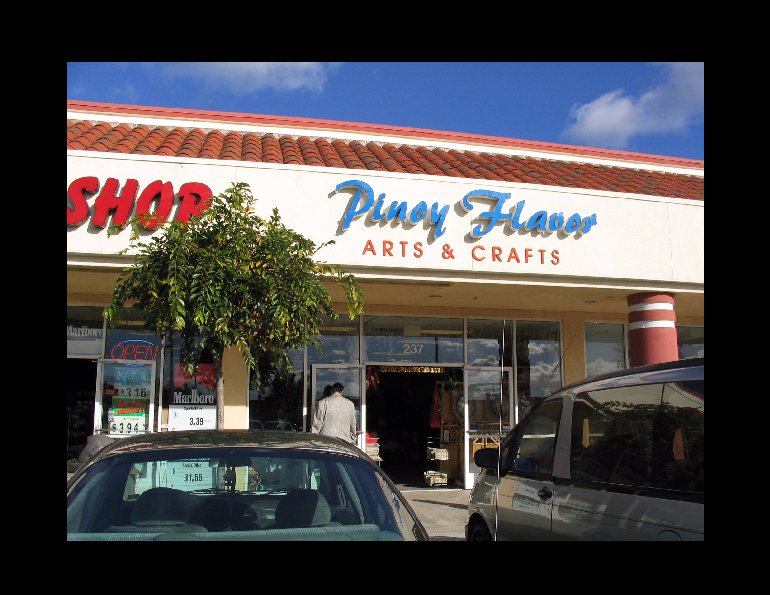
Results For the sake of simplicity I chose to map the census tract data in choropleth format rather than the proportional circle format previously used by Prof. Bowen (mentioned above). In order to make the maps directly comparable I customized the classification scheme so that the break values are the same for all the maps--only the minimum and maximum values vary among the maps.I also included an inset in each map showing the locations of the Filipino places at a larger scale. This gives the map reader a better local perspective of the spatial arrangement of these places, which are sort of bunched together at the scale of the original map. My Filipino Places are as follows:
My 3 resulting maps present similar data but show some variation: 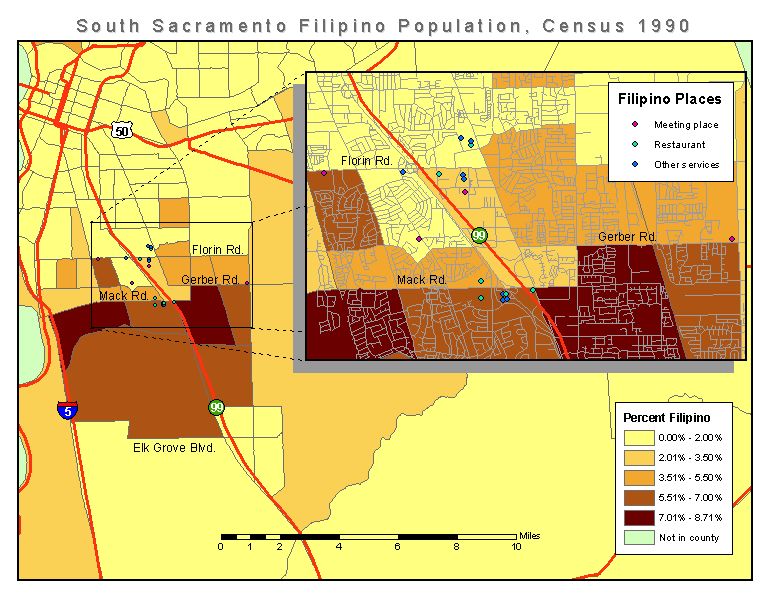 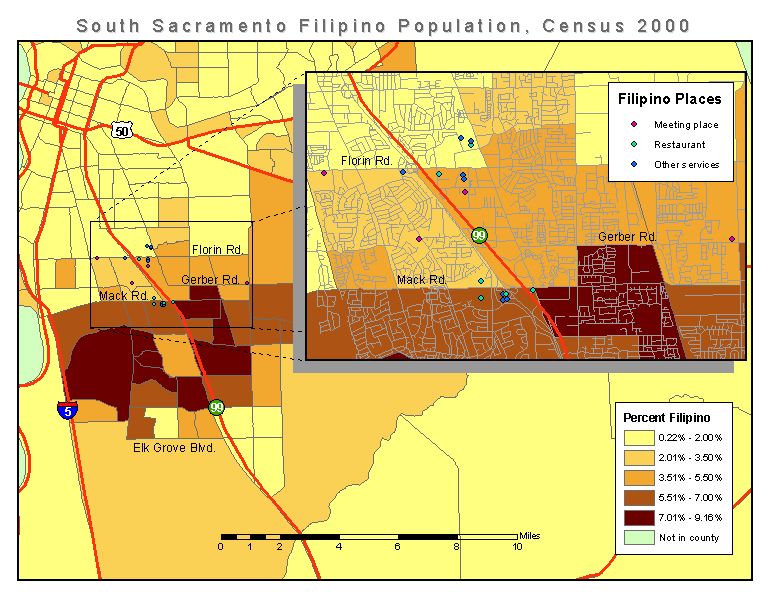 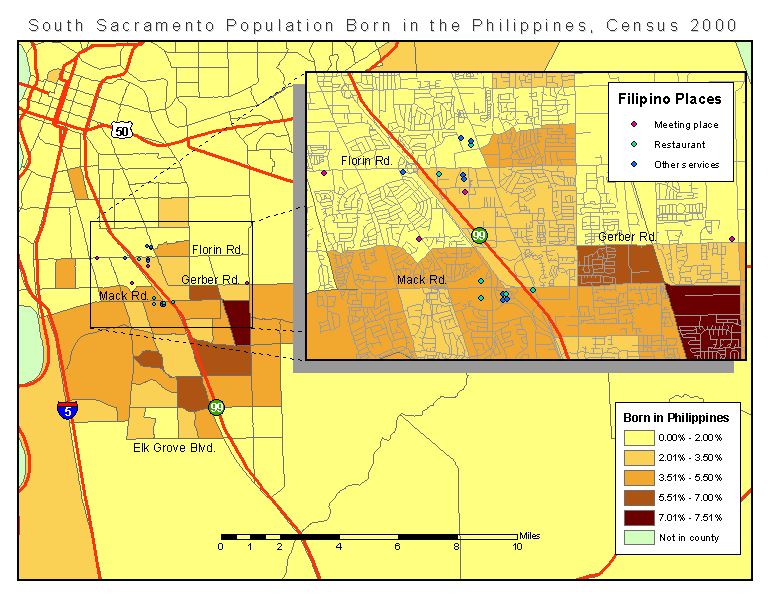 All 3 maps clearly show that the Filipino population has been and still is more prevalent in the South Sacramento than in any other area in the county. It is also obvious when examining the locations of services and meeting places catering to the Filipino community that these locations reflect the presence of Filipinos in the region. Perhaps more interesting to observe are the variations among the maps. When comparing the maps of 1990 and 2000 Filipino population it appears that some tracts have populations comprised of a greater percentage of Filipinos in 2000 than they did in 1990. These differences could be a good example of the growth of the Filipino population as shown by the table above in the Background section. The 1990 and 2000 tracts are somewhat difficult to compare, however, because some of the 1990 tracts have been subdivided in 2000. Still, just by comparing the map legends one can observe that in 2000 there were no tracts in which 0% of the population claimed to be Filipino--back in 1990 there were still some tracts in which 0% of the population claimed to be Filipino. Another noteworthy difference between the maps is that the overall bulk of the Filipino population appears further south in 2000 than in 1990, perhaps indicating that the Filipino population, like much of the county’s population, is moving southward into newer suburbs in outlying areas. From a socioeconomic standpoint, this may indicate that many Filipinos are finding success professionally and are not being left behind in older, blighted parts of South Sacramento. Once again, because of the different census tract borders in 1990 and 2000, it is difficult to assess the overall move of the population based on the maps alone. However, the tabular data in the Background section makes the shift quite clear. The differences between the 2000 map of the Filipino population and the 2000 map of people born in the Philippines are also notable. The shading on the maps is not very similar as the map of people born in the Philippines has considerably fewer darker shaded tracts. This disparity probably indicates that a significant portion of the Filipino population is not comprised of immigrants, but is comprised of the children of Filipino immigrants. Because the tract with the highest percentage is relatively further north in the foreign born map than the general Filipino map, one may also consider the possibility that the foreign born Filipino population may be struggling a little more from a socioeconomic standpoint than the rest of the Filipino population. | |
|
Analysis I feel that the project went well within the parameters of the given time frame and resources. Looking back, I am certain that data from the U.S. Census Bureau was the best available for mapping South Sacramento’s Filipino population. While the Census 2000 data may be considered slightly dated today, as the fringes of South Sacramento are continually and quickly broadening, more recent data from other sources (if available) may not have been reliable for comparison to the older census data since different collection methods may have been used.As mentioned above, I ran into trouble trying to compare 1990 and 2000 tract data because the tract boundaries were not exactly the same in both years. However, while this was problematic for comparison, it was to my advantage that the tracts were smaller because the smaller tracts allowed for more detailed mapping. Perhaps 1990 data more comparable to the 2000 tracts can be compiled by obtaining census block level 1990 data and “dissolving” the blocks (using GIS) into units similar to the 2000 tracts. Block level data is not available from the U.S. Census Bureau’s website, however, so this data would be harder to acquire. I am pleased with the quality of my field data. While I did have to modify the coordinates a bit to make the points appear in the correct locations relative to the streets in TIGER file, the locations were very close even before I edited the coordinates. Probably the biggest criticism of my self-made data is that it is based mainly on the knowledge of myself and my family and that there could be other places significant to the Filipino community that we don’t know about. Still, I feel that my family and I (being Filipino ourselves) have a fairly good sense of places important to the community and that we’ve come up with a good collection of places. | |
|
Conclusions My goal for the project was simply to explore my topic and not so much to make firm conclusions. However, I will definitely state that all my maps clearly show that the majority of Sacramento County’s Filipino population is located in South Sacramento. Other inferences can be made about Sacramento County’s Filipino population by examining the maps more closely, but these inferences should only be used as avenues for further investigation and should not be declared as firm conclusions.To improve upon my results in the future there are many options to consider. As mentioned above it would be nice to find 1990 data that would be more comparable to the 2000 tract data. It may also be interesting to compare the population patterns of the Filipino population to the patterns of other Asian groups or to the Asian population in general. I would also consider performing more sophisticated spatial analyses among the data sets--not just comparing the maps by sight, but actually trying some map algebra operations. Until then, this project has been a worthwhile effort and I am proud to have accomplished it. | |
|
Data Sources
American Factfinder, http://factfinder.census.gov/home/saff/main.html?_lang=en -- The U.S. Census Bureau’s American Factfinder site makes available numerous amounts of data for viewing and for downloading. I obtained census tract attribute data here.CaSIL, http://gis.ca.gov/ -- Like the ESRI site below, The California Spatial Information Library (CaSIL) has a great variety of downloadable shapefiles for California and places within California. I downloaded a California major roads shapefile from the site. The Electronic Map Library, http://geogdata.csun.edu/library.html -- Prof. Bowen’s site has a great assortment of maps available for viewing. This was the only site I found that had a map of Filipino population in the Sacramento area. ESRI’s Downloadable Data site, http://www.esri.com/data/download/index.html -- ESRI’s site has countless shapefiles available for download. I downloaded many shapefiles from this site, most significantly 1990 and 2000 Sacramento County census tracts, and Sacramento County roads. |