The Urban Heat Island | ||
|
Author Larry Doney American River College, Geography 350: Data Acquisition in GIS; Fall 2003 Contact Information l.doney@comcast.net | ||
.jpg) |
||
|
Abstract "The Urban Heat Island". I will explain that the urban heat island is a phenomenon that occurs in cities with big metropolitan areas. I have a profile of a typical rural through metro on into the suburbs illustrating temperature increases and decreases. I will touch on how water needs a vehicle to condense into water and how cloud-condensation nuclei is that vehicle and how that brings a greater frequency of rain, thunderstorms and fog. I will site some unique features of a city and how they all together create a microclimate of their own. I will show that the word "island" comes from isotherms on a map. I explain how evapotranspiration is living plants putting cooling water into the atmosphere. I have satellite photos of three cities and one of the east coast, all illustrating the heat emitted from major cities. It will come to an end with ways we can help reduce the intensity of The Urban Heat Island. | ||
|
Introduction The Urban Heat Island Effect is a phenomona where we see tempretures in metropolitan areas run higher than outlying areas. Increased tempratures in metro areas create many problems with our air quality, our weather, and even our comfort. I have found no evidence in text books or on the Web that concludes that the urban heat island effect contributes to global warming. Ground tempretures, air tempratures, ariel photos, air quality measurements, and many adverse effects to our enviornment and our health. |
Background Most of the data collected here,
including information was found on the World Wide Web. I did do a little
reading from text books. There was just so much information on the web
that I didn't need to go much further. I did researce on this phenomona for a physical geography class and have been intriged by it's causes and it's effects ever sence. |
|
|
Methods Methods used for data collection for this project are ariel photos, text books,and information of the World Wide Web. I learned how to download photos, charts and table information. I am still trying to figure out how to get the info into the software so I can analyze it better. |
||
|
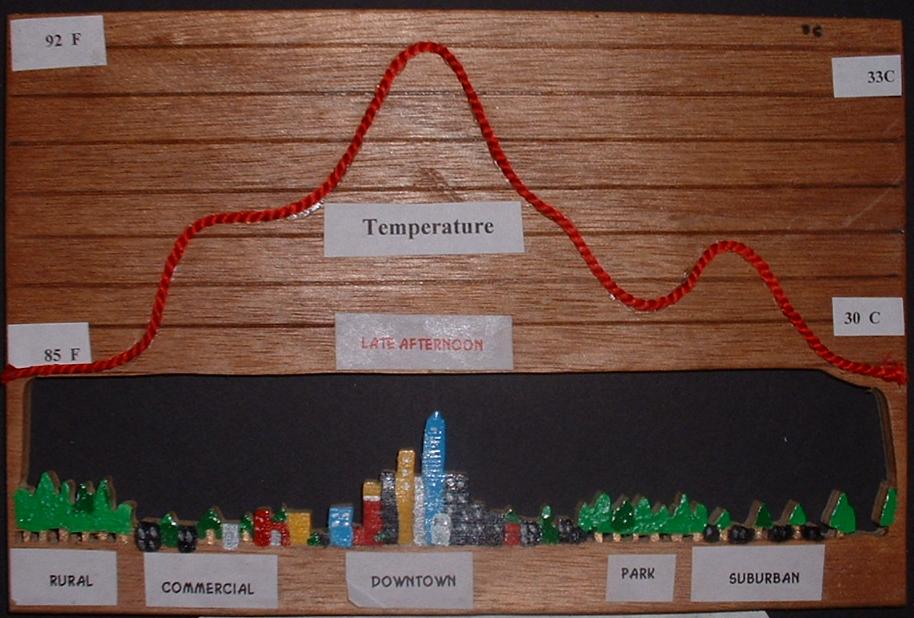
Here is a look at a typical afternoon day in downtown Metropolis.
This profile was designed from a printed profile an the Urban Heat Island Group web page. Urban heat island group Use your browsers BACK button to return to this page. |
Profile
 |
"Isotherms make an island"
Isotherms are "Lines of equal Temperature" on a map.
When isotherms are drawn on a map over a city, the lines of equal temperature, (isotherms) look like islands.
That is where the "ISLAND" part of the term comes from.
|
Origin of the phrase
 |
|
Causes
|
||
|
Yummy!
|
 | |
|
||
|
Condensation Nuclei
More Rain, Thunderstorms, and Fog are found with more frequency in cities, and just downwind of cities, compared to rural areas. "Studies show as much as 10% more rain in cities than the countryside, a 60% greater frequency of fog and 16% greater frequency of thunderstorms".1 Tarbuck & Lutgens, Earth Sciences, 6th edition, 1991 New York
Excess condensation nuclei contributes greatly to this.
What is Condensation Nuclei?
Water does not condense among air molecules alone. It needs a vehicle. This is where cloud-condensation nuclei come in.
Condensation nuclei are microscopic pieces of dust, ash, smoke and particles from burned fuel. Air over land averages "10 billion cloud-condensation nuclei per cubic meter". 1Tarbuck & Lutgens, Earth Sciences, 6th edition, 1991 New York
The air over a city has these nuclei greatly concentrated.
Warm air holds more water than cooler air. City air has more condensation nuclei. Looks like great conditions for more frequency of rain, thunderstorms and fog!
| ||
|
Evapotranspiration
Evapotranspiration is when plants sweat. Simple as that. With a grove of trees cut down and a concrete building put up in it's place, we end up with a building that absorbs and holds heat and fewer trees letting cooling moisture back into the air.
Let's look at the word
Evapotranspiration. This is the water lost to the atmosphere by two processes:
| ||
.jpg) |
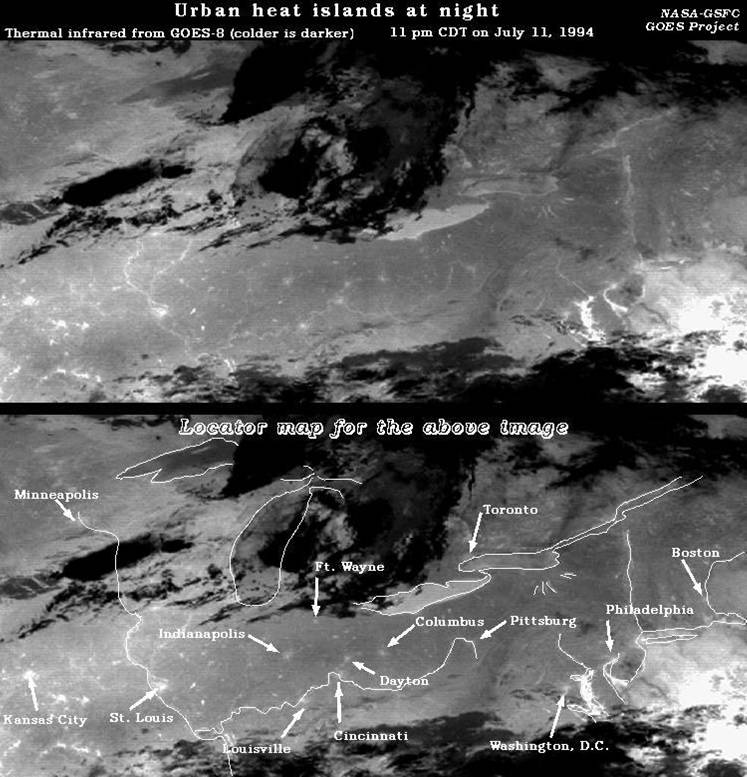
Satillite Evidence |
Nasa provided this satalite photo. It was taked in 1994 on a clear July night. Look at the picture on the left. Look close and you will see some little spots. | The picture on the right is the same picture with the cities labeled. |
| ||
|
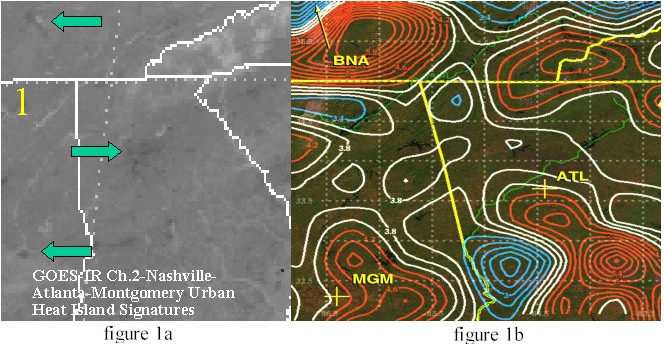
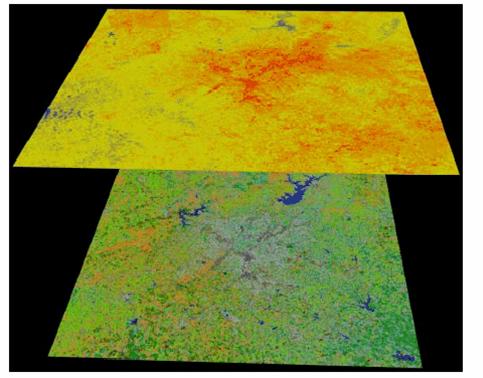
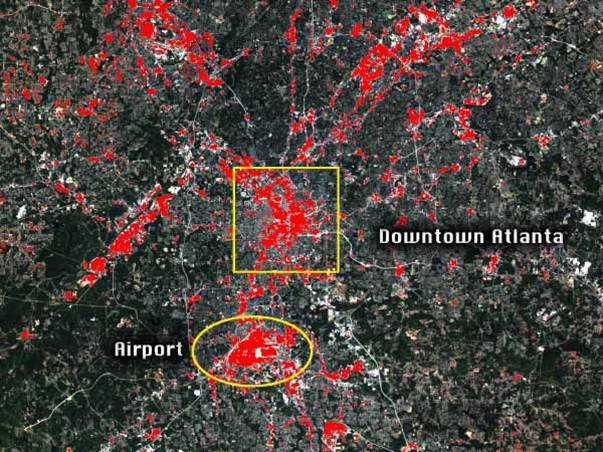
Atlanta Here is a Remote Sensing picture of Atlanta Georgia. The false color image is clear evidence of the cities urban areas being hotter. | ||
 |
 | |
|
Analysis This was a very challenging project. I have gained much knowledge on types of data aquisition. I am still learning how to apply these techniques. What I have learned is that there is a lot to learn. The learning curve is high and I am confident that soon it will all come together. I beleive that this type of technology will chang our world as we know it. I beleive this technology will answer questions to questions we havent even thought of yet. I will stay with it and keep learning different aspects of this sceince and think back and smile at the frustration that I have felt on this project. | ||
|
How can I help?
No one person can bring an end to this phenomenon.
A whole bunch of us can't bring it to an end.
As long as we cut down trees and cover fields with buildings, the urban heat island will always be found.
We can lessen its impact on our environment by doing what we can to lower temperatures in our cities.
| ||
|
References Cloud-Condensation Nuclei Robert W. Christopherson Geosystems fourth edition 1Tarbuck & Lutgens, Earth Sciences, 6th edition, 1991 New York http://www.volvooceanadventure.org/images/28b4aeb73696b0723f865c71991d452e.jpg Evapotranspiration 2Urban heat island group http://eetd.lbl.gov Dr. Folkars Asch, University of Bonn http://www.webref.org/biology/e/evapotranspiration.htm USGS http://geochange.er.usgs.gov Hanson, R.L. 1991 Evapotranspiration and Droughts Lawrence Berkley National Laboratory http://www.lbl.gov/ 3 Profile constructed of a printed illustrated graph Heat island group of Berkley (U.S. Department of Energy) Isotherms 5 The handy geography answer book Matthew T. Rosenberg 7Urban heat island group http://eetd.lbl.gov Pictures: 11Southampton oceanography center Picture: http://www.soc.soton.ac.uk/ Three cities:12 Sacramento, 13 Atlanta, and 14 Tallahassee NASA Goddard Space Flight Center Code 912 Mesoscale atmospheric process branch 15 Downtown Chicago Steve Templeton Weathersavvey.com 16 Satellite photo Penn State University NASA GSFC GOES project Taken 11:00pm CDT July11,1994 17 Isotherms NASA Goddard Space Flight Center Code 912 Mesoscale atmospheric process branch | ||
|
Appendices Material may be included in various appendix sections at the student’s option. | ||