Title Using Geographic Information Systems to Record Archaeological Sites Discovered by Survey Work | ||||||||||||||||||||||||||||||||
|
Author Mike Pesses American River College, Geography 350: Data Acquisition in GIS; Fall 2003 | ||||||||||||||||||||||||||||||||
|
Abstract Archaeological field work can be slow and expensive. With the help of Geographic Information Systems (GIS), I have attempted to improve traditional survey methods. With a commercial handheld Global Positioning System (GPS) device and ArcMap, I was able to record artifacts discovered in the field and study them more effectively back in the lab. The methods used need some refinement, but overall the initial testing was a success. | ||||||||||||||||||||||||||||||||
|
Introduction Initial testing of archaeological projects often requires a pedestrian survey of the area of potential effects (APE). The survey is an attempt to acquire the amount of potential archaeological resources within the project area (Neumann and Sanford, 2001). In an archaeological context, a survey consists of a field technician(s) walking ordered transects along the APE, scanning the ground for artifacts or other ancient human presence. If one artifact is found it is recorded as an isolate. If three or more artifacts are found, they are considered a site and a somewhat elaborate mapping and recording process takes place. Site boundaries are determined, either by dissipation of artifacts or a change in the environment. Recently, my company conducted a survey in the central valley. The crew consisted of me and five other archaeologists, and the gear we had for the job was traditional for the most part. Compasses would tell us which direction to hike, and protractors and map scales would help us construct our site maps. The only modern technology brought was a digital camera and a Garmin GPS unit. The GPS unit was to be used to obtain the Universal Transverse Mercator (UTM) coordinates of a site’s datum and map isolated artifacts. When our crew arrived to the first parcel of the APE, we saw that our job would not be easy. The parcel was an old cotton field, stripped of the crop, but still leveled. The original topography of the land was long destroyed, and the surrounding fields gave us little help. If sites were found, determining their boundaries and constructing the maps would not be easy. The first day of work’s initial artifact density revealed that a large amount of data would be collected. I proposed that we could use geographic information systems (GIS) to effectively map and study the APE. | ||||||||||||||||||||||||||||||||
|
Background GIS has become a useful tool in managing cultural resources. The nature of archaeology is to study humans and societies within their spatial environments. Knowledge of the land and resources surrounding a society is crucial to understanding the society itself (Renfrew and Bahn, 2000). GIS has not been widely addressed in California Archaeology literature. Most of the articles available on the web discuss the three dimensional mapping of Mayan settlements or studying ancient cities in the Near East. I could not find any information using GIS to map Native American sites, nor did I find information on conducting this type of research with a very limited budget. Our company has a GIS department to handle basic cartography tasks. We produce maps of a project’s soil or topography, but GIS is rarely used for analysis. I had wanted to use this technology to make our work easier and to aid in answering questions involving spatial distribution. This project appeared to be an excellent opportunity to use GIS for answers instead of attractive maps. |
||||||||||||||||||||||||||||||||
|
Methods The field work was kept as simple as possible. Every artifact found was recorded as an isolate, unless it was within ten meters of two other artifacts. This kept the crew from spending too much time on defining the sites. UTM coordinates were recorded in addition to the physical attributes of the artifacts. When the data were recorded, the crew moved on. General notes were taken on the landscape for use in any future site records. By using this method, the field work went much quicker than expected. An Excel database was constructed for the project’s GIS (see table). The unique isolate number was the primary key, and columns for the artifact’s type, northing, easting, and material were added for later queries. | ||||||||||||||||||||||||||||||||
| ||||||||||||||||||||||||||||||||
|
The database was converted to a .dbf file and added to ArcMap 8.3, as was a layer for the project area. I created a layer using the artifact UTMs, and then buffered them at ten meters. I located and scanned historic quadrangles for the area and geo-referenced them to their spatial location. The historic maps were drafted in 1911, fortunately before the introduction of cotton farming to our project area. The original topography was easily viewed in the context of the artifacts (see map). This information was then given to the principal investigator (PI) of the project to make the final decision on what would be included as a site. | ||||||||||||||||||||||||||||||||
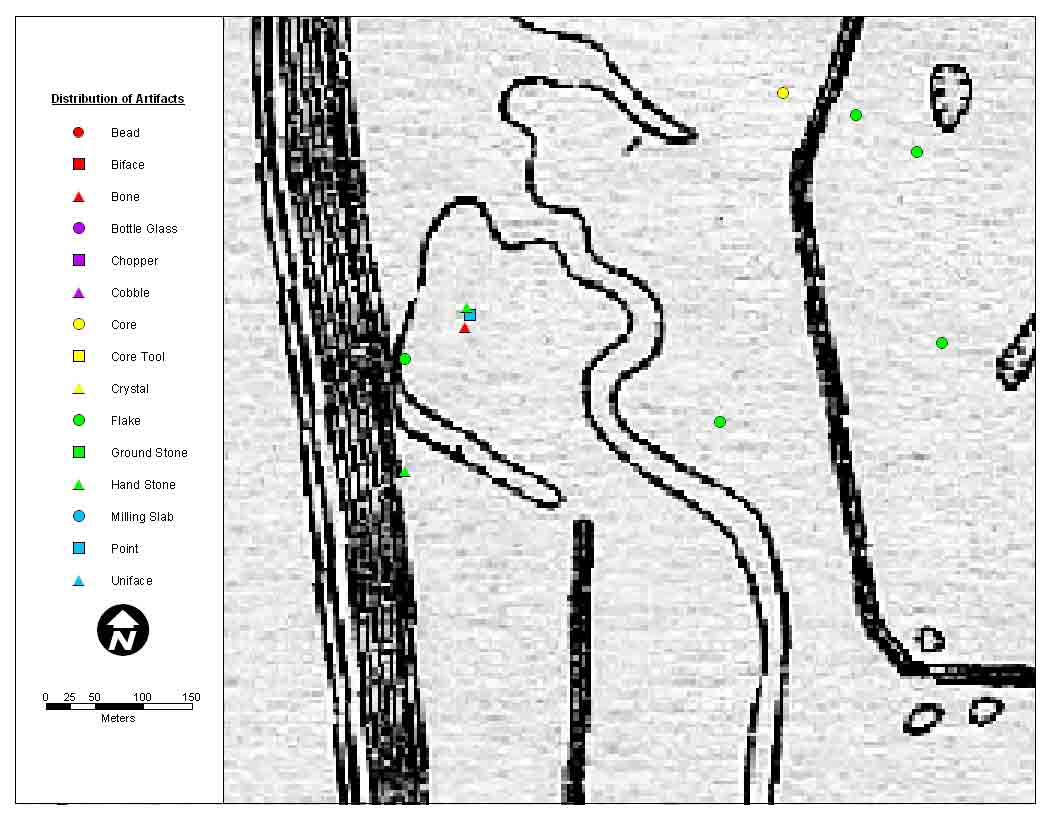 Map of artifacts with historic overlay (spatial information changed to protect cultural resources)
 | ||||||||||||||||||||||||||||||||
|
Results When viewing the data within its spatial context, one previously unnoticed site was found and seven isolates where changed to site artifacts. The ten-meter buffers revealed the unnoticed site. The isolated artifacts were found on two different transects, and their proximity to one another was not recognized in the field. By overlaying the historic quadrangle and the artifacts, the site boundaries became clear. Archaeological sites are often found on high ground and the topographic contours were able to show the original high spots. Artifacts that were within the same general topography were grouped as a site. The PI also was interested in the use of the artifacts that were found and their proximity to one another. Fortunately, I had prepared for this when creating the database. By making columns for different tool types, this took very little time. I ran several queries based upon the use of the tools we had found; was it a hunting tool or a domestic tool? I made a map showing the relationship and gave them to the PI to help with her final report. This cleared up some remaining questions as to which artifact belonged to which site. Once the sites were defined, the database was changed accordingly. Site and artifact numbers were given to the former isolates. Using a personal geodatabase, I was able to create a feature class for site boundaries. When submitting new site records to the Department of Parks and Recreation, a site map is required. With the boundaries and artifacts already made, the maps were easily added to the records. | ||||||||||||||||||||||||||||||||
|
Analysis The methods used in the field were good considering the technology at hand. The Garmin handheld GPS unit was WAAS enabled and relatively accurate, though the information cannot be corrected to achieve sub-meter accuracy. A higher quality device would be better suited for the nature of the analysis we conducted. Fortunately, the level of accuracy did not seem to affect the collected data. A difficulty in the analysis stage had to do with terminology used in the field. A mano is a tool used to grind seeds and grains. This can also be called a hand stone. The only difference between the two terms is regional. Because the crew had been educated in different schools across the country, both terms were used. The field notes were entered exactly as they were written, which made a category for manos and another for hand stones. This made for a busy and misleading legend when displaying the data on the map. Using a data dictionary to define terminology would clear up any of these problems in the future. This would also ensure that all necessary artifact information is brought back to the GIS department. We were able to make intelligent decisions based upon the data collected in the field. Site maps were also easily created. Overall, it was a successful attempt to record the results of an archaeological survey. | ||||||||||||||||||||||||||||||||
|
Conclusions Finally, it should be noted that fieldwork was completed sooner than expected. We had intended to spend fourteen days in the field, but finished in nine. Lodging costs alone were $35 per room for four rooms, or $140 per day. By cutting the field time by five days we saved $700. That amount more than made up for the extra time spent on a database and map. | ||||||||||||||||||||||||||||||||
|
References* Neumann, Thomas W. and Robert M. Sanford. Cultural Resources Archaeology. Alta Mira Press. Walnut Creek, California. 2001 Renfrew, Colin and Paul Bahn. Archaeology: Theories, Methods, and Practice. Third Edition. Thames and Hudson. New York, New York. 2000. *USGS historic and modern 7.5' quadrangles were also used. The reference data has been withheld to protect cultural resources. | ||||||||||||||||||||||||||||||||