|
Title
|
|
|
|
|
|
Author
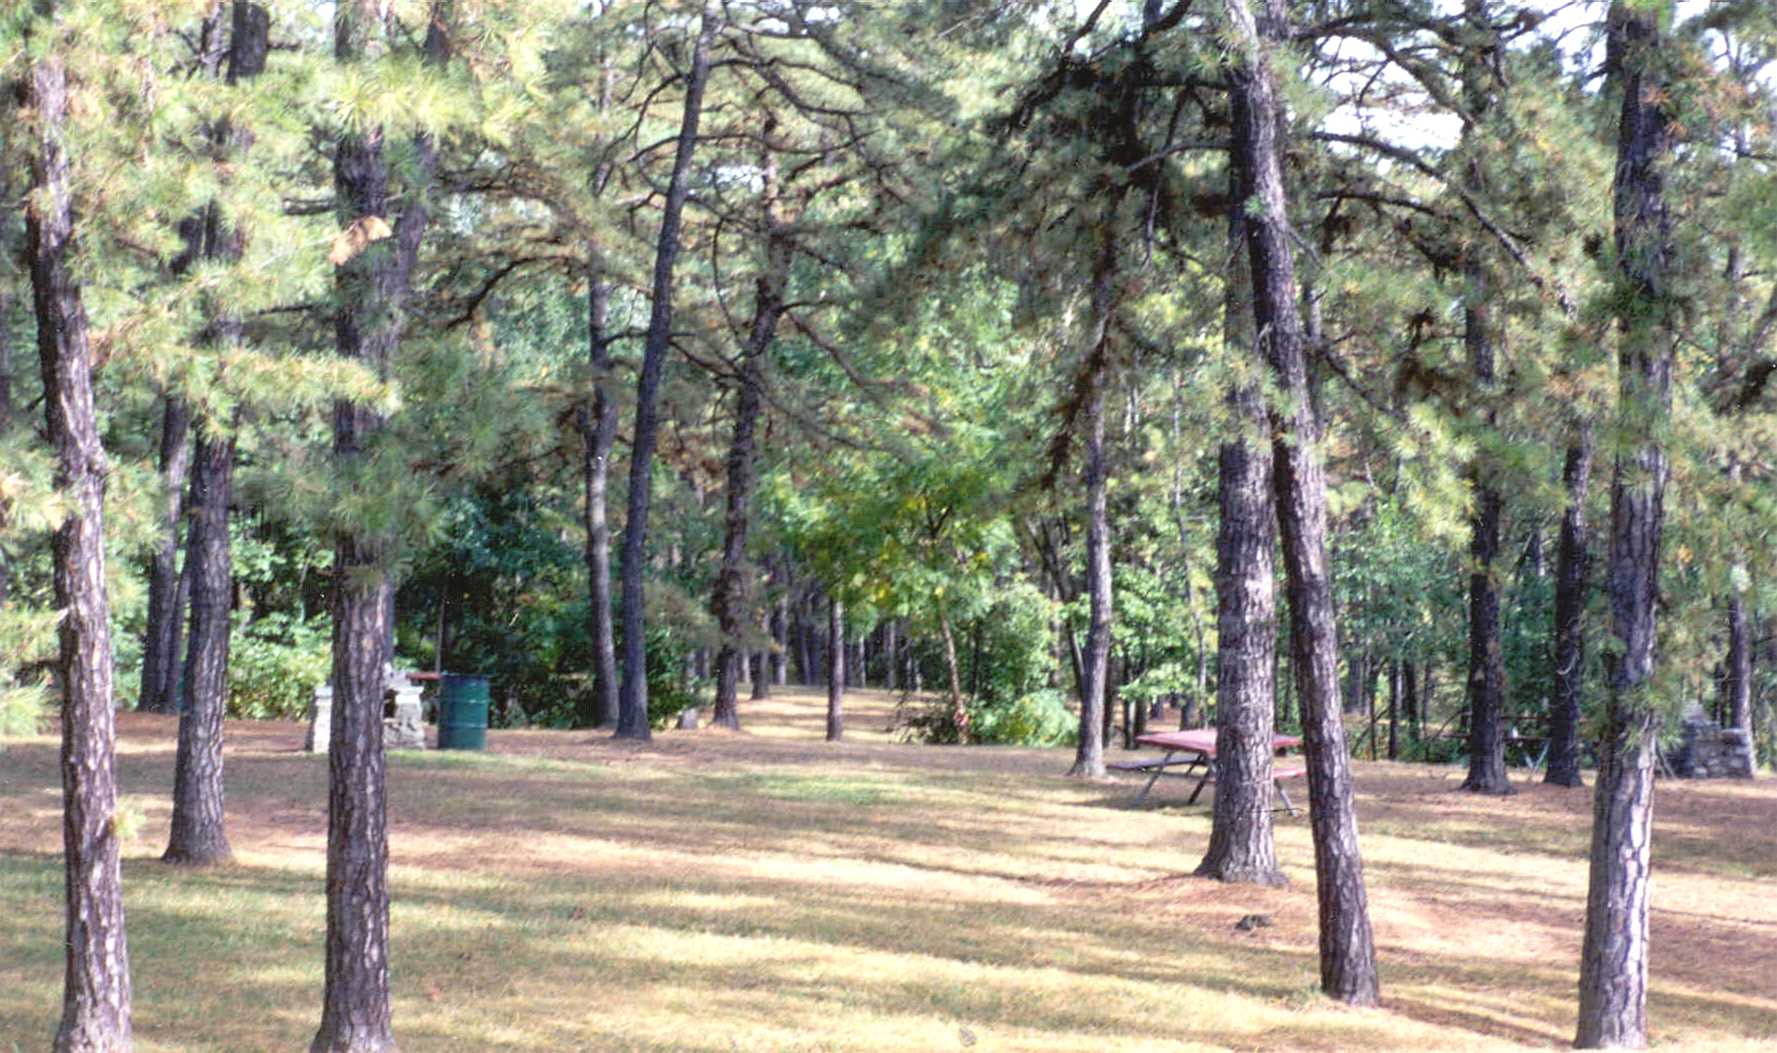
Figure 1 Picture of
Nottingham County Park, located Southwestern Chester County, Pennsylvania |
|
|
|
|
|
|
|
|
|
|
|
|
|
|
|
|
|
|
|
|
2. Distance – I first had to calculate the distance by going to spatial analysis, distance and straight line for each of my five area. Once this process was completed I went to the next step. 2. Reclassifying layers – From this point I reclassified the distance layers that I just create. All of my layers except for the county boundary was converted to raster. I reclassified each layers using five groups of equal intervals. Number 1 being the closest distance and number 5 being the longest distance. 3. Raster Calculator – I than used the raster calculator under spatial analysis to determine which area was best suited for a park. The calculations I used were as follows.
I rated each one in the order of preference. I felt it was necessary to have the park near a wetland to add natural beauty to the area. If the park was near a school this would allow the teachers access to the park for activities for the kids in school or if the school had a day care facility on site it would be really convenient for activities during good weather. I felt it very necessary that this new park be located away from railroad tracks, airports and other parks. The railroad tracks and airport for safety reasons and away from other parks so that a different area of the county can experience the joys of a neighborhood park.
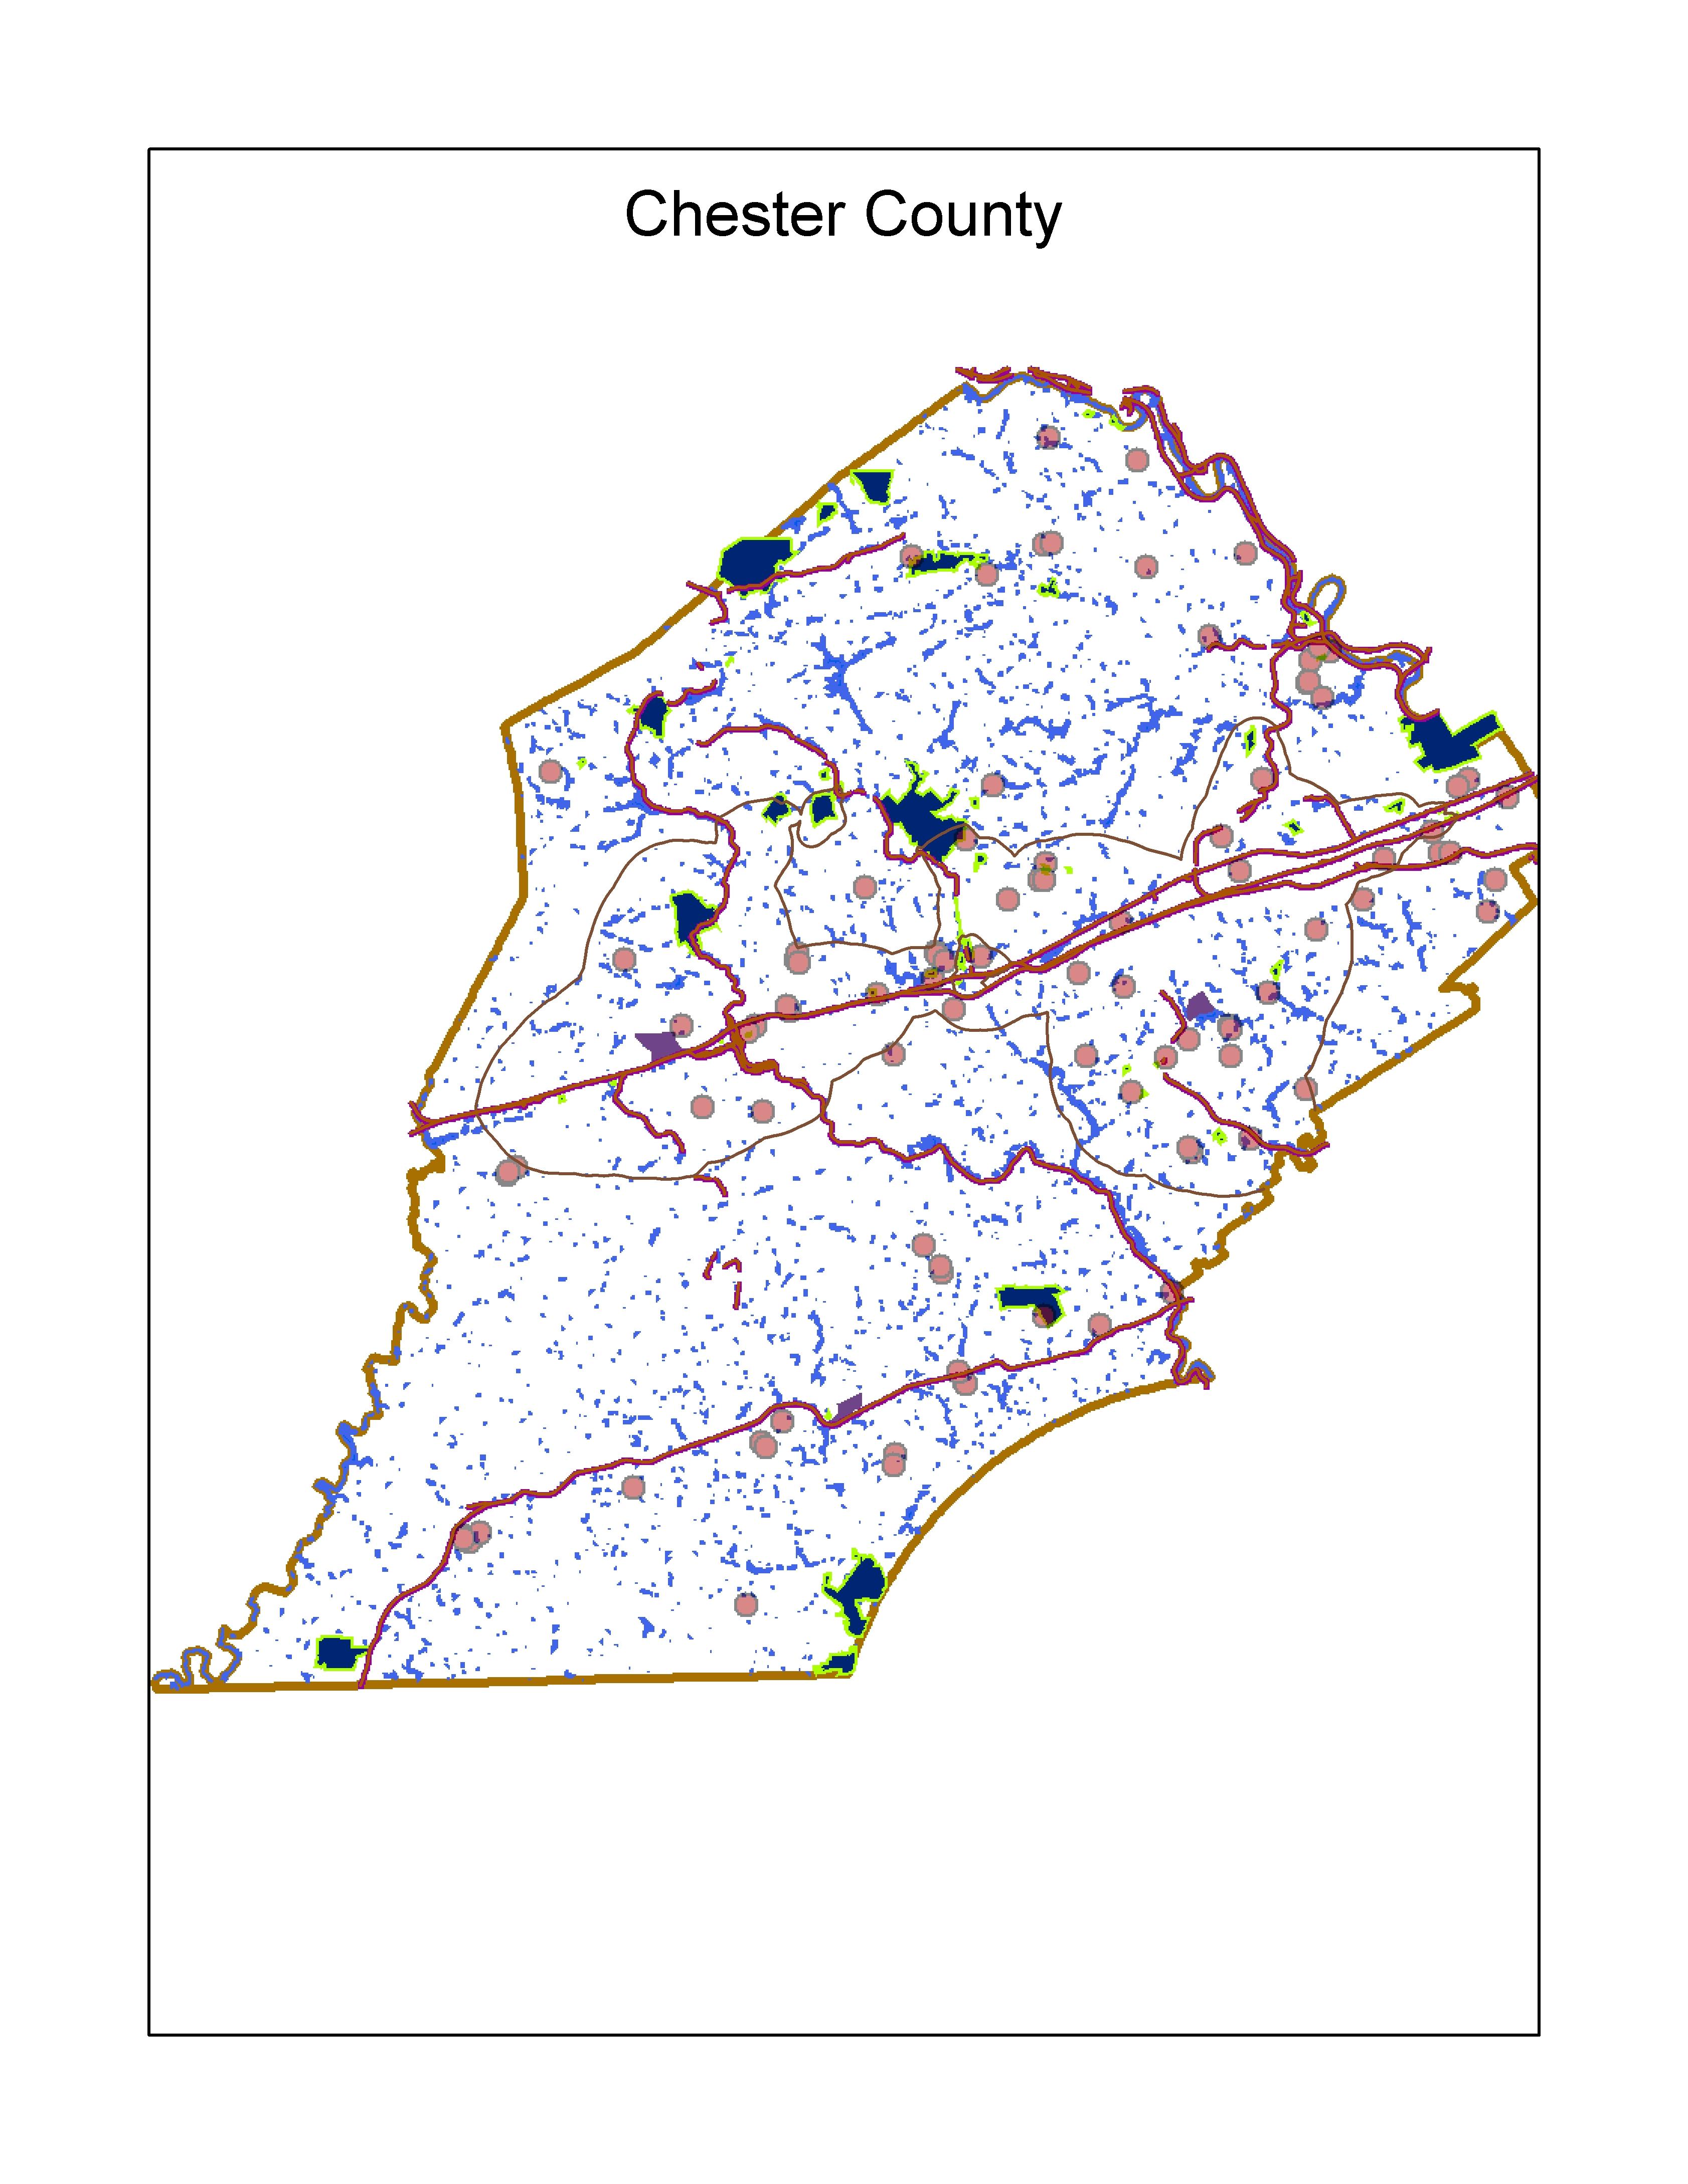
Figure 2 Map of Chester County,
Pennsylvania with all of my layers added.
Parks, schools, railroad tracks, wetlands, and airports |
|
|
|
|
|
Figure 3 illustrates the
results of using the raster calculator in where to locate your new park in
Chester County, Pennsylvania. The
resulting layer gave me several ideas on where a new park can be built in
Chester, Pennsylvania.
|
|
|
|
|
|
|
|
|
|
|
|
I would like to add that this method could be a useful way to illustrate many of the capabilities that ARC GIS can be useful to many federal, state and local government. All of the information is out there for everyone to use and with partnerships like the FGDC more information can become available. There are so many other analysis that can be done by using Spatial Analysis, like tracking poverty level in cities and counties, best place for land development, where to build a shopping mall, where to build housing development, best locations for schools. This is just a handful. Until someone uses ARC GIS they wouldn’t truly under the powerfulness and the capabilities of this program.. It is totally unbelievable what is there and what data is available for the user.
|
|
|
|
|
|
Coverage downloaded from PASDA http://www.pasda.psu.edu/, which is a member of the Federal Geographic Data Committee http://fgdc.er.usgs.gov/. |
|