| Title The Integration of GIS and Satellite Radar (InSAR) | |
|
Author Justin Brandt American River College, Geography 350: Data Acquisition in GIS; Spring 2004 Contact Information (email: jbrandt@usgs.gov) | |
|
DISCLAIMER The findings in this paper are preliminary. Although the research is real, the findings expressed here are not necessarily those of the USGS. This paper is meant primarily to give an application of GIS in scientific research and not to give final scientific results. | |
|
Abstract Satellite based RADAR is a tool that has many uses, many of which have yet to be discovered. Currently, the Water Resources Division of the USGS in Sacramento is focusing on its use in determining ground water pumping induced subsidence/uplift. GIS plays a pivotal role in analyzing this data. The integration of GIS and satellite data allows geologists and hydrologists to analyze the spatial relationships between areas of subsidence/uplift seen in InSAR with groundwater wells. In some studies, continuously operating GPS sites (SCIGN) are also used to evaluate and double check the quality of data seen in InSAR images. | |
|
Introduction This paper deals with the effects of a thirsty society on the earth, specifically how ground water pumping in southern California can lead to subsidence in areas of active pumping. Will densely populated areas be affected by this pumping? How does the Earth react to pumping water? There are several tools available to a geologist or hydrologist to address these questions. Many of these techniques involve arduous and lengthy field studies. However, a tool has recently emerged that is revolutionizing the way this type of study is being done. InSAR, or Interferometric Synthetic Aperture Radar is a relatively new tool that uses space based radar to measure minute changes in ground elevation. But, in order to make sense of technique, extremely fast and powerful computers are needed to process the vast amount of data that the InSAR satellite gathers. The processed data provides computer images that are then imputed into a GIS program, along with roads, cities, and other geographical artifacts for referencing. Many studies include ground water well data and GPS information so that a continuous time series can be modeled; InSAR in only capable of showing an average change over any given time span, whereas well data and GPS can give more accurate short time series events that occur within the time span of the InSAR image. | |
|
Background Before the advent of InSAR, the effects of ground water pumping were either not well understood or entirely undiscovered. In 1992, the European Space agency launched the first satellite of its kind Orbiting at about 800km, this satellite would make a repeat pass over any one area about every 35 days. Known as ERS1, it allowed anyone with access to its databanks the ability to do InSAR research. Five years later, a second satellite, ERS2, was launched into an orbit exactly one day behind its predecessor in order to replace the failing ERS1. For the next several years, up until 2001, this satellite almost continuously collected data, especially over high demand areas such as southern California. Currently, a new multi-use satellite is orbiting the earth in a similar orbit to its two predesessors. Called ENVISAT, this satellite has many uses, one of which is InSAR. The basis behind InSAR is that two radar images are taken on the same spot on the earth, say Edwards Air Force Base in Antelope Valley, southern California. Imbedded in these SAR images is the exact (down to approximately 5-10mm (Ingebritsen et. al. 2000), but sometimes as good as 1mm) distance from the satellite to the ground for every pixel of the image. Each pixel can represent as small as a 10 square meter area of ‘real estate’. In conjunction with a digital elevation model obtained from a USGS website (used for counteracting effects of topography), the two images are differenced (interfered) using powerful computer software. The output is two fold: the change in distance between the two SAR images, but also the amount of signal that is returned to the satellite is also given. Strong signal return is shown as bright colors, where dark colors signify a weak signal. When converted to black and white, this image resembles an air photo, which makes identifying mountains, cities, and other land marks easier. When this image is inputed into a GIS program, it is easy to recognize streets, buildings, and agricultural areas, allowing the proper alignment of the images to be confirmed. | |
|
Methods GIS played a pivotal role in identifying regions of subsidence. After the initial computer processing, .tif files of the images were generated. This format is easily recognized by ESRI’s Arc GIS. In order to correctly georeference these images, however, another file must be generated. A simple text file, known as a tiff world file (or tfw), is generated that tells Arc the latitude/longitude of the upper left-hand corner of the image, and also the exact height and width of the image. These two properties allow the InSAR image to be placed in the correct location on a map. Sometimes, however, there are errors in the tfw file, but using the black and white images as stated earlier makes it easier to allign the images properly. All maps and other GIS data were obtained from an exclusive USGS database called CaGIS (California G.I.S.). A synthetic digital elevation map of the contiguous United States, street map with cities, state borders, lakes, etc…, water well locations, and other various layers and shape files were obtained either from this database or as Excel files of on-going research by fellow USGS employees. The Excel files included GPS and water well locations (latitude/longitude) that were imported into Arc as point and line shape files. |
Results InSAR has been able to identify
numerous regions that have been affected by land subsidence. Specifically,
the Los Angeles Basin is undergoing subsidence due to several causes, most
notably ground water pumping. Other causes do appear, however; geothermal
fields and oil fields tend to return very strong subsidence signal.
Secondary effects of ground water pumping include increased flood risk, as
seen in Santa Clara Country. Oil and gas production in the Houston Texas
area have also lead to increased flood hazards (Jones et. al. 2000). When water well data is used, it shows that there is a direct temporal correlation between pumping seasons and subsidence. Edward’s Air Force Base is an excellent example of this. Using GIS to input the locations of wells adjacent to the base, it is easy to recognize that areas of subsidence occur on or near these wells (figure 1 and figure 2). GPS studies are also able to be used when their locations are imputed into GIS (figure 4). Having a continuous data stream from the GPS sites allows the relationship between the short term seasonal and non-seasonal motion to be compared directly with the ageraged longer term motion seen in InSAR images. Long term, pumping induced subsidence can be confirmed when GPS sites that show similar motions lay on or near areas of subsidence seen by satellite radar. In the Coachella Valley, similar conclusions were made (Sneed, 2002). |
|
Figures and Maps | |
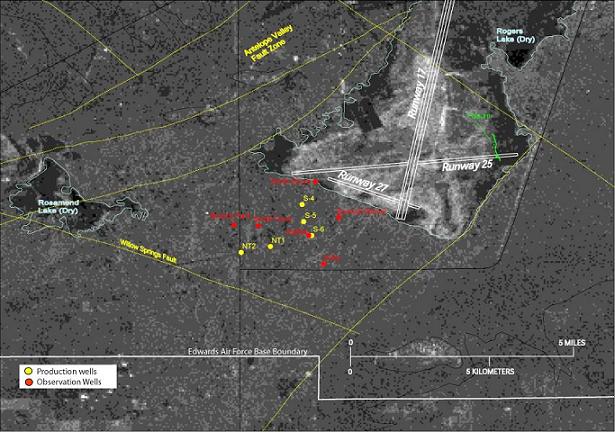
| Figure 1: The production and observation wells can be seen in the form of yellow and red dots just south of the runways. |
|
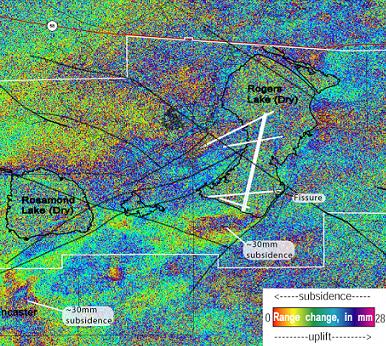
| Figure 2: This shows the InSAR image with an obvious zone of subsidence in the same location as the wells from figure 1. |
|
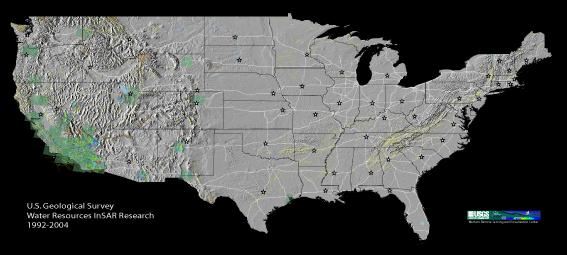
Figure 3: The lack of a projection makes this map
appear odd. Because the InSAR images are .tif files and have to projection, the maps that are used
must also have no projection. |
|

Figure 4: This map shows the spatial relationship between the GPS sites
in southern California and the subsidence found in the InSAR Images. The red dots are the GPS
locations. |
|
|
Analysis Unfortunately, there is a major
problem associated with using GIS to analyze InSAR data. Because .tif images
are the predominate source of data, tiff world files are used exclusively.
In order to orient the images correctly, the length, width, and the location
of only one corner are known. This means that projecting the images onto a
datum is by no means trivial. Not even the GIS ‘guru’ at the USGS at CSU
Sacramento knew how to do it. On small scale maps such as a map showing only
California work okay, but when a map such as the one in figure 3 is made, an
obvious projection error is seen, or the lack of projection error. The unusual
shape of the United States is an artifact of having no projection. | |
|
Conclusions One possibility for correcting
this projection problem is the use of Adobe Photoshop. It may be possible to
warp the image into an approximation of a projected image. This, however,
would only be useful for the manufacture of large scale maps and not for
georeferencing. It is interesting to note that I did not have a problem
inputing other data sets into this map. Arc GIS was able, quite easily, to
‘un-project’ the other coverages so that all data points lined up without a hitch. | |
|
References Bawden, Gerald W. et. al. 2001. Techtonic contraction across Los Angeles after removal of ground water pumping effects. Nature, Vol 412, 23 August: 812-815. Galloway, D.L., Sneed, Michelle, et. al. 2001. Detection and Measurement of Land Subsidence Using Global Positioning System and Interferometric Synthetic Aperture Radar, Coachella Valley, California, 1996-98. U.S. Geological Survey, Water Resources Investigations Report 01-4193. Ingebritsen, S.E. et. al. 2000. Measuring Land Subsidence from Space. USGS Fact sheet-051-00, April 2000. Jones, D.R., et. al. 2000. Land Sibsidence in the United States. USGS Fact sheet-087-00, Decmeber 2000. Sneed, Michelle, Galloway, D. L. 2000. Aquifer-System Compaction and Land Subsidence: Measurements, Analyses, and Simulations—the Holly Site, Edwards Air Force Base, Antelope Valley, California. U.S. Geological Survey, Water Resources Investigations Report 00-4015. Sneed, Michelle et. al. 2002. Detection and Measurement of Land Subsidence Using Global Positioning System and Interferometric Synthetic Aperture Radar, Coachella Valley, California, 1998-2000. U.S. Geological Survey, Water Resources Investigations Report 02-4239. Stork, Sylvia V. et. al. 2003. Detection and Measurement of Land Subsidence Using Interferometric Synthetic Aperture Radar and Global Positioning System, San Bernardino County, Mojave Desert, California. U.S. Geological Survey, Water Resources Investigations Report 03-4015. | |