An Experiment in Utilizing Historic Maps for Archaeological Field Survey: A GIS Approach | |
|
Abstract When utilized with a GIS, Historical Maps become a potentially useful source of information which combined with modern map layers can assist researchers in locating historic features whose whereabouts are presently unknown. This paper presents an attempt to utilize two historical maps in combination with a GIS in order to locate historic structural remains in a former agricultural property. Its primary goal is to access the accuracy of this approach and determine its applicability to historical preservation and archaeology. The result of the process indicated that errors at many levels may effect the accuracy of the results and that care should be taken to verify the quality of the original source data. | |
|
Introduction Although they have different values to different people, by documenting the relative positions of natural and cultural features in both space and time, historical maps provide an intriguing perspective of past landscapes that allows us to comprehend changes manifested in the present. If historic maps are used appropriately, a geographic information system (GIS) can be a valuable tool, allowing researchers to visualize these changes by displaying historical map features against a modern backdrop. This is made possible through a process known as georeferencing, which through user intervention allows historic map images to be referenced to real world locations in a GIS. Besides the obvious implications for landscape analysis research (e.g. Stewart 2001), this type of analysis has proven useful to historic preservationists who wish to locate historic features, places, and events whose present locations are uncertain (Pratt 2002:68). This paper represent an attempt to duplicate this process in order to assess not only the required steps involved, but more importantly the level of accuracy that can be expected. The most prominent question offered was could this type of analysis allow for field identification of historic features and if so, how accurate would the expected locations be to the actual features? In order to address these questions, historical maps of what is now Rossmoor Bar Park in Rancho Cordova, California were used in combination with a GIS to obtain ground positions from which to base field survey. In short, this area situated on the south side of the American River was known for its historic agricultural uses and because evidence of this activity is still apparent, this situation presented an ideal opportunity to test this type of analysis. |
|
Background Some initial detail into the complexities involved in relating old maps to modern digital ones using a GIS were pointed out by Espen Ore in a paper which discussed the results of an architectural history project (Ore 1995:284). As Ore makes apparent, relating information on old maps to those of modern ones can be a complicated process. For example, the author notes that the changes in administrative boundaries can be frequent and these boundaries may |
|
|
be referenced to different coordinate systems than those of modern maps making relations between the two maps difficult (Ibid. 1995: 284-286). This means that using such abstractions as property boundaries to register the locations of historic maps to modern ones would be both difficult and potentially problematic if these boundaries have been significantly altered over the course of history. Road intersections, major stream junctions, or prominent landscape features that are less subject to change present a better alternative and would likely introduce fewer errors into the transformation of the image into real-world coordinate space. In addition, another general caution noted is that historic maps will vary in accuracy depending on the map's intended purpose and the standards under which it was carried out (Harris 1991 cited in Ore 1995:287). While the accuracy of the map is out of the researcher's control, one should be selective of the appropriate map and attempt to obtain detail on the map's intended use and origins whenever possible. |
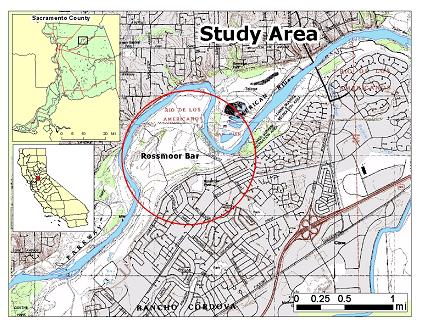 Figure 1. My Study area: Rossmoor Bar in present day Rancho Cordova, CA. |
|
In another article describing an urban landscape change project in Cairo, Dona Stewart (Stewart 2001) assessed the usefulness of GIS software as an analytical tool for landscape analysis. By scanning high-quality historic maps then georeferencing them to modern, high-resolution satellite imagery, the author could make assessments of changes in urban growth and development. Although successful, discrepancies between the georeferenced maps and the satellite imagery was apparent, attributed to both the “difficulties in georeferencing” as well as “the margin of error inherent in all paper maps” (Stewart 2001:370). In his criticism of the accuracy of historic maps, Carr (1962:142) notes that even if initial survey is correct in all its details, the map is still likely to be subject to changes in both temperature and humidity. “Nearly always expansion and contraction occur to a greater extent in one direction than in another, so producing distortion rather than merely a change of scale”(Ibid:142). How much error due to expansion and contraction historic maps is not specified by either author, but in any case, this factor was considered a potential source of error for this experiment. In a third study, historical maps of the city of Ballarat, in southern Australia helped identify the disputed location of a historically significant battleground around what was known as the Eureka Stockade (Harvey 2003:229). However, a lack of clearly recorded features and significant changes in the local topography prevented a historic map of the Eureka area from being georeferenced to modern topographic maps. To overcome this problem, the map had to first be georeferenced to a second historic map that possessed features present on modern vector layers (Harvey 2003:232). Even then, only through an involved process of applying detailed background knowledge of local road alignments and their relation to key topographical features was the author able to get an “accurate registration” enabling the identification of the site's correct location. As in all cases noted above, this study demonstrates that all projects are inherently limited by the accuracy of the data that is available and this mean researchers must be careful when selecting the most appropriate map for their purposes. As Carr (1962:143) notes, “Map evidence is a source of valuable information but it is fallible rather than unequivocal. Any individual sheet should be judged on its own merits for its mere existence is no guide whatever to its value.” |
|
|
Methods After having decided on a study area, next step was to acquire a historic map of the Rossmoor Bar area that depicted historic features which might be possible to identify on ground using a GPS. These included features such as historic buildings, roads, irrigation canals, and fence lines. This map should also contain enough clearly identified existing features to allow it to be georeferenced to known locations. The Sacramento Archives & Museum Collection Center (SAMCC) houses a large collection of city archive material, including a substantial collection of historic maps from the Sacramento area. With the help of the SAMCC archivists and through an exhaustive process of searching through a number of maps of various purposes, ages, and scales, two maps that were deemed useful for the project were located. The first was a topographic map originally produced in 1920 that depicted the tract of land owned by Robert E. Shields (Oliver 1920). The map was a at scale of 1:2400 and included the property boundary, an access road in addition to buildings on the property, the remains of which might be possible to identify in the field. |
|
However, one apparent limitation with this map was there did not appear to be any modern features that could be identified precisely on more recent maps of the area. This situation was similar to that encountered by Harvey (2003) noted above. However, further searching identified a map produced in 1907 by the Army Corps of Engineers, which was at a smaller scale and included not only land parcels around the American River, but also many roads which could easily be identified on modern maps (California Debris Commission 1907). The common element between the two maps was the parcel boundary for land owned by Robert E. Shields. Although it was realized that using this boundary may introduce unknown errors into the process, at this point, using a georeferenced version of the Debris Commission map as a reference layer to base the location of the Shields map seemed to present the only option. To acquire digital copies of the images, a 6-mega pixel digital camera was used. At its highest resolution, the 42x56'' Debris Commission map was captured by 3040 x 4048 pixels, resulting in an image with approximately 72 pixels/inch, while the Shields map at 29x34''could be captured at a resolution of approximately 110 pixels/inch. |
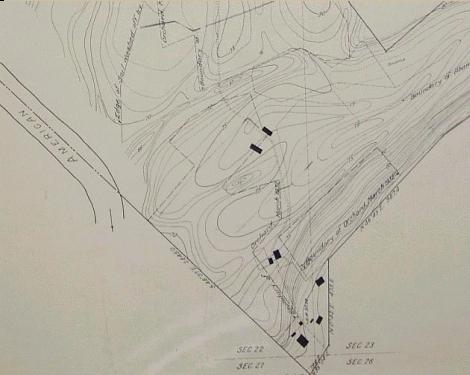 Figure 2: Detail of 1920 Shields Tract map depicting buildings and access roads. |
This resolution is significantly smaller than the maximum resolution of map images obtained for the David Rumsey Historical Map Collection which reached a high around 300 pixels per inch allowing all detail of the original map to be seen captured in the image (Pratt 2002:68). However, even at this resolution, one could still zoom into the map to distinguish lines and read all but the finest text and these qualities were deemed sufficient for the purposes of this project. Images were then uploaded into the computer and cropped using Adobe Photoshop software, after which they were brought into a GIS in the .jpg format for georeferencing to real world coordinates. When an image is georeferenced, locations on the map image known as ground control points that correspond with points at known locations on the Earth are referenced to each other to create what is known as a link. Links allow the image to be shifted, stretched and skewed so that it fits the selected locations on the surface of the Earth. The first link is known as translation and establishes the shift of the x and/or y origins of the image to match the ground location for the chosen pixel on the map image (Verbyla and Chang 1997:162). The second link adjusts both the rotation of the image so that it is oriented correctly, and the scale of the image by expanding or reducing the x and/or y dimensions so that now both control points on the map are positioned relative to the Earth's surface. The third necessary link adjusts the skew of the image by stretching the image so that now all three control points on the image match their corresponding control point on the ground. After enough additional links have been established to account for possible errors in the selection of control points, the georeferencing process is completed. This process is know as an affine transformation and produces a “world file” companion to the image file with the .aux extension. This file contains the necessary positional and transformation information that the GIS software uses to locate the image in world coordinates. For this project, a USGS digital raster graphic (DRG)—a scanned topographic map which has been georeferenced to ground coordinates— was considered the most effective means of obtaining suitable ground control points. When compared to a Digital Line Graph (DLG) of roads obtained from the California's Spatial Information Library, a better location correspondence between the DRG and the map image was observed due to the generalized nature of the lines on the DLG. In order to get coverage of the area represented on the map Debris Commission map, 14 DRGs were downloaded from the Microsoft Terraserver web site. One initial problem that was encountered was that supplemental information on the images is not provided by the Terraserver web site and the since the margins of the original scanned map have been clipped, it is difficult to tell what datum the DRG is in. This problem exist because while some of the original topographic maps that were scanned to make a DRG were in the NAD 27 datum, more recent maps were based on a NAD 83 datum. All USGS DRGs are referenced to the datum of the source map, so if the scanned map was published using a datum of NAD 27 the DRG for this map will also be referenced to NAD 27 (McCartney 2004 personal communication). Without verification on the datum source however, the images therefore needed to be checked against another data source so that spatial reference of the historic map images would be known. To verify this, a USGS digital orthophoto (DOQ) was also downloaded from the Terraserver site for use as a comparison since these images are consistently georeferenced to the NAD 83 datum. Overlaying this image showed a fit verifying that yes; the DRGs that I had obtained were referenced to NAD 83. At this point the historic map images were ready to be georeferenced to the DRGs. |
|
|
Results
Using ArcGIS 8.3 software, the first step was to georeference the smaller scale 1907 Debris Commission Map. By setting the historic map image to 15% transparent and toggling the layer on and off to check the DRG underneath the image, selecting control points was fairly straightforward. One problem encountered however was in selecting control points in the portion of the image around Rossmoor Bar and North of the American River where little detail on the development (if any) was indicated on the map. Despite this limitation, due to the close association between the historic map and the DRG, most control points could be selected accurately for a total of 9 links distributed throughout the greater portion of the image. Unfortunately the link with the highest error (23m) was in the center of the image at the closest possible link point to the Rossmoor Bar area. After the georeferencing process was completed the road shape file and a hydrology layer which included the American River was overlaid onto the historic map to check for registration accuracy (figure 3). |
|
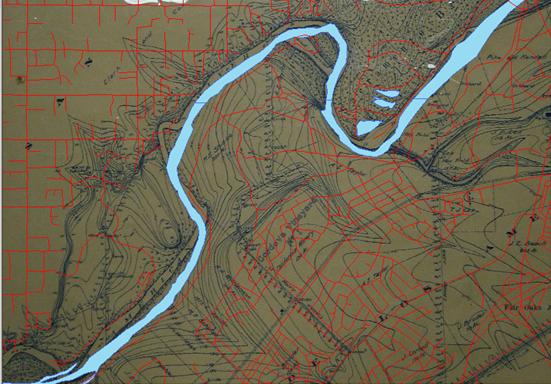 Figure 3: 1907 Portion of California Debris Commission Map displayed with modern hydrology and road layers. Shields' Ranch is Located near the center of the image. |
Analysis of this overlay showed a slight discrepancy between the image and the road shapefile. Near the center of the image, roads on the historic map differed in location from the road shapefile by up to 35m and this distance appears to increase near the edges of the map. This discrepancy could be due to the lack of control points that were possible throughout the upper left portion of the image, a poorly selected control point, or possibly an inability of the affine transformation to account for the distortion in the map image. With regards to the latter, it is entirely a possibility that as mentioned above, expansion and contraction of the map may have occurred making the map scale inconsistent across the map sheet. A second discrepancy apparent on the map is in the changes in the channel of the American River. However, until the establishment of the Folsom Dam in 1955, alterations in the river channel would be expected and can be explained as an artifact of river cut bank erosion, alluvial deposition, as well as the dredging activities that continued on the river until the 1960s (Dillinger 1991:62). The combination of these |
|
two layers therefore presents an interesting look at the history of geomorphology of the American River channel. With the Debris Commission Map now georeferenced to world coordinate space, the second step was to georeference the 1920 Shields topographic map using the parcel boundary present on both maps. This was completed with the establishment of 6 links on property corners of the Shields Ranch. Despite the fact that these parcel boundaries seemed to change in the 13 years that separates the two maps, the iterative process of georeferencing with ArcMapTM allowed for the removal of control points that appeared to be erroneous. This allowed only those property corner points that were common to both maps to be used in the transformation model. The result of this process produced a seemingly accurate registration between the two maps as evidenced by a the property boundary on the western edge of Shield's Ranch which matched a surveyed line on the 1907 Debris Commission map (figure 4). This result was promising and seemed to verify an accurate registration between the two historic maps despite the use of the property boundary as a means of relating the two. As on the Debris Commission Map, the location for the American River channel of the Shields map differed from that of the hydrology layer, but again this might be explained as an artifact of geomorphic change in the river course over time. |
|
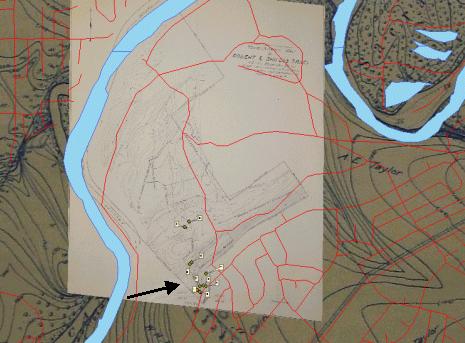 Figure 4: Result of georeferencing the 1920 Shield's Topographic map with the 1907 California Debris Commission map. Note matching property boundary on the southwest portion of the Shields Tract map. |
With the Shields map now georeferenced to the UTM projection, points were digitized on the map that corresponded to the locations of the building features. At each point UTM coordinates were collected and entered into a hand held GarminTM global positioning system (GPS). |
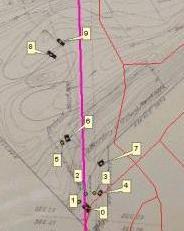 Figure 5: Detail of GPS waypoints digitized on top of Shields Ranch buildings |
|
|
Then using the GPS, these locations were accessed in the field in an attempt to locate the remains of the historic structures. Historic debris found that seemed to indicate occupation or farming related activities were then marked as a waypoint in the receiver and photographs were taken if the feature was deemed significant. Based on the GPS readings, a number of potential structures (n = 6 points 0,1,2,3,4, and 7 in figure 5) appeared to be located on the now occupied residential properties located on Ambassador road adjacent to Rossmoor Bar park. For example, Building 7 in figure 5 was suggested to be located between 10 and 15 meters south of the park boundary in private property according the GPS readings. If these positions are correct, there is likely to be little evidence of structural remains on private property even if the locations could be legitimately accessed. However, running roughly perpendicular to Ambassador Drive and adjacent to the property boundaries, a brief survey of the 15m wide terrace produced a number of pieces of historic debris. These included sections of metal stovepipe, thick steel drainpipe, and other debris such as old wire fencing and pieces of concrete, all of which could easily be associated with historic dwellings. |
|
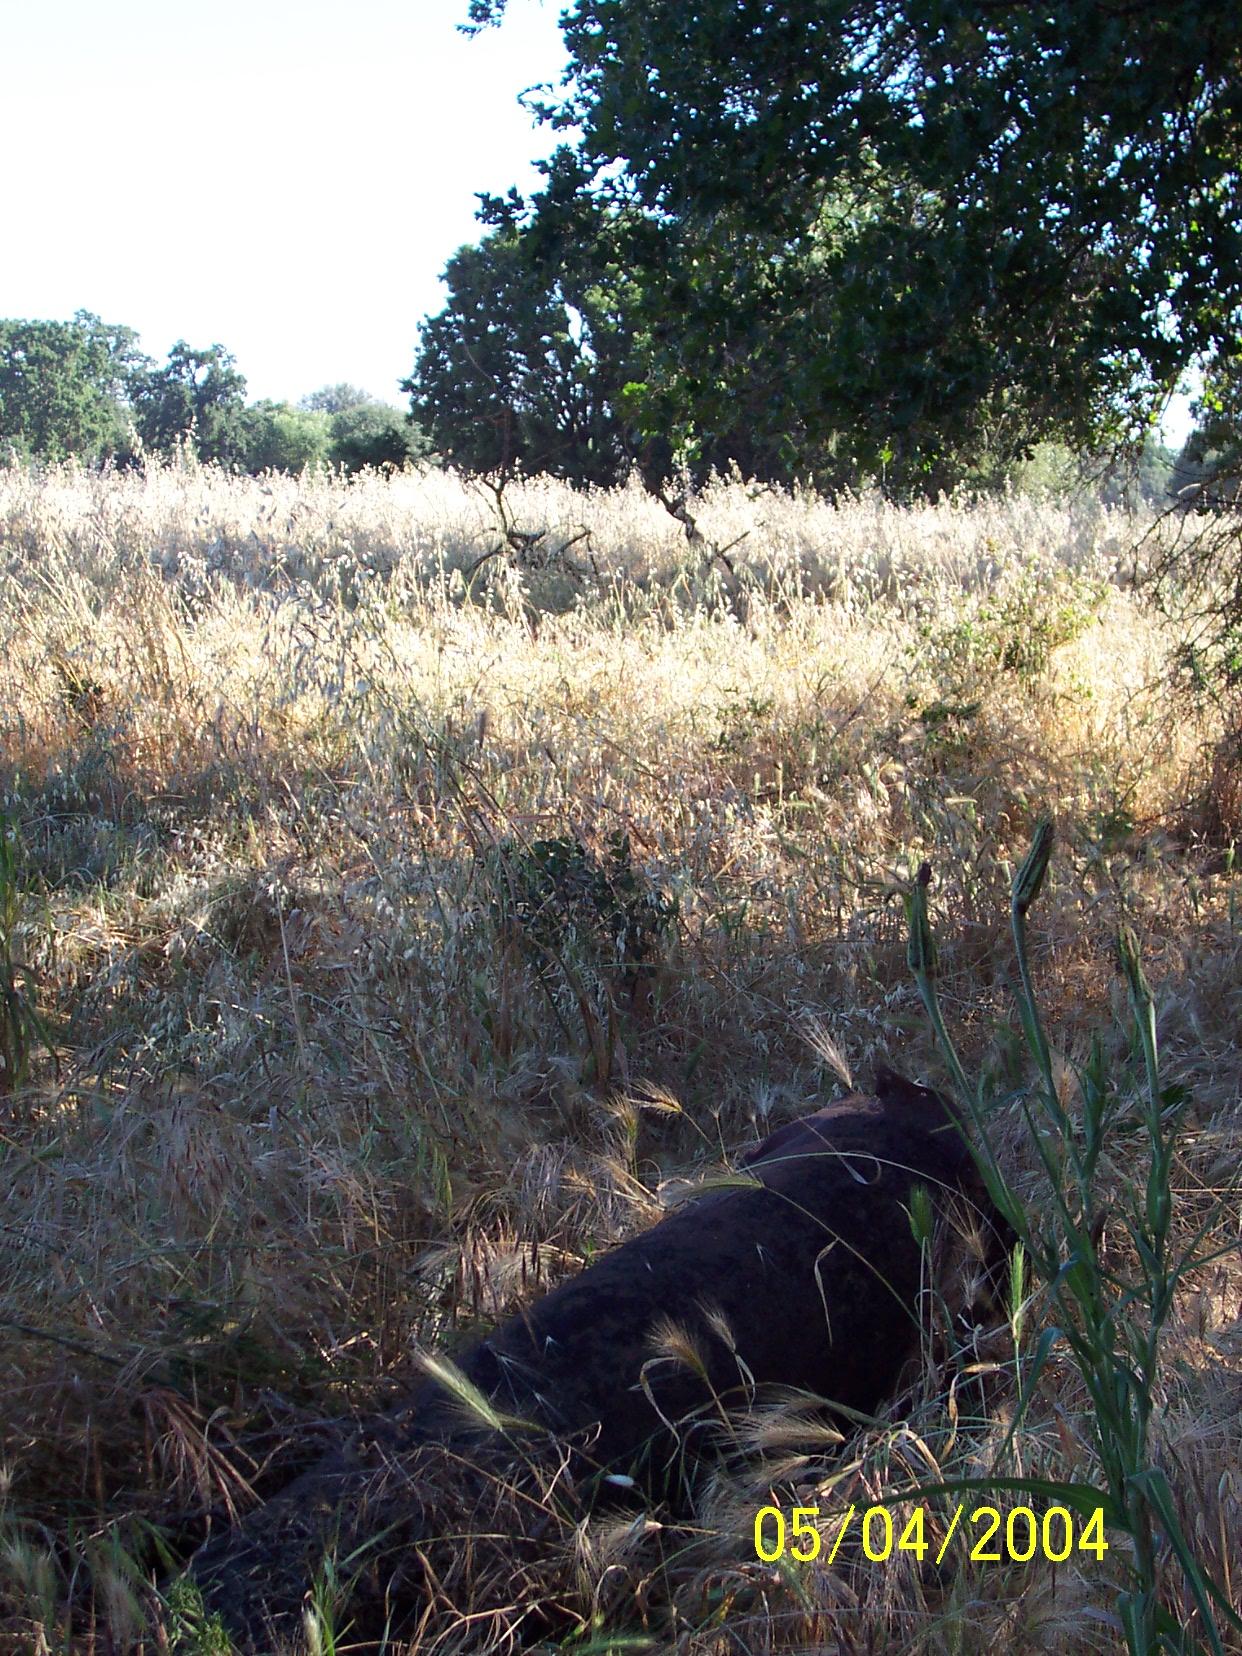 Figure 6: Section of stove pipe found northwest of GPS location for building 7 on the southern border of Rossmoor Bar. |
Buildings 5 and 6 (see figure 5) were located to the northwest and down slope from the terrace in a low ephemeral marsh just north of the dirt access road in the area. Again a brief survey did not turn up any historic structural remains which is not surprising since this area seems like a poor choice for a dwelling location. However, just north of this location a series of cobble piles oriented to the northeast and marked with metal fence posts. This feature may have been the boundary of one of many orchards in the Shields Ranch area. Robert's mother Elizabeth Shields |
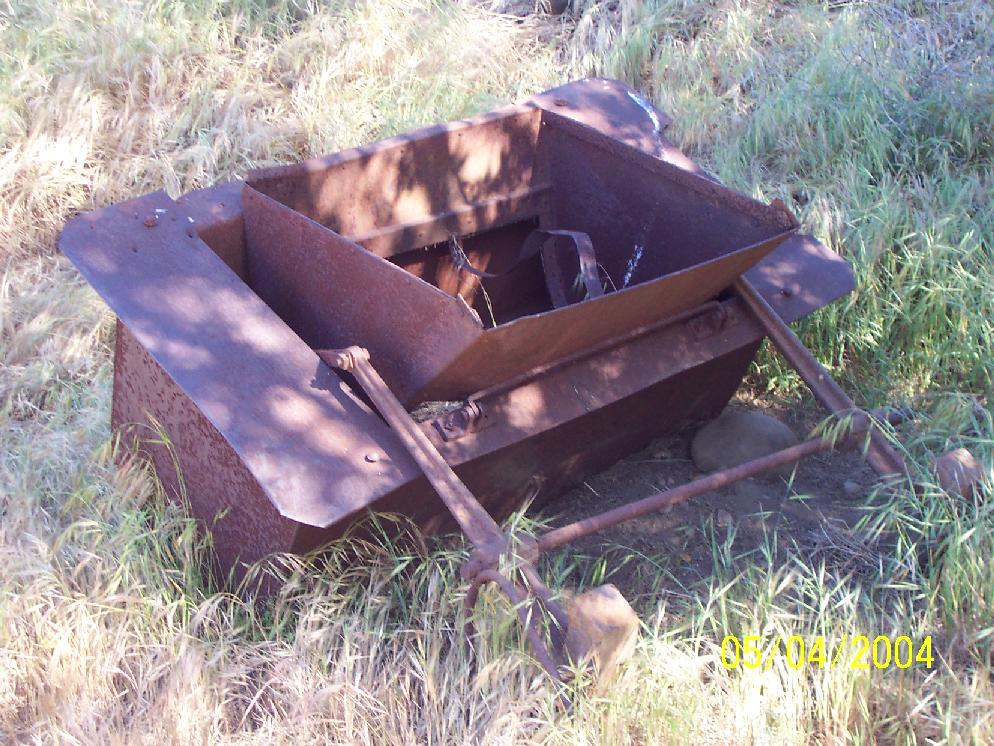 Figure 7: Historic Farming Equipment located north west of the GPS locations for buildings 8 and 9. |
|
once gained statewide recognition her knowledge and success in orchard production on the farm after the Shields acquired the land in 1857 (Ottley 1960:288). GPS Locations for buildings 8 and 9 was in a large oak tree grove approximately 200 meters north of the location for buildings 5 and 6. Remains from a number of time periods litter this area, most prominently is the remains of a Bee Farm owned previously by a local resident. Again, a survey of the area did not produce any remains definitive of historic buildings, although historic debris did include more stove pipe sections and a large piece of farming equipment (figure 7). |
||
|
Analysis In order to explain why direct evidence of historic buildings was not encountered using either the GPS coordinates for the buildings or from general field survey, a number of possible sources of error are noteworthy. First is the likely possibility that the GPS locations were incorrect. If these locations were off by more than 50m it is highly likely that remains could have been overlooked by this brief one-person field survey. This is entirely possible considering the number of potential sources of error that may have accumulated over the course of the methodology of this project. The most probable causes of error are from one of two sources: 1) errors in the original source maps or 2) errors produced in the georeferencing process. Although the latter is perhaps more likely, both must be considered in more detail. Errors in the original maps due to either inaccuracies in the original survey or subsequent distortion that effected the map is certainly a possibility. In his criticism of historic maps, Carr (1962:140) noted differences up to 200 ft in maps revised as late as 1958 and often the level of accuracy reflected the relative importance of features being mapped. Thus while the primary importance of the Shields map was to accurately delineate the buildings and the property boundary, the Debris Commission map had a different purpose. This map was one of a series produced for the California Debris Commission for planning purposes in order to ensure navigation and flood control on the river (Hagwood 1981:49). The map was therefore less concerned with the precise location of land parcels. Parcel lines may therefore be somewhat inaccurate on the map, resulting in degradation of the accuracy this project's results. Another possibility is that the original maps may have been subject to stretching or shrinking, producing distortion. While it is not known to what degree this may have occurred with either of the maps, if distortion was present, this would effect the position of features on the map. This is because the affine transformation model is limited in its ability to account for any stretching and shrinking that have taken place across the map as it can only adjust the image as a whole. To adjust for any localized stretching that might have affected the map, a more complex polynomial transformation (known commonly as “warping” or “rubber sheeting”) would need to have been used (Chang 2002:128). However, while these sources of error are entirely possible they cannot be verified directly. An alternative source of error is from the process of georeferencing the maps to real world coordinates. These errors might stem from poorly selected control points, selection of points on features whose positions have changed over time, or due to limitations on where links could be established. As mentioned above, during the process of georeferencing the Debris Commission map, street intersections seemed to correspond well with those of DRG. In a few cases however, points were selected that were less than obvious matches to the DRG layer. Although the overall error of the any particular link may not have been great, erroneous links that were not deleted would add to the inaccuracy of the map registration. It should be mentioned that that error may have been added to the result due to he use of the property boundary that was utilized to georeference the Shields map. However, although a partial change in the property outline was noticed, analysis of the result in figure 4 seemed to indicate an accurate registration between these two maps, at least in terms of their orientation and positioning. The most likely source of error from the georeferencing process is believed to have been due to the inability to establish links throughout the map image on the Debris Commission Map. As mentioned above, the reason for this was the lack of detail in the mapped information on the north side of the river. Because the Debris Commission was concerned with flood control in the area, the lack of information on the north side of the river is not surprising since this land is generally higher and therefore less susceptible to flooding. In an ideal transformation, links are established at both the edges of the image and throughout the center. Since the establishment of links effect the overall accuracy of the image transformation, limits on where control points could be established when georeferencing the historic map image would have had a consequence of a lower registration accuracy. In consideration of these sources of error in georeferencing the Debris Commission map, it is not surprising that as mentioned above, an obvious 35 meters error was present when this map was compared to the road layer. Thus, while the Shields Topographic map seemed to correctly match the property boundary of the Debris Commission map, error already present in the this map would be transferred to the Shields map. Additionally, errors in the process of georeferencing the Shields map would have then compounded the inaccuracies of the result. For it should not be forgotten that these maps were of very different scales, meaning that even seemingly small errors present on the smaller scale map will have a potentially dramatic impact when the considering the accuracy required on the larger scaled Shields Tract map. |
||
|
These potential problems aside, another possibility that should be addresses is that evidence of the historic remains may have been obscured or obliterated through the course of time. While admittedly details on the historic buildings themselves were not accessed, it is suggested that they represented a combination of farm and dwelling structures. Although it is uncertain if the these structures indicated on the map date back to the original establishment of the ranch in 1857, it is likely that they had undergone a considerable amount of weathering by the time the property was purchased by the County in the 1960s. Until as recently as 1955, the American River would periodically overflow and flood the surrounding lands with silt and rock debris (Dillinger 1991:94). This kind of activity, if it included the southern portion of Rossmoor Bar, could have easily obscured or removed altogether the historic remains in the area if they were not maintained. It is possible that if the area was flooded only the heaviest items such as farm equipment or metal debris would be left behind. While a solid building foundation would no doubt remain, soil deposition and the dense grass growth such as that currently growing in the Rossmoor Bar area would serve well to obscure all but the most obvious features. These circumstances no doubt have had a contributing effect on the current lack of visibility of the building remains if they exist in the area. Without subsurface archaeological testing programs it may in fact be difficult to impossible to locate any definite remains such as brick or stone foundations in order to verify the location of the structures. This type of field analysis goes far beyond the intention of this project but may be the only way to adequately verify the locations for some of these structures |
 Figure 8: Historic building locations as compared to modern arial photograph. Historic debris indicated by green triangles. (Note locations of southernmost building on modern residential properties.) |
|
|
Most likely, it was a combination of these two factors of limited visibility of remains and errors in the ground coordinates that contributed to the limited result obtained in the field. While it seems likely that the bulk of the error pertains to the georeferencing process, many of these sources seem largely unavoidable considering the data at hand. The fact of the matter is that sometimes it is difficult to register a map due to inability to identify ground control points on a map of a relatively undeveloped area. |
||
|
Conclusions
This project set out to determine the potential applicability of utilizing historical maps in a GIS environment for the purposes of identifying present day locations of historic features. In order for this type of analysis to be feasible for future researchers, the amount of spatial error expected in the results is a crucial factor that needs to be understood. However, because of the fact that direct evidence of the mapped buildings could not be located in the field, it is difficult to assess the accuracy of the results of this analysis. Besides the noted potential problems with georeferencing the maps or with the map images themselves, these results were likely complicated by both the ability of natural process to obscure historic remains, and by uncertainties in the details of the historic features represent on the map. Subsequent analysis of the results of this project seem to indicated that locations of the historic buildings may have been up to 80 meters from where this analysis originally placed them. If these findings are accurate, these results indicate that further assessment of both the problems contributing to the error and the accuracy of the results will need to be conducted. Future research relating to this type of historical analysis should utilize this example as a cautionary tale as to the many potential problems that may be encountered in this involved process. Historical information in many cases is often scarce or sometimes even absent altogether, so if we are to make sense the history that has survived we must be aware of both its strengths and limitations. Such is also true in regards to the use of modern technology, as seen in this paper with the use of GIS. Only when the limitations are fully understood can we attempt make sense of it all. |
||
|
References California Debris Commission, 1907 American River by the Corps of Engineers US Army. 1:9600 scale topographic map Carr, A. P., 1962. Cartographic Record and Historical Accuracy. Geography, 47:135-144. Chang, Kang-tsung, 2002. Introduction to Geographic Information Systems. San Francisco: McGraw Hill. Dillinger, William C. 1991. A History of the Lower American River. Sacramento. County Department of Parks and Recreation. Hagwood, Joseph J., 1981. The California Debris Commission. A History of the Hydraulic Mining Industry in the Western Sierra Nevada of California and the Governmental Agency Charged with its Regulation. Sacramento Harvey, J.T., 2003. Locating the Eureaka Stockade: Use of a Geographical Information System (GIS) in a Historiographical Research Context. Computers and the Humanities 37: 229-234. McCartney, Elizabeth. 2004. Personal Communication. Oliver, Gradon 1920. Topographic Map of Robert E. Shields Tract. Natomas Company of California. Ore, Espen S. 1995. Teaching New Tricks to an Old Map. Computers and the Humanities 28: 283-289. Ottley, Allen R. 1960. History of Sacramento County California. Berkeley: Howell-North. Pratt, Monica. 2002. GIS Provides a New View of the Past. ArcUser. July-September: 68-69. Stewart, Dona J. 2001 New Tricks with Old Maps: Urban Landscape Change, GIS, and Historic Preservation in the Less Developed World. The Professional Geographer. 53(3):361-373. Verbyla, D.L. and Change, K. 1997 Processing Digital Images in GIS. Santa Fe: Onward Press. | ||