TITLE A Study of Transportation GIS at London's Underground Network | |||||||||||||||||||||||||||||||||||||||||||||||||
|
AUTHOR Pamela M.Pangan American River College, Geography 350 Data Acquisition in GIS; Spring 2004 Contact Information: pamela.pangan@eds.com | |||||||||||||||||||||||||||||||||||||||||||||||||
|
ABSTRACT Transportation GIS or GIS-T as it is now commonly known, is considered one of the more complex applications of GIS because of how data and its data structures influence the outcome of analysis. Every line and node has to be carefully studied for flow of direction, speed, length, connectivity and variables that might create a stoppage or barrier in the flow of the network - basic attributes needed for a simple network analysis. The objective of this paper is to emulate a GIS-T in London’s Underground that would answer questions such as what is the shortest path to and from a station, what trains or railway trains to transfer or connect to get to a destination, and what places of interests are worth stopping by. Not surprising though is that London’s Underground is already using GIS-T through the web with their Route Finder and Journey Planner tools, which were used as a model and source of much of the data for the study. With sufficient data these questions can be answered using GIS Network Analysis like ARCMAP Utility Network Analyst. It is however, unfortunate that the study went without merit because of the lack of software license to process the data. The results were relegated to mere assumptions and untested outcomes. | |||||||||||||||||||||||||||||||||||||||||||||||||
|
INTRODUCTION The London Underground or the Tube as it is commonly called by the locals is a public transportation network composed of electrified railways that run through tunnels in Central London and above ground in the suburbs. It has 275 stations, 12 lines (Bakerloo, Central, Circle, District, East London, Hammersmith & City line, Jubilee, Metropolitan, Northern, Piccadilly, Victoria and Waterloo & City lines) and several routes and zones running to and from different destinations in the city. Anyone can basically get anywhere around London using the Tube as it connects to other forms of transportations such as buses (double-decker or not), trains (such as the Eurostar) and ferries. It was almost midnight in between stations from Kentish Town, my friends and I took the Tube to catch the last train to Oxford via the Paddington Station. There were the occasional voice-over about security warnings about unattended packages and at one point earlier that day the line we were on was evacuated because of such and we were diverted to another line/station. Security was tight because the Madrid bombing was only a week old. As we try to weave our way from the Northern Line to get off King’s Cross Station to catch the Hammersmith & City Line train to Paddington Station, it was then that I realized that this transportation system is definitely one of the many applications of GIS. The similarity of the underground and street networks as it relates to Network Analysis such as in finding directions, time of arrival to destination, alternative routes when barriers exist, traffic situations, etc. is apparent. Well, not surprising because both fall on Transportation GIS and would be the focus of this study | |||||||||||||||||||||||||||||||||||||||||||||||||
|
BACKGROUND Transportation infrastructure is an intrinsic and diverse geographic characteristic of a country even defining its economic status. In GIS, it is one of the most complex applications to work with, which compelled GIS software makers to develop specialized modules such as ARCMAP Utility Network Analyst Extension. GIS and Transportation Case Study by the Work Site Alliance with the Center for Environmental Information Technology Application (CEITA) describes the process of creating a GIS transportation or GIS-T (as it is now routinely called). While traditional GIS formulation’s strengths are in mapping display, and geo-data processing, GIS-T requires new data structures to represent the complexities of transportation network and to perform different network algorithms in order to fulfill its potential in the field of logistics and distribution logistics (Fischer, 2003). Another case study specific to our intended location, London, England, is the Transport Accessibility Case Report (Collin Buchanan and Partners, 2003) which discusses relationships of accessible transport networks to employment, and the economy using GIS. The study created a model based on the public transport network including railway and underground stations, bus stops as well as walking/waiting and travel times. It utilized another GIS software package called MapInfo. | |||||||||||||||||||||||||||||||||||||||||||||||||
|
METHODOLOGY The study will attempt to simulate a railway routing network analysis as an illustration of GIS in Transportation. The objectives are as follows: 1) find the shortest routes, directions and travel times from point of origin to destination (station to station), and 2) find points of interests/tourist attractions from different stations and add information including photo. London’s Underground (LU) railway was chosen for the study because of its reputation of being the oldest and most efficient railway system in the world as well as the author having experienced as a tourist going around the city on it. However, because of limited time the study was limited to Zone 1 of the LU, as identified by London’s zone fare system. Ten of the 12 Lines run within Zone 1, only East London and Waterloo & City do not. Moreover, these railway lines are fall under Central London where most of London’s tourist attractions can be accessed. To accomplish the study, data were gathered through exhaustive use of the internet. Maps of the Tube, the many stations and lines will be used extensively although these maps are considered cartograms such as in assumed center lines of the railways. Downloaded in JPG or GIF format the Tube map (London's Underground network map). Also, data showing geographic location of the stations were found so that the scanned Tube map can be geo-referenced. The following steps were supposed to have been done through ARCMAP and then for analysis use the Utility Network Analyst Extension. 1) Create vector layer consisting of lines for railways showing FNODE and TNODE and put appropriate nodes on intersections or station changes. 2) Create database to show attributes line names, station name, directionality, connectivity, length (driven length versus digitized length), speed limit, and scenic value will also be considered. 3) Create a point layer for special interests or landmarks that includes the name, information and attach selected pictures taken during London trip into the database. However, it wasn't accomplished because the Network Analyst Extension is not available at the campus. Utilized the official site of London’s Transport which features a journey and route planner was be used as a model for the simulation. The site is at http://transportforlondon.gov.uk. | |||||||||||||||||||||||||||||||||||||||||||||||||
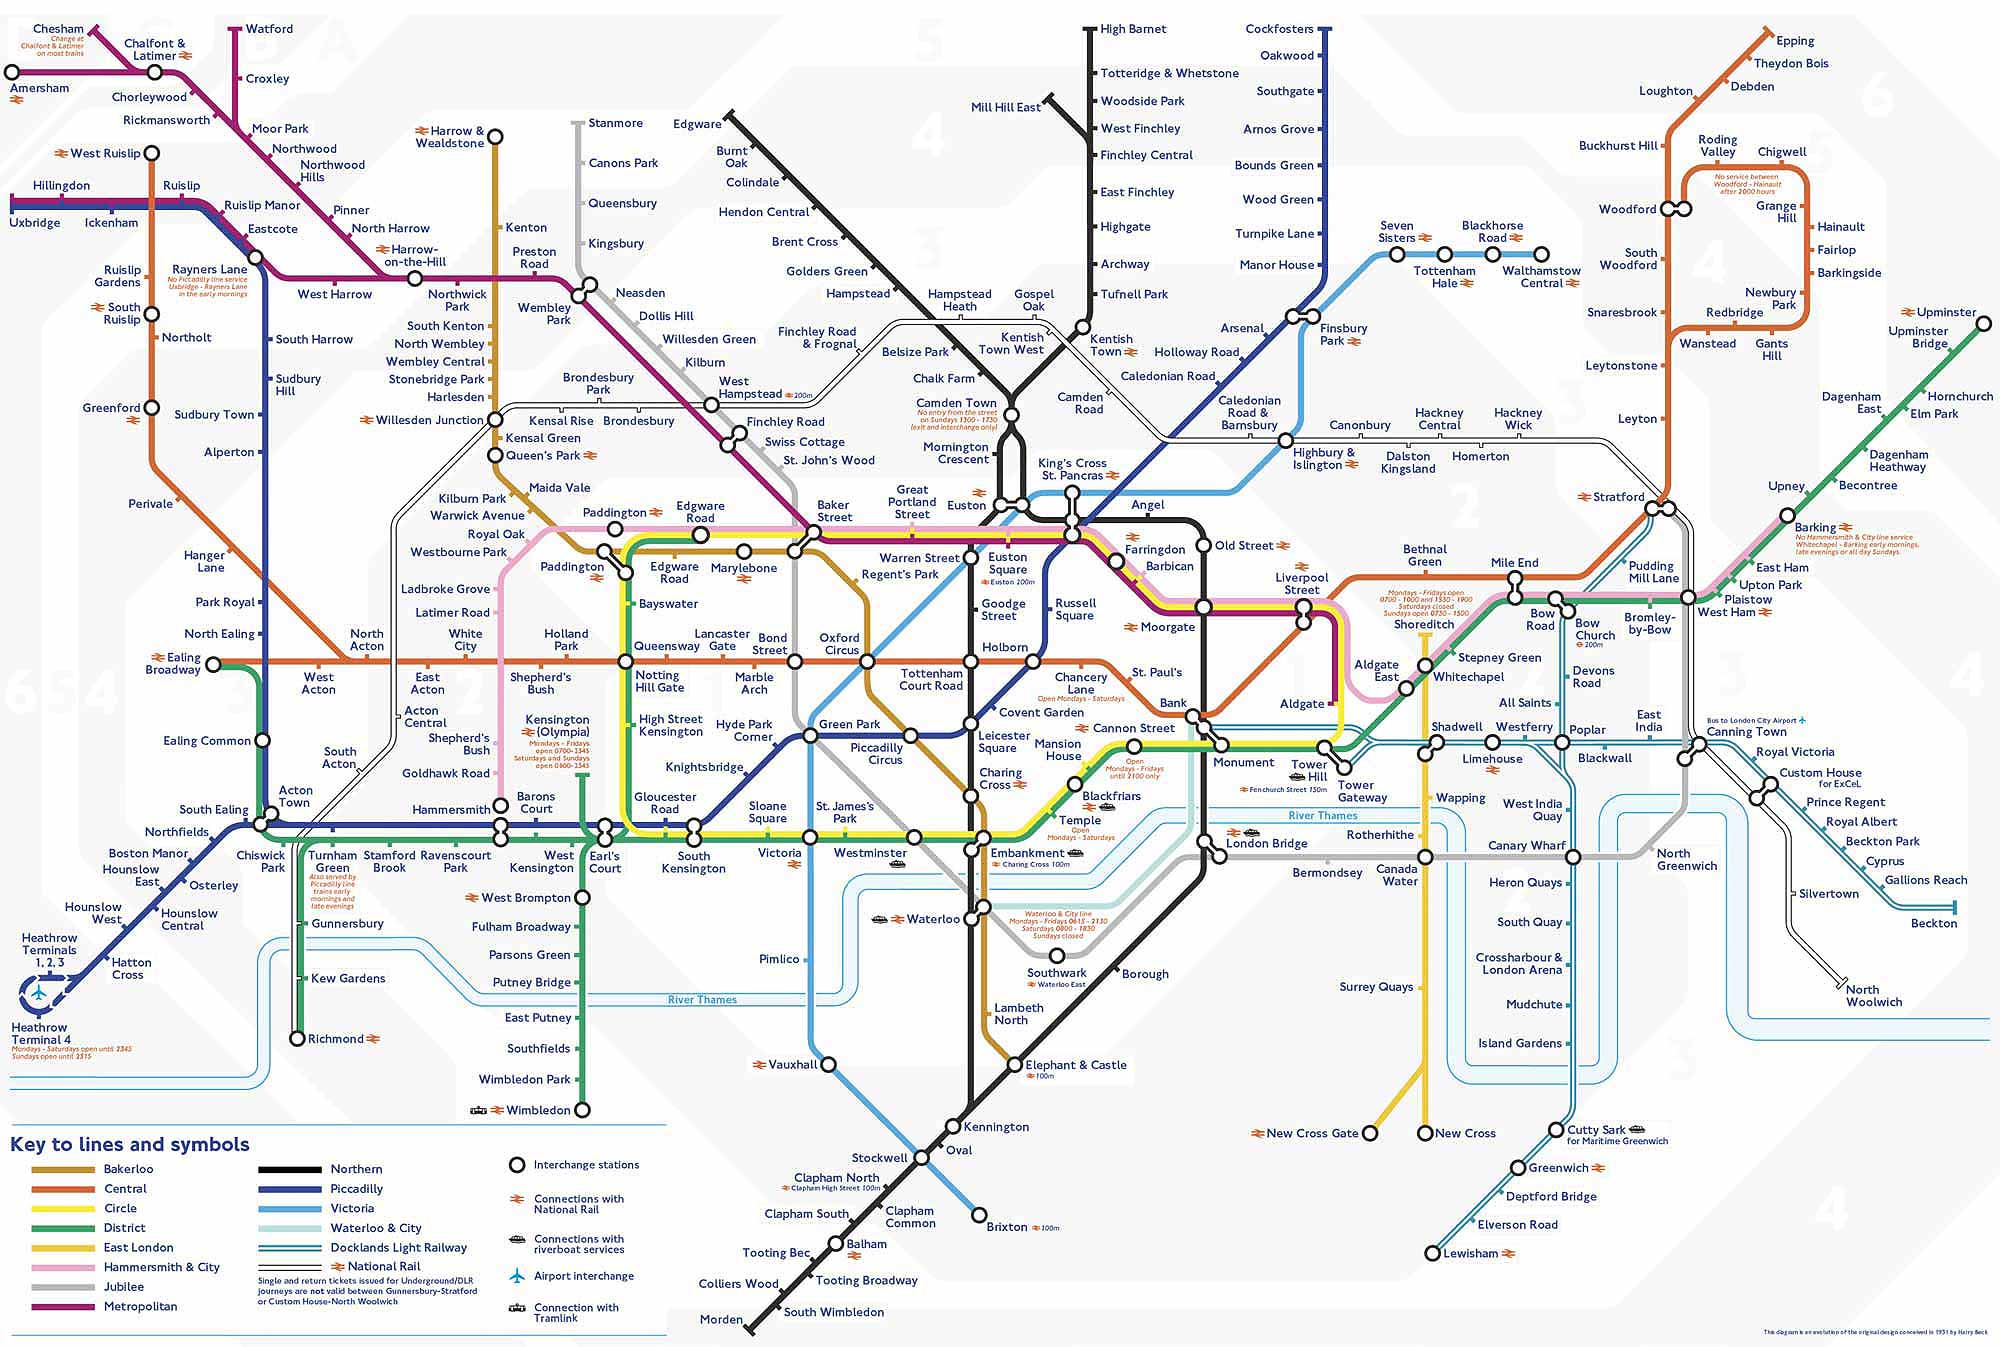
London's Underground Tube Map This is the most recent map of the Underground showing the stations and operational lines The 12 existing lines are as follows: Bakerloo, Central, Circle, District, East London, Hammersmith & City Jubilee, Metropolitan, Northern, Piccadilly Victoria, Waterloo & City Source: Official site of London’s Transport http://transportforlondon.gov.uk |
 | ||||||||||||||||||||||||||||||||||||||||||||||||
Zone 1 Map showing the Circle, District, Central, Hammersmith & City,and Piccadilly Lines Yellow = Circle Red = Central Line Green = District Line Pink = Hammersmith & City Line Blue = Piccadilly Line |
| ||||||||||||||||||||||||||||||||||||||||||||||||
|
RESULTS | |||||||||||||||||||||||||||||||||||||||||||||||||
|
This table shows data gathered and will be used as
attributes for the line theme. It shows railway line Hammersmith &
City Line and names of all the stations falling into Zone 1. For listing
for other railway line please refer to attached document or contact the
author. | ||||||||||||||||||||||||||||||||||||||||||||||||
Average Train Speed is 33 km/h (20.5 mph) including station stops. Each station has platforms that indicate which direction the train is going as well as connections to other railway lines At this point the layers are now prepared for editing, i.e., nodes (stations),flows or directions of lines and attributes are input. The following are the attributes: ARC_ID - primary key RAIL_NAME - name of railway line such as Piccadilly, Circle, etc FNODE - From Node TNODE - To Node LENGTH_KN - known length as shown in above table LENGTH - as ARCMAP would have calculated NODE_ID - node id, or stations STATION_NAME - name of station on a node INTER_STATION - flag if station is an interchange station (Y or N) Create a point layer map for points of interests/tourist attractions in London with the following fields: POINT_ID - this will act as the primary key, node id POINT_NAME - name of tourist attraction INFO - information about tourist attraction | |||||||||||||||||||||||||||||||||||||||||||||||||
|
Table shows the concept of a relational database and how above attributes would have been entered thru ARCMAP and eventually linked to the table below through the node_id acting like a primary key. | ||||||||||||||||||||||||||||||||||||||||||||||||
|
Table shows example of attributes for station that would have been linked from above table through the node ID. | ||||||||||||||||||||||||||||||||||||||||||||||||
|
ANALYSIS With the vector layer created , the node-arc model will be used. There are two network rules that can be applied for the connections of edges and junctions. They are the edge-junction rule and edge-edge rule. An edge-junction rule governs which edges can connect to which junctions, while the edge-edge rule governs how and through what type of junction two edges can join. Also, sources and sinks need to be identified to establish flow of direction in a network. A source is the junction at which flow originates while a sink is the junction where flow ceases (Matze and Battersby, 2000). Weights in transportation network to be used: Edge length / train speed = travel time where train speed is known =20.5 mph Station wait time included in train speed Variables: Barriers in the railway exist such as stoppage in station and what alternative route should be taken. Stoppages such as services being cut off due to train breaking down or the railway line is temporarily not in use because of say, security measures – which is quite prevalent in the Underground. A point theme that would have been created shows points of interests or tourist attractions in London. This could either be linked to the node attributes (stations) or an above ground map or street map would have been collected/digitized to show Underground stations access and would act as a stoppage in the network. Photos and information of these tourist attractions will have been linked to the points, as well. After all these data have been input, the ARCMAP Utility Network Analyst Extension would have been used to perform a network trace. To create a simple network trace on ARMAP, the following are done: 1) create the Geo-database, 2) create Network features, 3) establish Flow and 4) perform Trace. These processes are done with a click of the mouse, but note that they will only work successfully if all the attributes of each individual line and nodes have been entered. | |||||||||||||||||||||||||||||||||||||||||||||||||
|
Outcome of the Study | |||||||||||||||||||||||||||||||||||||||||||||||||
|
Query: Shortest route using the Underground from
Kentish Town station to Tower Hill station. Show Directions as well as
connections, transfers and tourist attraction at destination.
| ||||||||||||||||||||||||||||||||||||||||||||||||
 |
(Left) The map shows the street map of the starting point (Kentish Town) and location of the Underground station. Map courtesy of Route Planner from Transport for London website. | ||||||||||||||||||||||||||||||||||||||||||||||||
 |
(Left) Map of the railway lines and stations from starting point, Kentish Town to destination, Tower Hill based on above directions. Other lines are also shown as an alternative route Black=Northern Line Light Blue= Piccadilly Line Pink = Hammersmith & City Line Yellow = Circle Line Purple = Metropolitan Line | ||||||||||||||||||||||||||||||||||||||||||||||||
 |
(Left) The map shows the street map of the destination point (Tower Hill) and location of the Underground station. Map courtesy of Route Planner from Transport for London website. | ||||||||||||||||||||||||||||||||||||||||||||||||
|
CONCLUSIONS |
|||||||||||||||||||||||||||||||||||||||||||||||||
|
REFERENCES Val Noronha, Unit 183 – Transportation Networks, Digital Geographic Research Corp., Mississauga, Ontario, Canada, 1998 http://www.ncgia.ucsb.edu/giscc/units/u183/u183.html Network Analysis, CFR 250 – Intro to GIS in Forest Resources http://gis.washington.edu/cfr250/lessons/network/#create_theme GIS and Transportation Case Study - developed by Work Site Alliance with contributors from Dr. Yichun Xie (Director of Center for Environmental Information Technology Application (CEITA)), Beverly Hunter (Consultant), Tina Roberts (Consultant) and CEITA Staff, http://ceita.emich.edu/wsatraining/Transportation/GIS_Trans.PDF Transport Accessibility – Case for London Technical Report, Colin Buchanan and Partners commissioned by GLA Economics, 2003 http://www.london.gov.uk/mayor/economic_unit/case_for_london/transportaccessibility_report.pdf Clive’s Underground Guides - http://www.davros.org/rail/culg/ UC Santa Barbara, Department of Geography, 2000 – GEOG 580 Lab, originally created by Nicholas Matze and Sarah Battersby http://dusk.geo.orst.edu/buffgis/arc8/lab/lab5/lab5.html Manfred M. Fischer, GIS and Network Analysis http://www.ersa.org/ersaconfs/ersa03/cdrom/papers/433.pdf | |||||||||||||||||||||||||||||||||||||||||||||||||