| Title Crime Analysis: A Look Into Residential Burglaries in the City of Sacramento |
|
Author Name: Auturo Smith American River College, Geography 350: Data Acquisition in GIS; Spring 2004 Contact Email: smithav@cdm.com |
|
Abstract
Analyzing areas with high residential burglaries per zip
code and the impact weather has on the volume of reports.
|
|
Introduction
Everyone is victimized by crime at some point in life. In 2002, just months after moving into our
new home, my neighborhood was plagued by a rash of home and auto
burglaries.In March 2004, my wife
became prey, when her Dodge Durango was broken into. Fortunately, the criminal(s) only got away with an empty school
bag, but left behind a broken passenger window. Upon calling the police, she was directed to the Sacramento
Police website (www.sacpd.org) to complete
an online police report.About a week
later, she received a copy of that report in the mail confirming receipt. But what happens next? I curiously went to the website and
discovered that the Sacramento Police Department maintains an ArcIMS. After a few minutes of browsing, I
discovered a link to download annual crime statistics and geo-referenced crime
data.How many burglaries occur per
week?Is there a pattern to criminal
activities?What other crime was
occurring in and around my neighborhood and/or city? The questions were endless.
Using ArcView GIS and ArcMap, I will show how simple GIS crime analysis
can assist the police and communities fight crime.
|
|
Background
In June 2002, the Sacramento Police launched an online
interactive crime-mapping program, a first of its kind in California. A joint effort between the City of
Sacramento GIS department and the Sacramento Police Crime Analysis Unit, the
program allows citizens to see what types of crimes are occurring in their
neighborhoods.Two years prior, an article
was published in the Sacramento News & Reviews, SN&R, about this
innovative technology.The author was
invited to attend a Sacramento Police InfoCOM meeting to see, firsthand, the
power of GIS.However, the author went
away unimpressed, claiming computers may be the wave of the future, but the
things we learned in kindergarten can still be the most useful.
|
|
Methods
When designing a GIS, reliable data is important to the
success of any analysis. Once the data
is collected, it must be organized (or processed) for its intended use. Below is a list of data used for this
project:
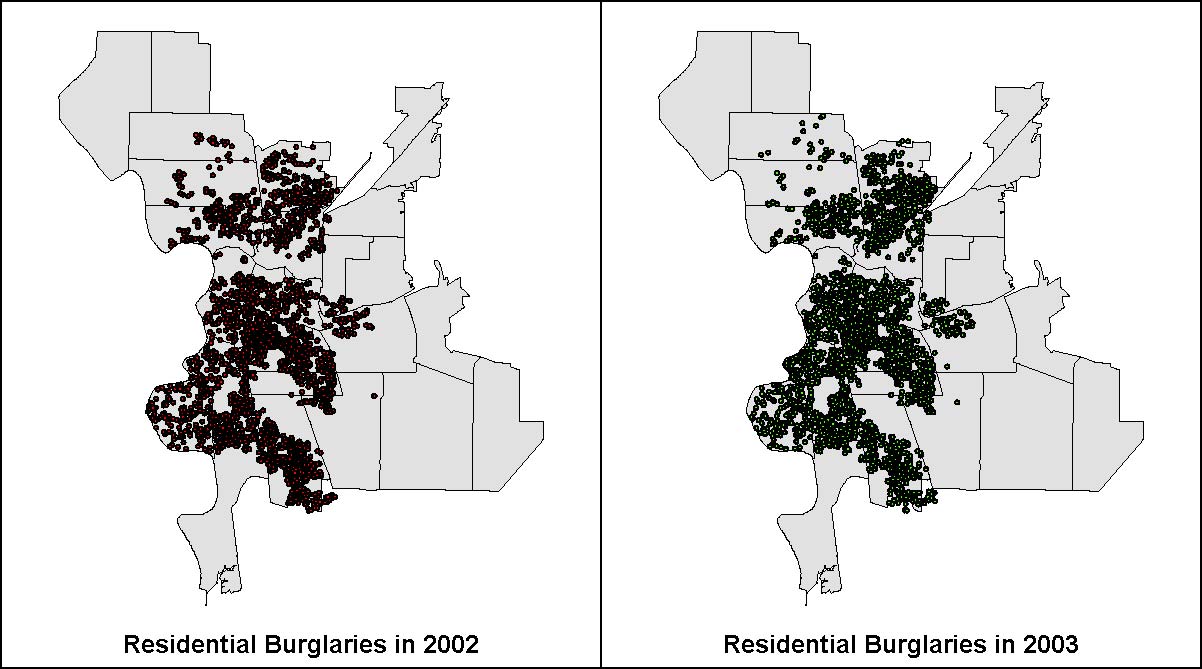
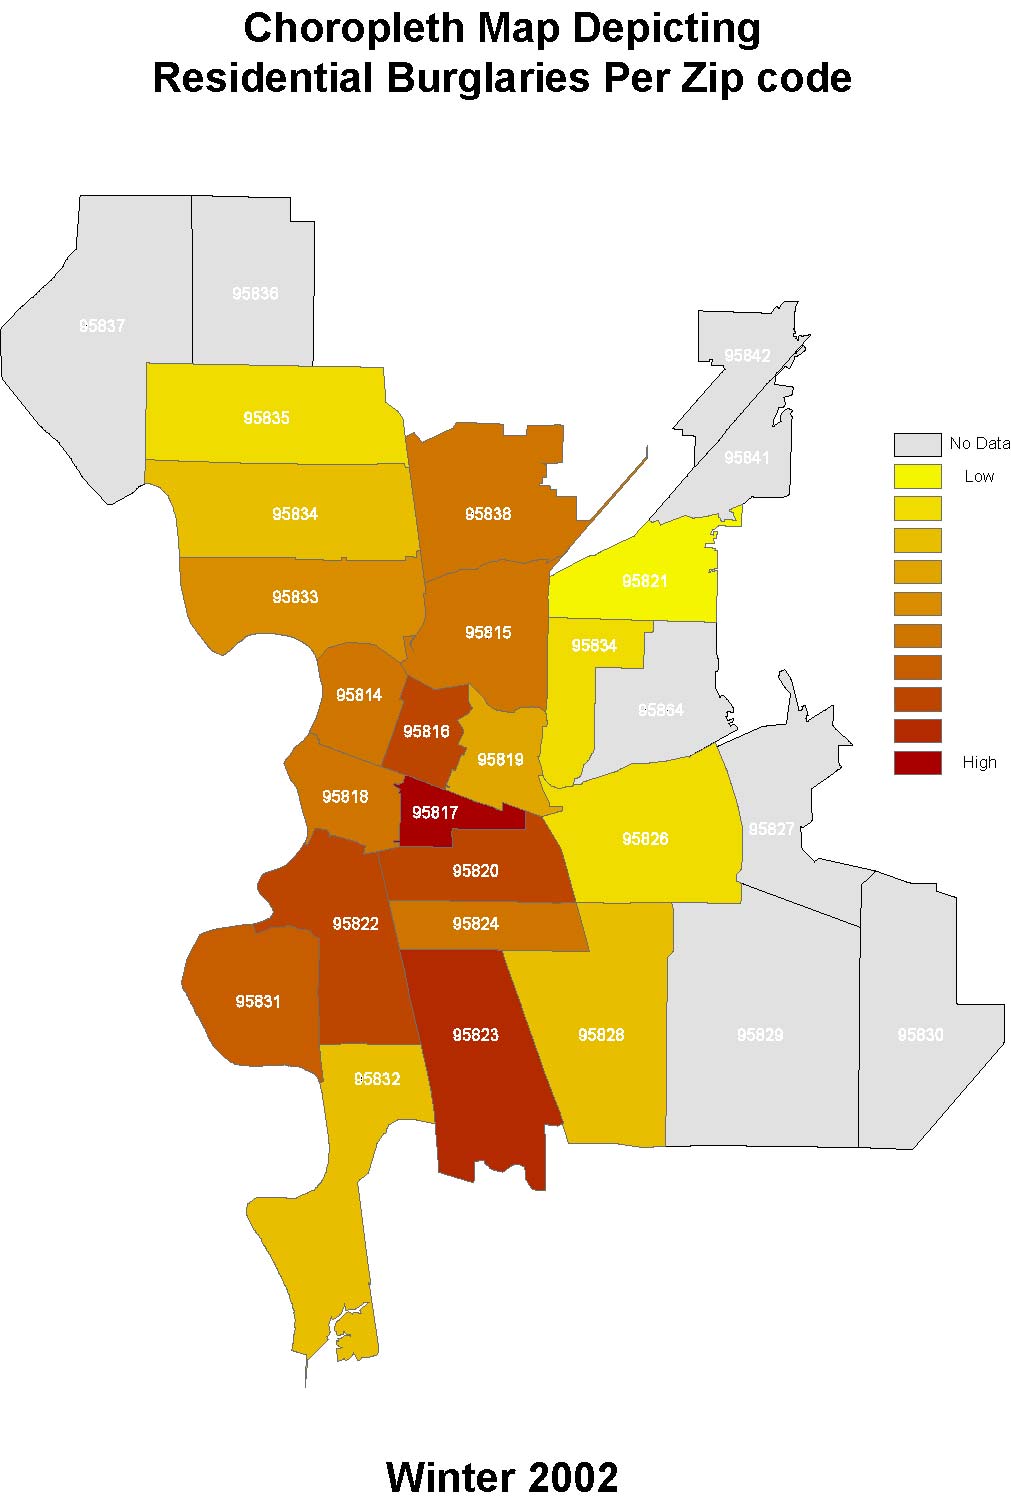
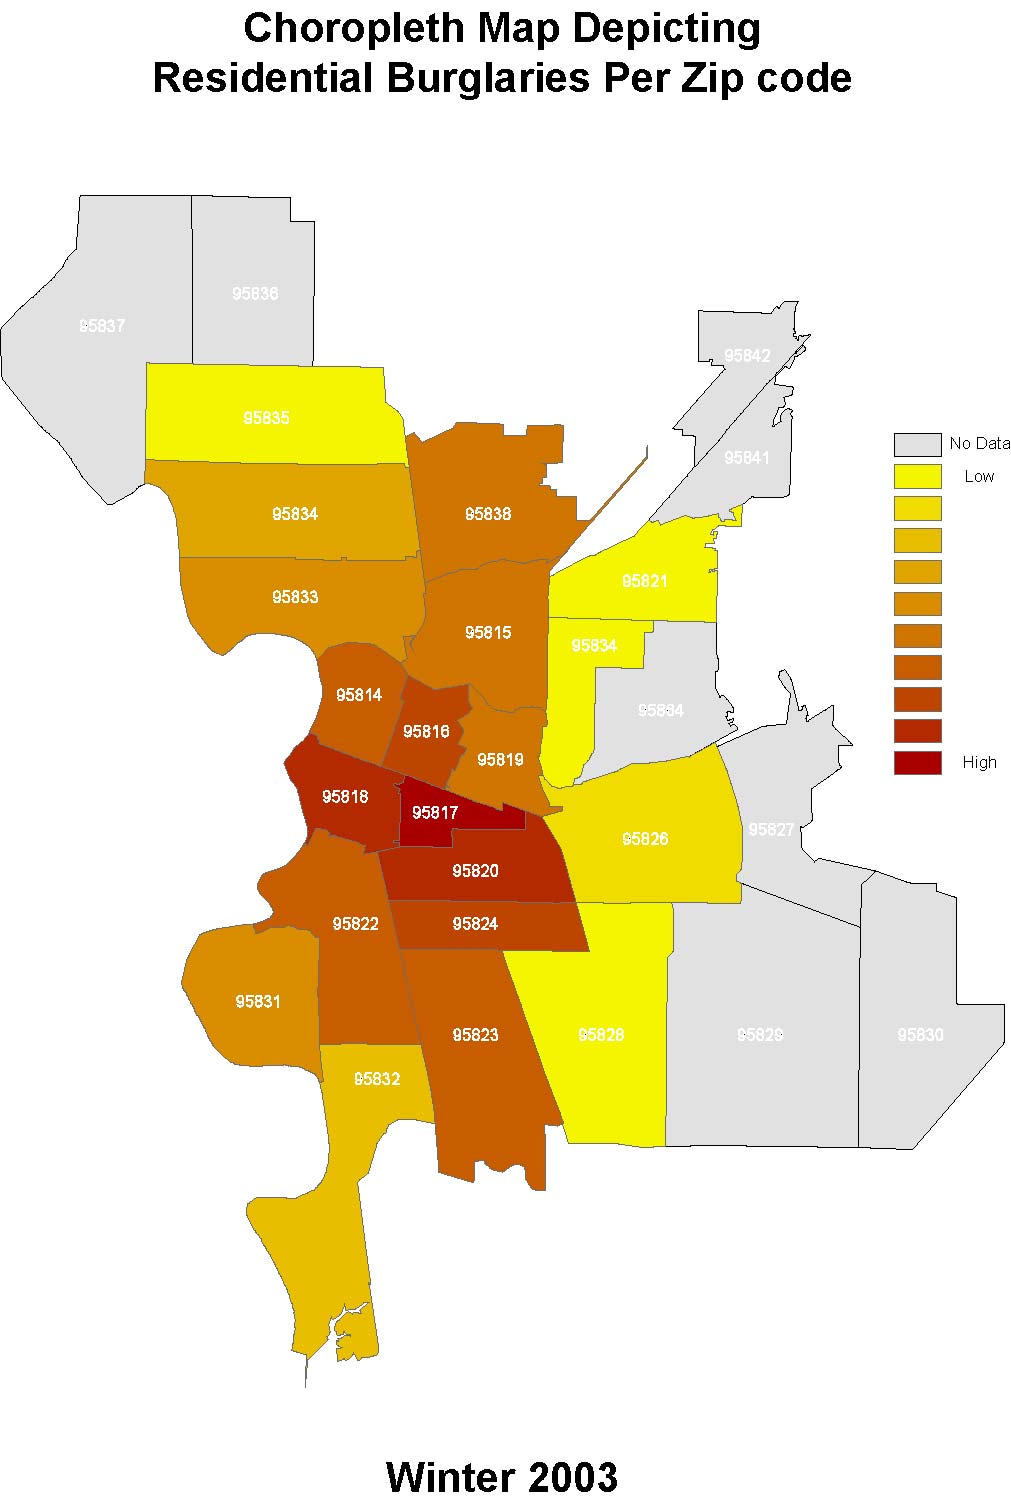
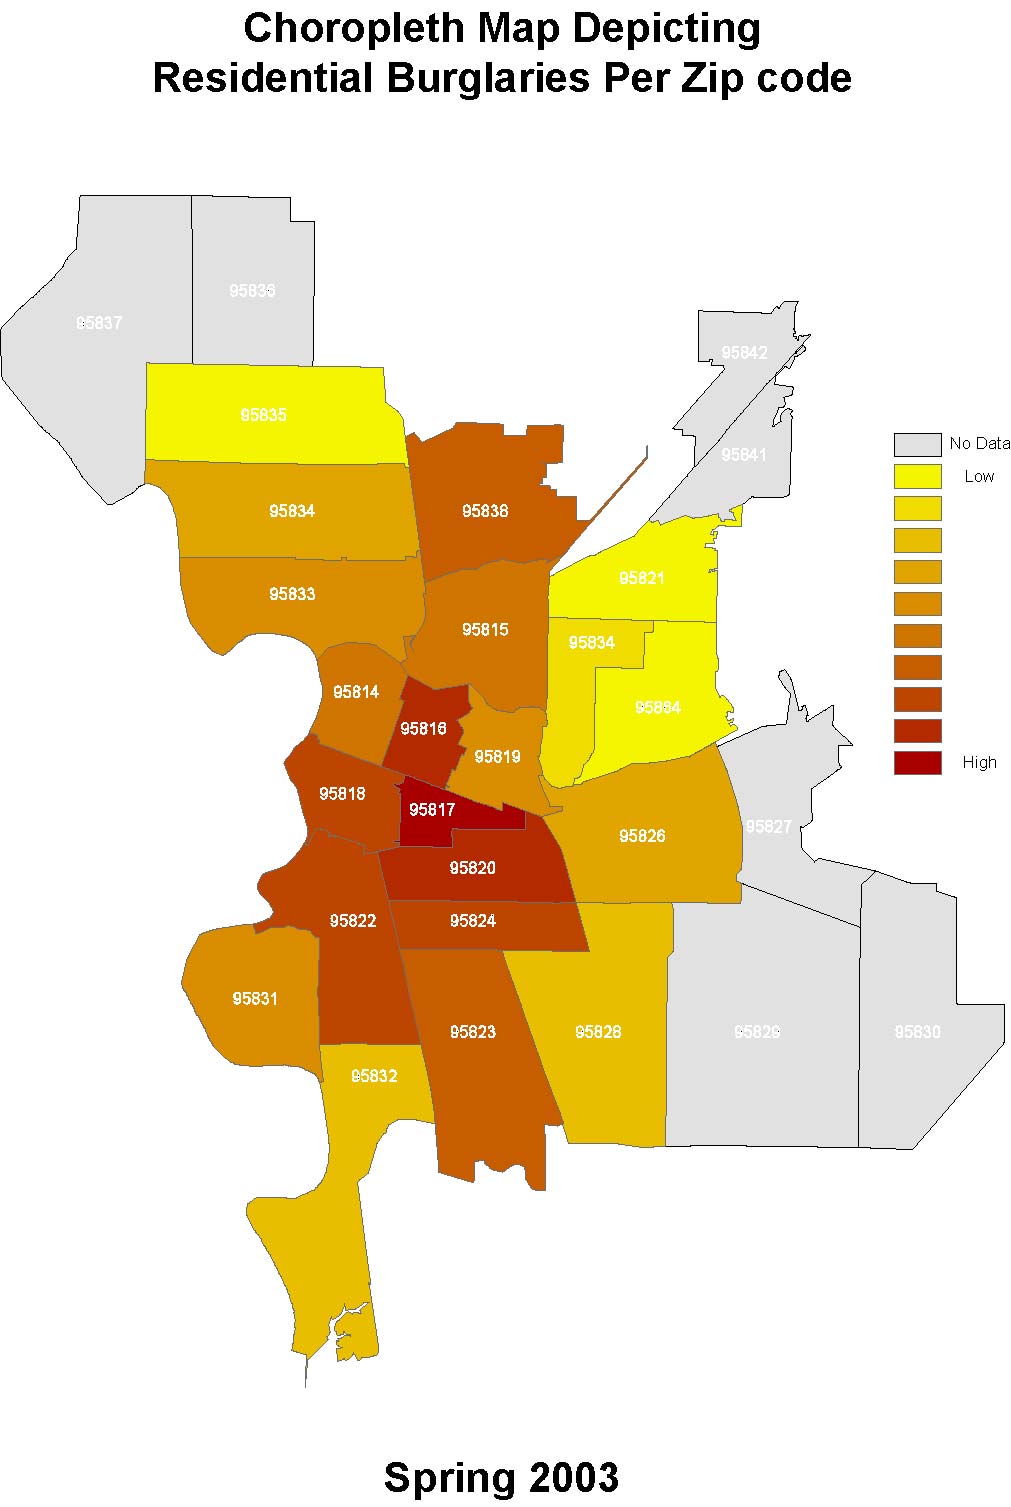
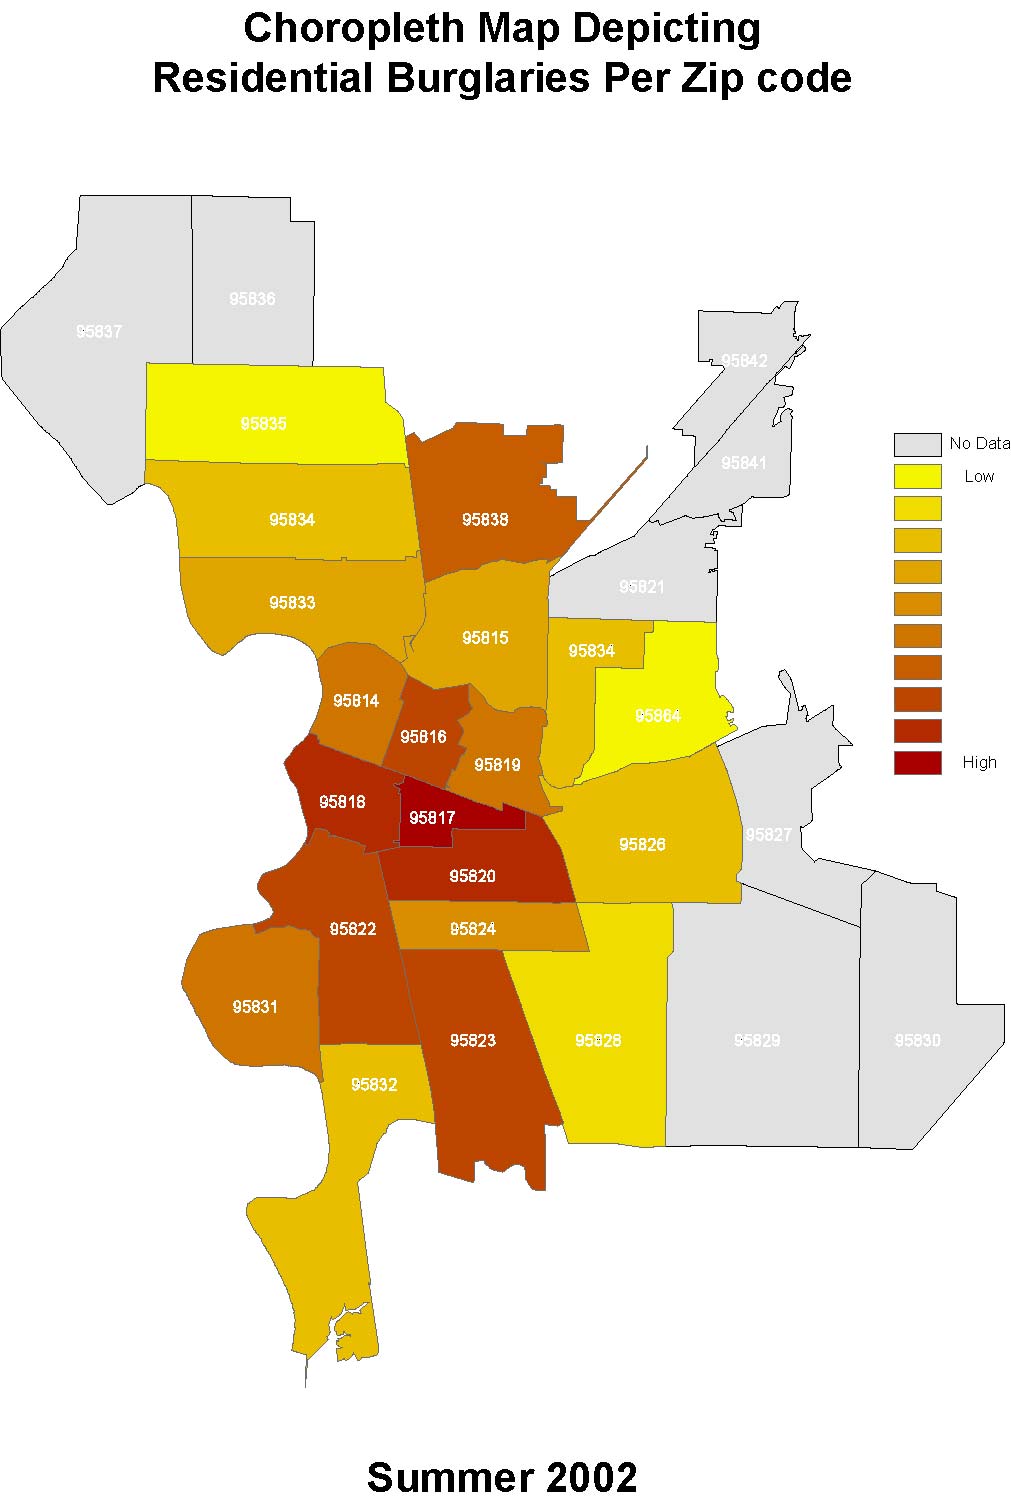
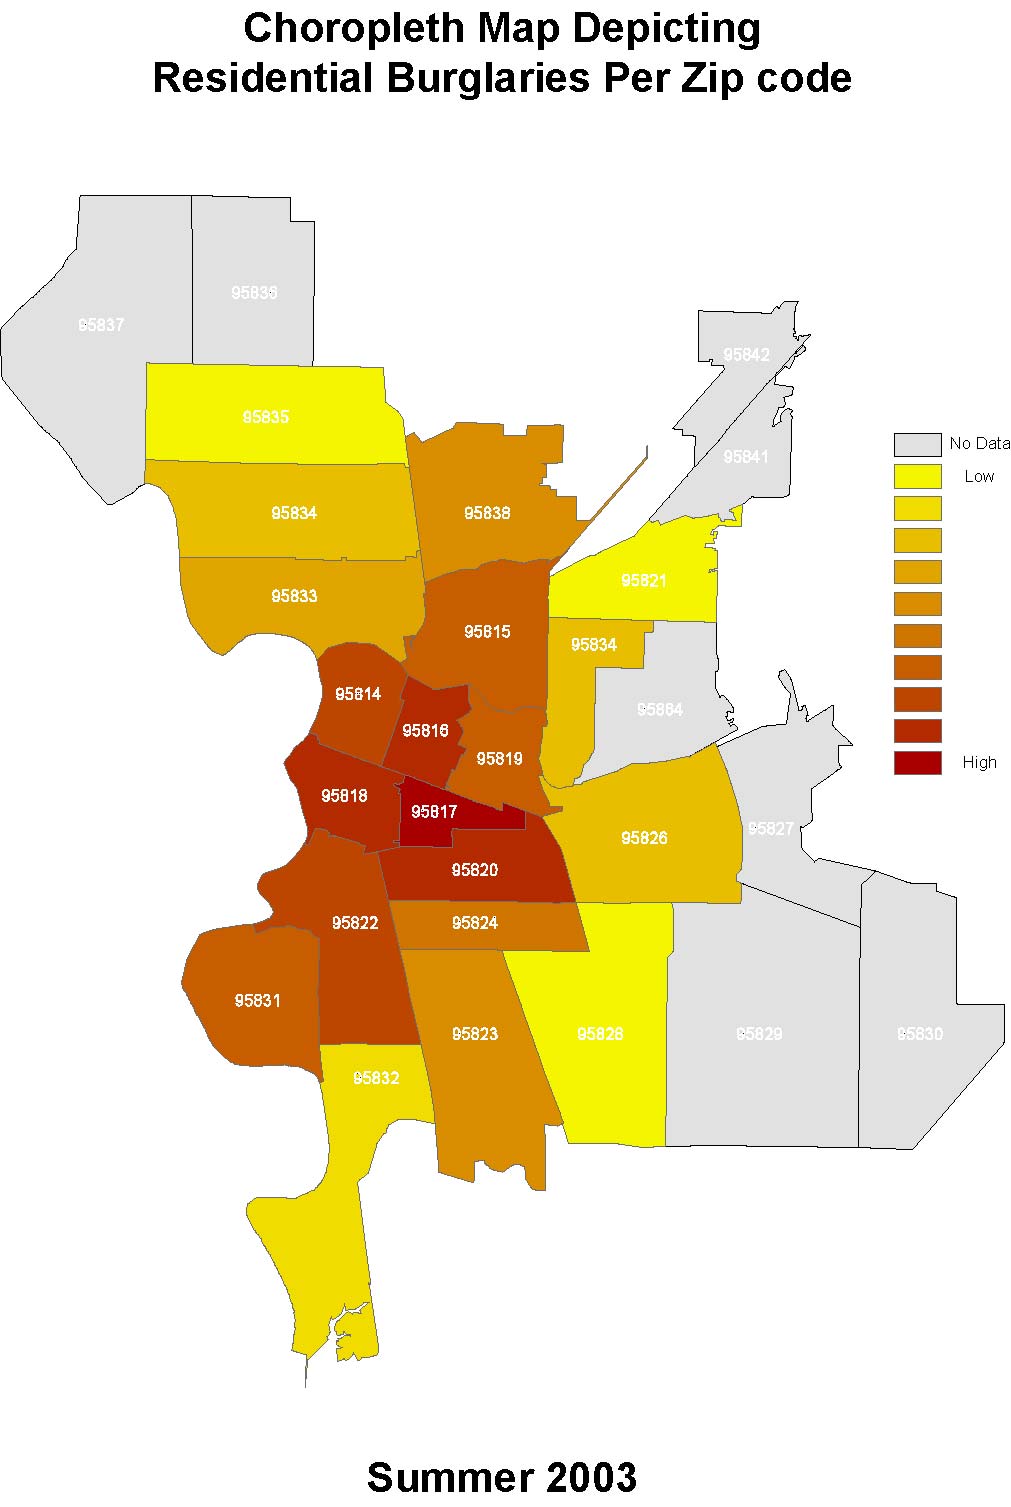
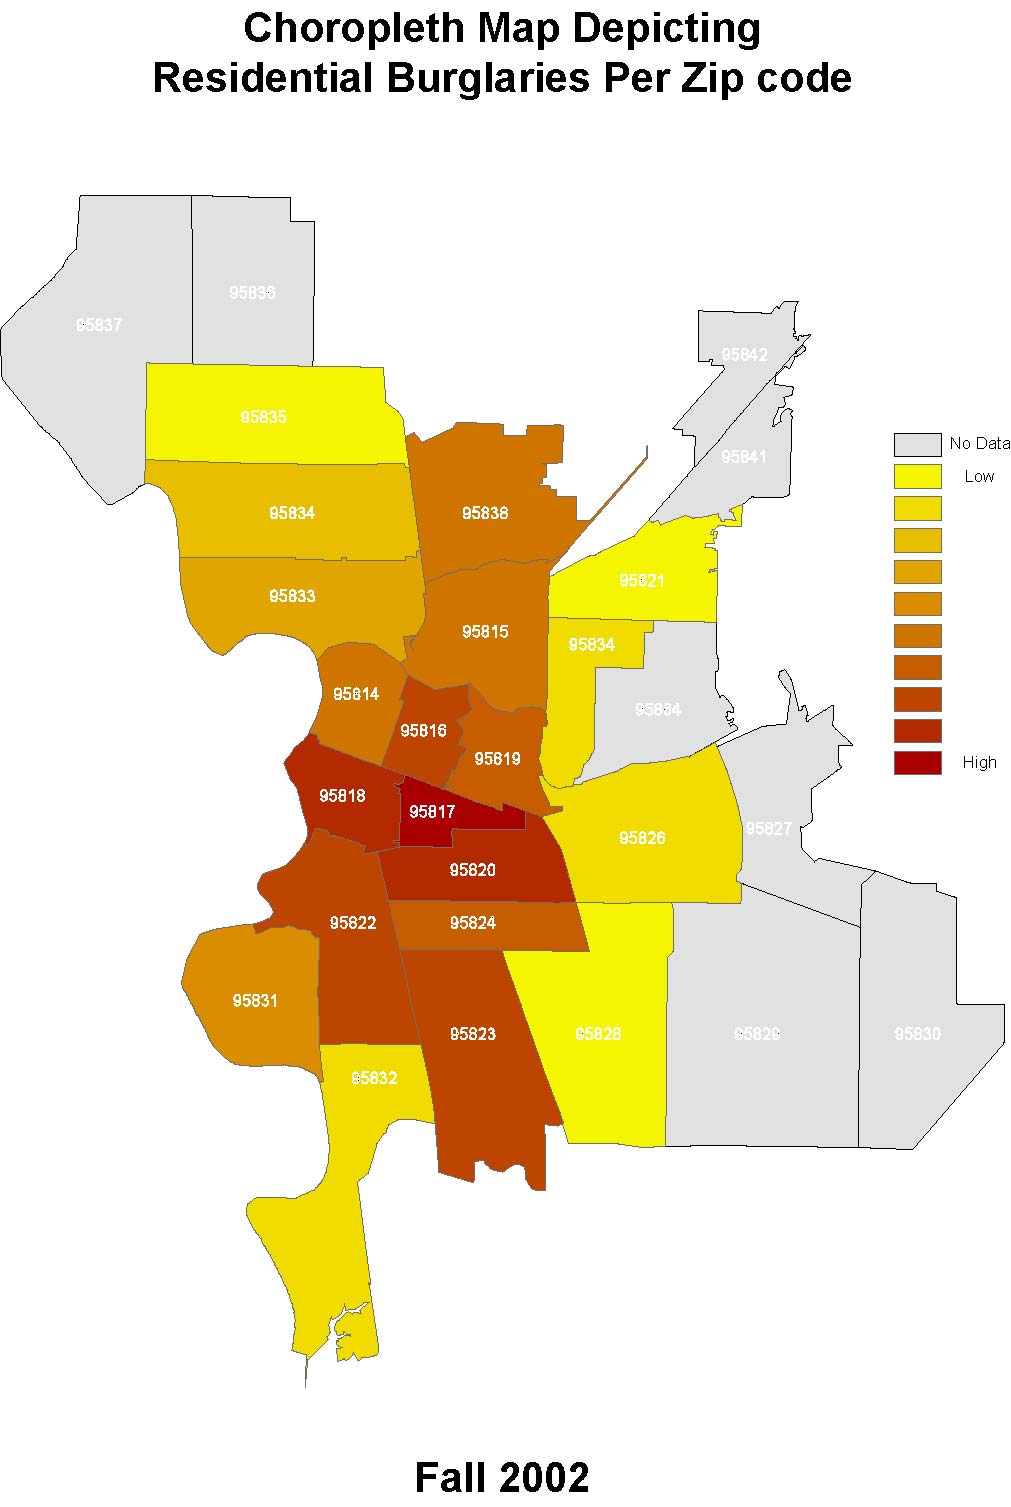
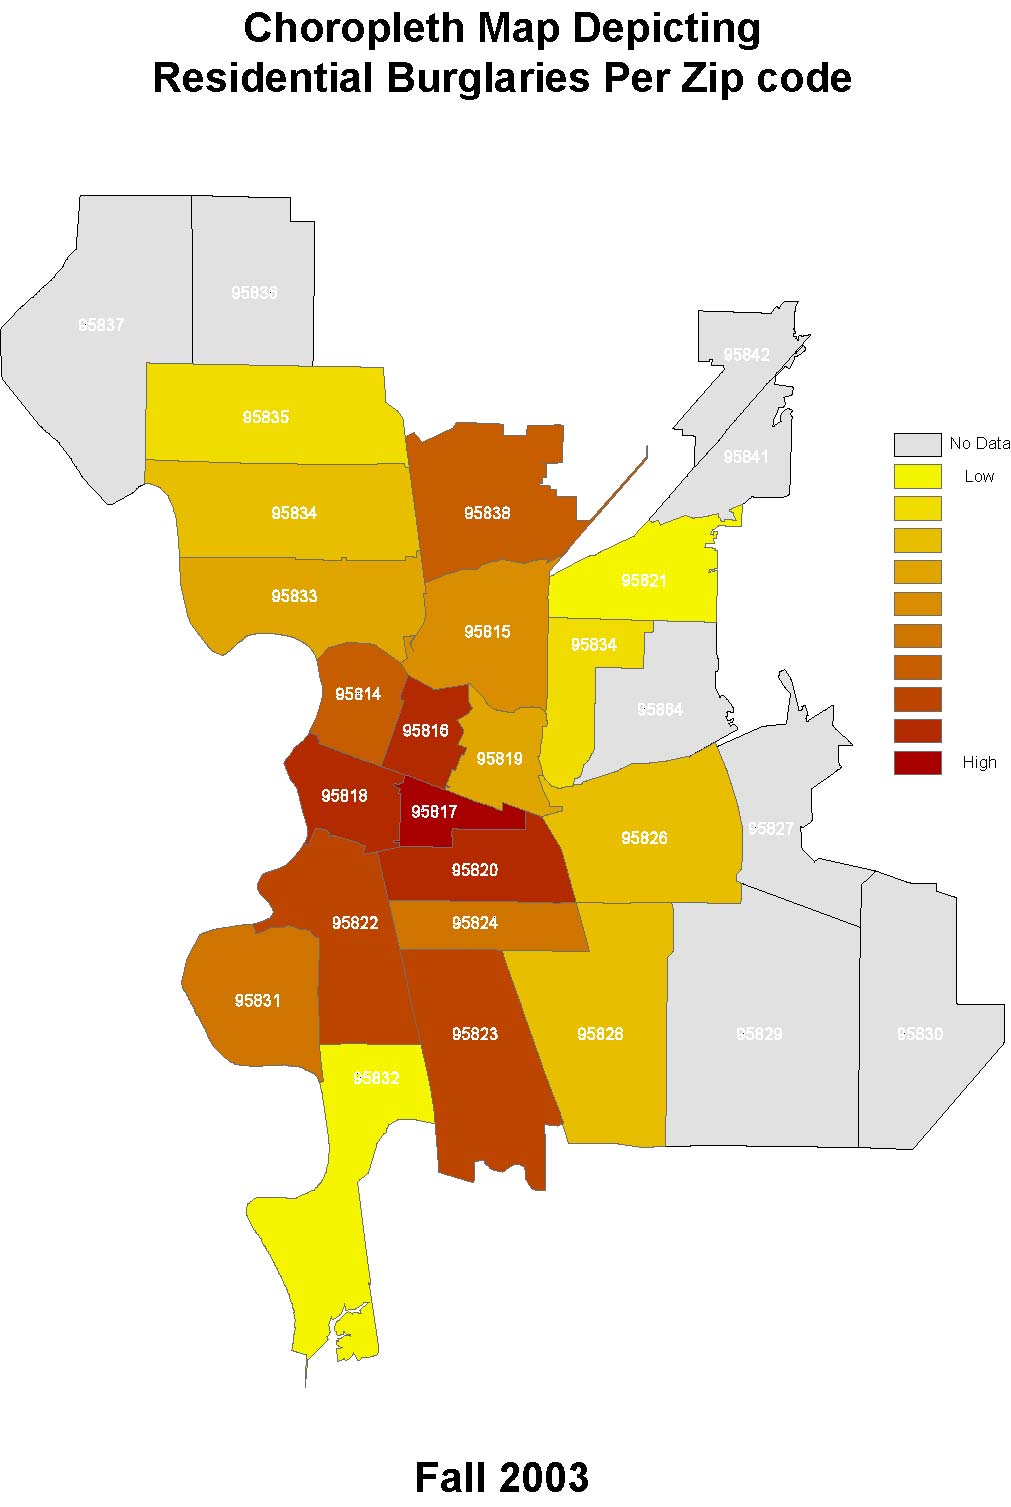
Crime information was available for years 1991 thru 2003; however, only 2002 and 2003 data had coordinate information in the tables. I downloaded the data dictionary and crime classification coding reference guide to translate the abbreviated codes. California Spatial Information Library (CaSIL) http://gis.ca.gov/ is an excellent source for California-wide GIS base layers.I downloaded county boundaries, city boundaries, and zip code coverages. Monthly weather report data was downloaded from the National Weather Service Forecast Office website http://www.wrh.noaa.gov/sacramento/html/climo.html for 2002 and 2003. Organize dataThe raw crime data had 53,742 points for 2002 and 56,141 points for 2003, which included a spectrum of crime categories (from 1st degree murder to misuse of a medical card). For the purpose of this project, residential burglary was chosen for analysis. The final project database was then reduced to 3,378 points for 2002 and 3,730 points for 2003. Using CaSIL GIS coverages as a base map, the crime points were overlaid on the City of Sacramento for reference. However, even at this scale, the clutter of points made it very difficult to conclude any type of analysis. In the Manual of Crime Analysis Map Production, published by the US Department of Justice, the author explains that using simple point maps for a large number of incidents is not recommended because, on a small-scale map, areas relatively close to each other will be stacked on top of one another. Instead, a choropleth map depicting residential burglaries by zip code would be more beneficial. Using ArcView, I spatially joined the zip codes (from the zip code polygon) to the crime database. Next, I opened the crime points database and summarized the total residential burglaries by zip code. I then joined the summarized total residential burglaries database to the zip code polygon. Now crime can be shaded by zip code to identify high crime areas within the City of Sacramento.In the crime points database, I created a new field for date and temperature. I then concatenated zip code, date, and temperature into one field this would be used for later analysis. Query dataNow that the data has been organized, it can be queried to begin the analysis process:
|
|
Results
Ï It was easy to discern which area, in Sacramento, had the highest count of residential burglaries in 2002 and 2003. Zip code 95817 ranked highest in residential burglary than any other zip code in the city, for both 2002 and 2003. Ï Residential burglaries increased by 352 reports in 2003, from 3,378 in 2002 to 3,730 in 2003. Ï Crime peaked in the summer of 2002 and 2003. (See Tables) Ï In both 2002 and 2003, crime most often occurred at temperatures between 61 degrees and 70 degrees; however, in 2002, crime occurred most at 64 degrees, but 85 degrees in 2003. (See Tables) |
|
Analysis At the beginning of this project, the plan was to investigate crime in neighborhood watch communities vs. non-neighborhood watch communities; however, after weeks of unsuccessful phone calls to the Sacramento Police Department, I decided to omit that part of the study. The most difficult part of the project was finding a way to link crime, zip, date, and temperature together. Although simple, such analysis is useful to law enforcement agencies because it brings everything into perspective (i.e. an address becomes a point on a map; cluster of points in chronological order illustrates a trend.) |
|
Conclusions Crime analysis has transformed from the familiar static map, inundated with color-coded pushpins and hanging on the wall, into on-the-fly decision making. Police are making logical decisions to mobilizing smarter. The focus of this project, residential burglaries, is only a small percentage of what GIS offers to crime analysis. More research is necessary to fine tune variables to achieve the optimum result per situation. |
|
References
Boba, Rachel, PhD, October 2000. Guidelines to Implement and Evaluate Crime Analysis and Mapping in Law Enforcement Agencies. Velasco, Mary and Rachel Boba, PhD, 2000. Manual of Crime Analysis Map Production. |