| Title Distance to Parks Factors For The City of Sacramento | |
|
Author Jeff Baldwin American River College, Geography 350: Data Acquisition in GIS; Fall 2004 Contact Information: email: jeffba@winfirst.com | |
|
Abstract Using GIS to determine if population density or median income plays a greater role in how far parks are located from residents in the City of Sacramento is possible. Our study has shown that in fact, median income plays a larger role in how far residents live from parks, and the lowest incomes tend to live closer to city parks than higher incomes. Population density seemed to be less of a factor in determining distance to parks, where there was a difference of only about a tenth of a mile in distance between the lowest and highest densities. | |
|
Introduction The Sacramento area has many parks for its residents to enjoy. Which begs the question, are there factors that influence where parks are located? Here we will examine two possible factors that may influence where parks are placed, income and population density. To accomplish our task we will examine census data from the year 2000 United States census, as well as data from the City of Sacramento showing where parks are located. We will contain our study for the most part to the City of Sacramento, and park information will be obtained from the City of Sacramento. Our method for determining factors of influence will be to measure distances from parks, and then see if income or population density show a pattern with respect to distance to parks. We will use GIS, and specifically ESRI's Spatial Analyst tool to make our decisions. | |
|
Background The City of Sacramento contains over 300 parks of differing varieties. Many of the parks within the city are owned by the City of Sacramento, but not all of them. There are also county and state parks within the boundaries as well. The impetus for doing a study on the parks is that I currently am working for the City of Sacramento Parks and Recreation Department, and I thought that influencing factors of where parks are located would be an interesting topic. Also, working for the Parks and Recreation Department, I have access to data needed to complete the project. The City had data available on the parks as well as census data. As they say, "a bird in the hand is worth two in the bush". In addition to the data availability, I am currently taking a Spatial Analyst class which would allow me to use that tool to complete my project. | |
|
Methods Although there was availability of data to accomplish the task at hand, the data would require some processing before it was useful to the project. Also, decisions would need to be made on which census data to use. For the parks data, we had a shape file that showed all of the parks within the City of Sacramento. But, the parks were of differing types. There were regular city parks that belong to the City such as Caesar Chavez park. Then there are other parks within the city limits that do not belong to the City such as the American River Parkway. In addition, there are parks that the city shares with other entities, like school parks. A school park is one that is owned by a school district, and adjoins a school, but the school gives permission for that park to be used as a city park during certain hours. Finally, there are parks within the shape file that are not yet built. For these parks, the land is set aside for parks, but an actual park has not yet been constructed there. All of these parks are going to be used for the purpose of this study. Also, decisions would need to be made on which census data to use. There were three different types of census data that was available, and they covered three different types of areas. There was census data available at the block level. But, it seemed that that data would be too refined for the purpose of the study. Then there was data available at the track level, but that seemed to be too broad. So, it was decided to use the data at the Sacramento County block group level. The data at the block group level also contain preprocessed fields of median income, and population per block group. That data in raw format would have ranges of incomes for the entire block group, but it is more convenient to use the median income of the block group for the purpose of this project. The only issue with the block group data was that the block groups were not always contained within the City of Sacramento city limits. Since that was a limited issue, it was decided that it would be acceptable. When the block group data was used for the purpose of the project, it was redefined into five separate intervals for both median income, and population. Also, the population was converted to population density by dividing the area of each block group by the total population of the block group. The density was then reclassed into five different intervals. The purpose for using five interval classes in the study is so we can color code the five intervals using colors that are easily distinguishable on a map. 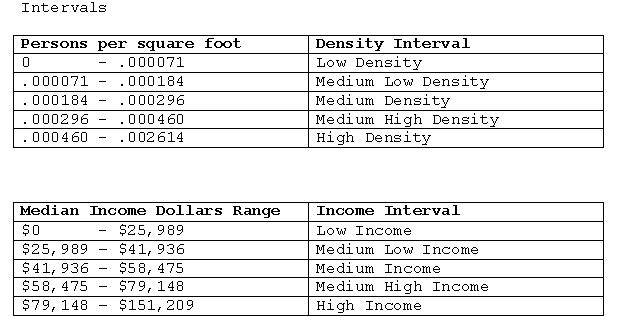
Finally, the parks shape file, median income file, and density file were all converted to raster layers for processing. Each raster grid cell was defined as forty by forty feet for all raster files used in the study for consistency. The raster for the parks file was then used to create a distance from parks raster file of the same grid cell size. With these raster files the Spatial Analyst Zonal Stats tool could then figure out which median income and population densities were closest to parks. A straight line distance to parks was calculated. When calculating these distances, the average distance calculation did not stop at block group boundaries. It calculate average distance without regard to the block group boundaries which were only needed to establish the median income and population density raster files. | |
|
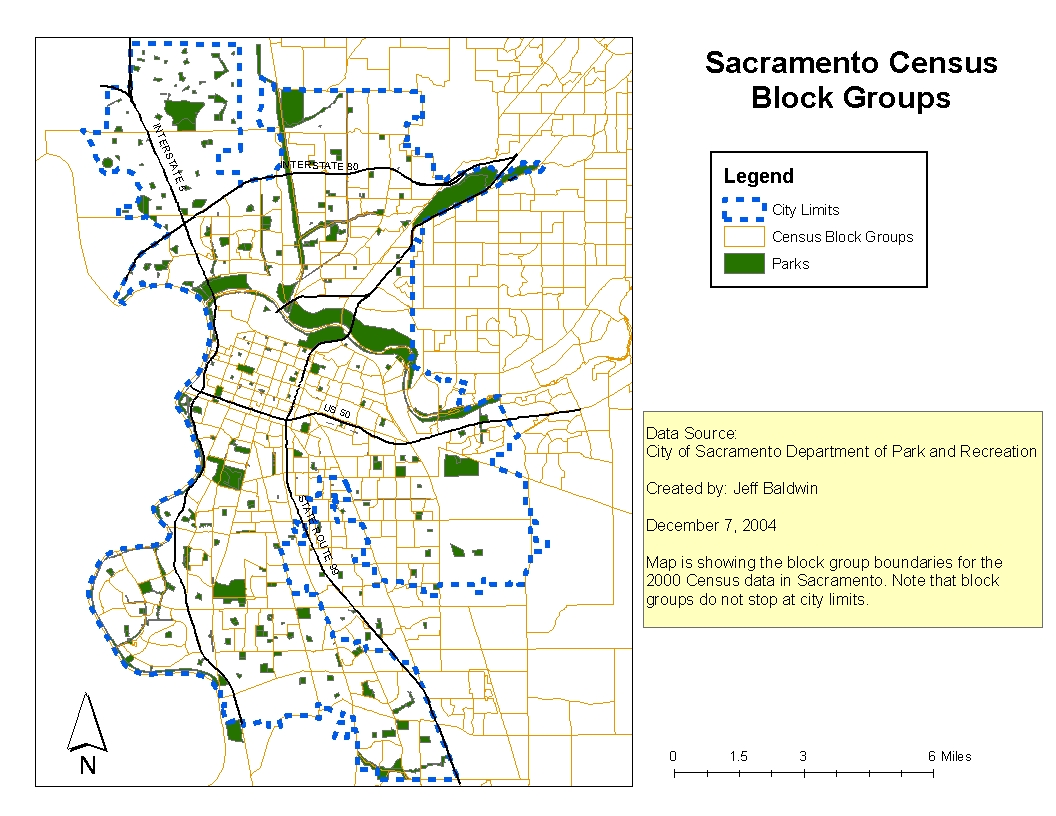
Results There are three maps presented below. One map shows the
census breakout of Sacramento block groups, so you will have an idea of how large these
groups are. The other two maps are the results of the Zonal Stats functions for income,
and population density. | |
|
Figures and Maps Figures below can be clicked to expand maps to full screen.
Use Back key to return.
| |
|
For reference purposes the parks, city
boundary, and some major roads are also included in the map. | |
|
| |
|
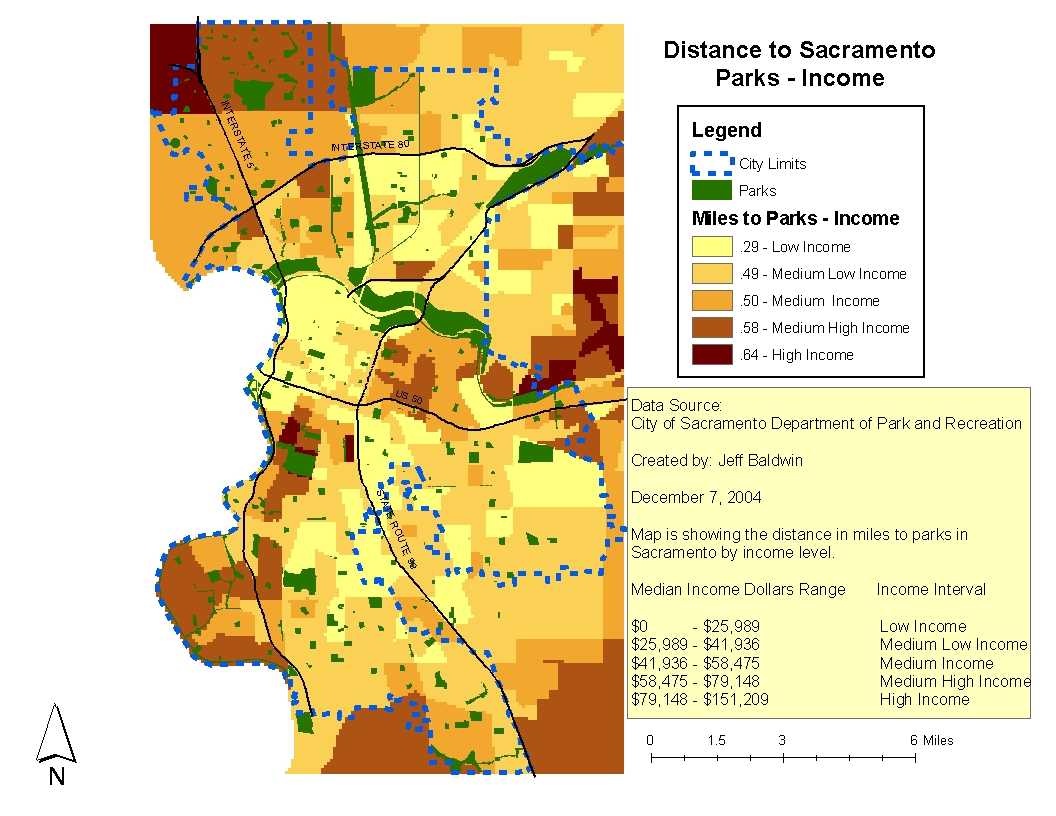
Map shows the average distance in miles from parks in the city. For reference purposes the parks, city
boundary, and some major roads are also included in the map. | |
|
| |
|
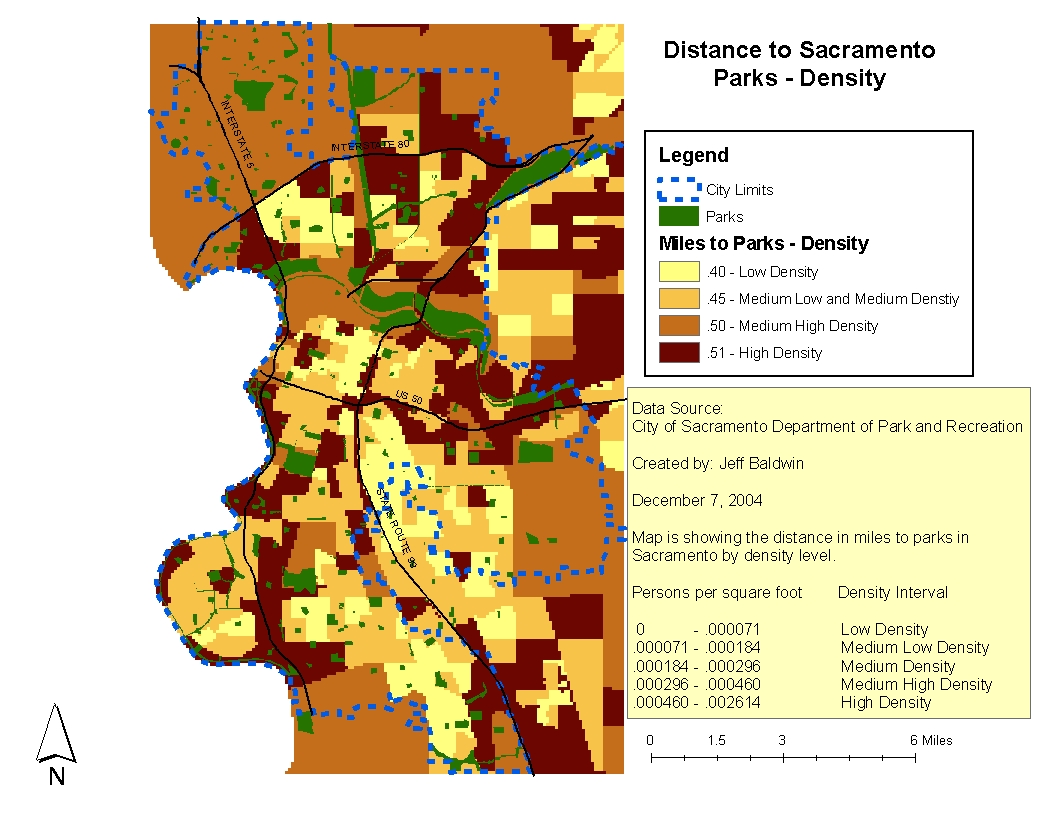
Map shows the average distance in miles from parks in the city. For reference purposes the parks, city
boundary, and some major roads are also included in the map. | |
|
| |
|
Analysis For population density, there is little difference
in distance to parks in our study. The gap in distance to parks from the lowest population
density to the highest population density is only about one tenth of a mile, which does
not seem significant. The medium to high density areas are the closest to the parks,
which seems reasonable. It is nice to have people in areas with higher density closer to
parks so they have access to open spaces. But, overall the density is not a major factor
in how far someone is to a city park. And, everyone in the City of Sacramento lives an
average of one-half a mile from a park.
For median income, there is more of a difference in distance to parks in our study. Low income people in the City of Sacramento live closer to parks than do the higher income folks. It appears as if the lowest incomes are twice as close to parks as the highest income people. Yet, the spread in distance does not seem to be unreasonable for any of the City of Sacramento residents. The lowest income people are within about a quarter of a mile from city parks. The highest income people are still only about a little more than half a mile from city parks. | |
|
Conclusions The final conclusion for our study is that
income makes more of a difference than population density when measuring the average
distance to parks for Sacramento residents. And, that the lowest income residents live
the closest to the parks on average. Yet, using either population density or median
income, no City of Sacramento residents live more the .64 miles from a park on average.
It should be noted that the average distance calculations we are using is a straight line formula. So, actual travel distance may be slightly higher due to the need of traveling along public streets to get to a park. Also, the study does not take into consideration the size of parks, only the distance to a park. So, further studies could be conducted using the size of parks, and comparing that to the population density and median incomes. | |
|
References No existing background material was found using a
google search on the phase "distance to parks in Sacramento, Ca". It is concluded that this
is an original study, and no reference material is available. | |