Title
Bear Fire Data Search
AuthorInformation
Erik Olsen
American River College, Geog350: Data Acquisition in GIS; Fall 2004
Contact Information:
dc20cc@aol.com
Abstract
Not being familiar with Spatial Analyst restricted using much of the data I located. I’m sure someone with a forestry background would have gained more information from the field surveys. Also some of the features of ArcMap made trying to compare data very difficult. Maybe after a Spatial Analyst class it will be possible..
Introduction
In the last 10 years we, the tax payers of
the United States, have spent over 16 billion dollars on wildfire suppression.
During this period almost 50 million acres of California have gone up in flames.
(see Table01). The causes range from natural to man caused catastrophes. Arson,
carelessness, and prescribed burns getting out of control can be attributed to
humans and lightning would be the natural cause.
Table01 Fires by agency
During August of 2004, a human caused fire near Lake Shasta cost
the tax payers $8.8 million for fire suppression costs while it burned 10,484
acres,80 residences and 30 outbuildings (CDF website). This fire came within
a mile of our property on Woodman Hill just east of Redding, California. While
monitoring the fires progress through the California Department of Forestry
& Fire Protection (CDF) website I came across data and mapped previous fires in our
area.
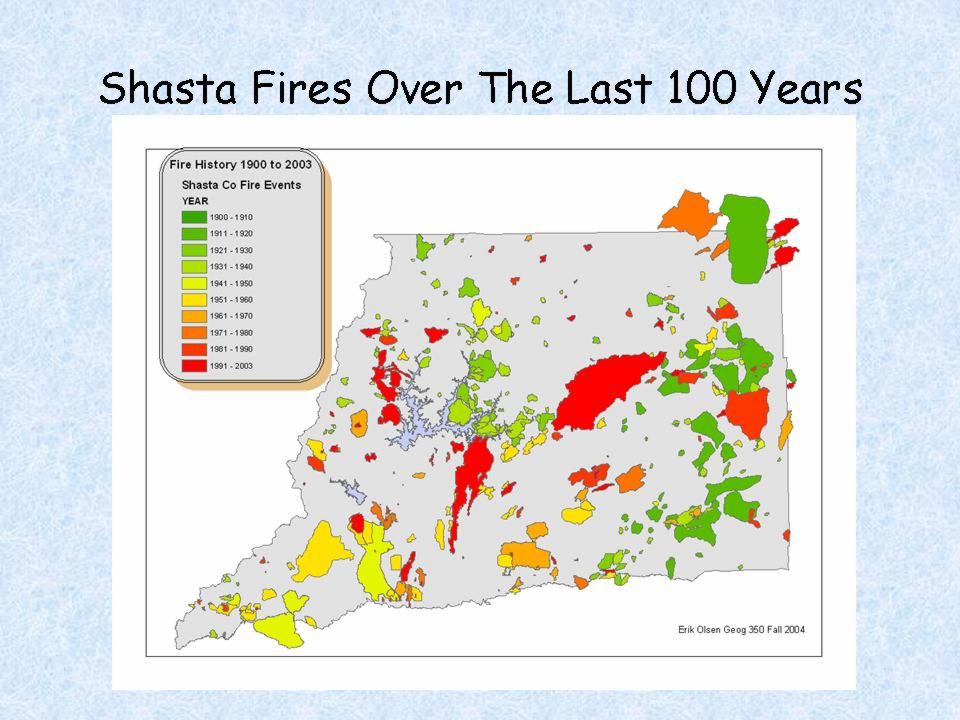
Shasta county fires over the last century
In 2000 my wife and I purchased land in Shasta County for our retirement home, during the evening news
a report came on about the Bear fire near Lake Shasta. When I checked the CDF
Web site it showed the fire being about 6 miles west of our property, I wasn't
too concerned but to be on the safe side I thought it would be a good idea to
remove some of our belongings from our property. While driving up Friday morning
I heard a news report on the radio that the area North of Hiway 299 and East of
Dry Creek had been evacuated, which is where our property is located. This
disaster led me into this project on the search for data about wild fires in Shasta county.
Methods
Data was collected from a variety of sources, the internet being the largest source of information, the
base maps for the project came from ESRI CDs, and the field survey data collection was
done be myself. This involved selecting survey points based on area conditions,
the points were going to be selected on fire models, hazards threats, and
ranking from FRAP websites, along with other data I could find. A major setback occurred when most of the data I found turned out to be in grid format! Not
being familiar with Spatial Analyst it was pretty much unusable for me. I was
able to locate some shape file data of the area but this was too low of a
resolution to be useful, each polygon covered about 652,000,000 square meters,
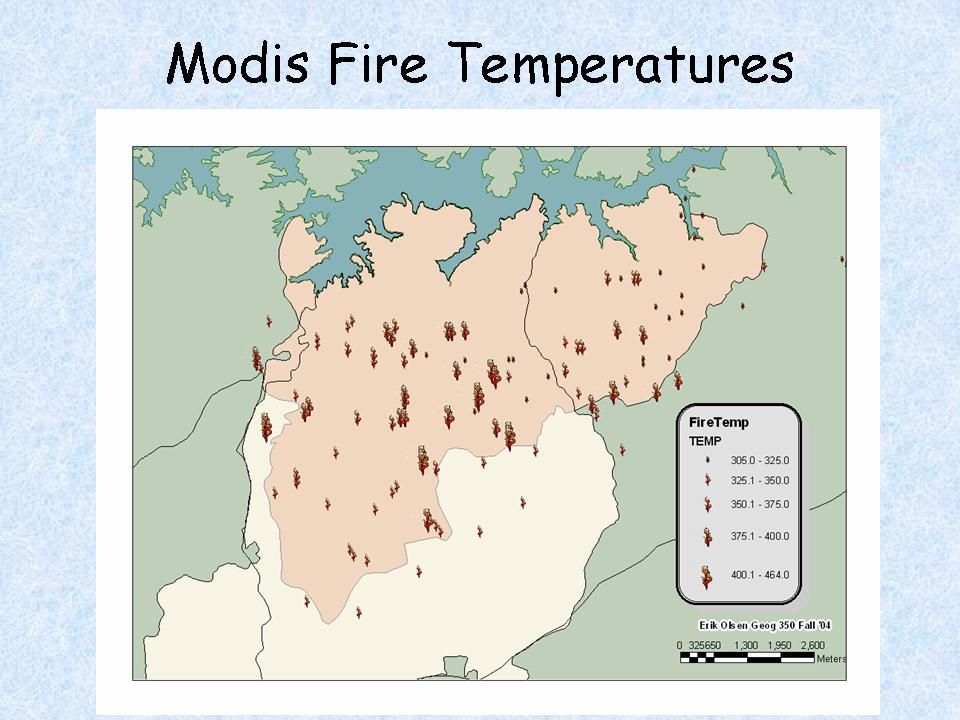
2.5km x.2.5km. A site that was interesting used MODIS thermal imaging, this site had data on temperatures and images of the Earths surface. I decided that the coordinates from
theUSDA RSAC site,that uses this technology, would be the survey points.
MODIS fire temperature and point locations
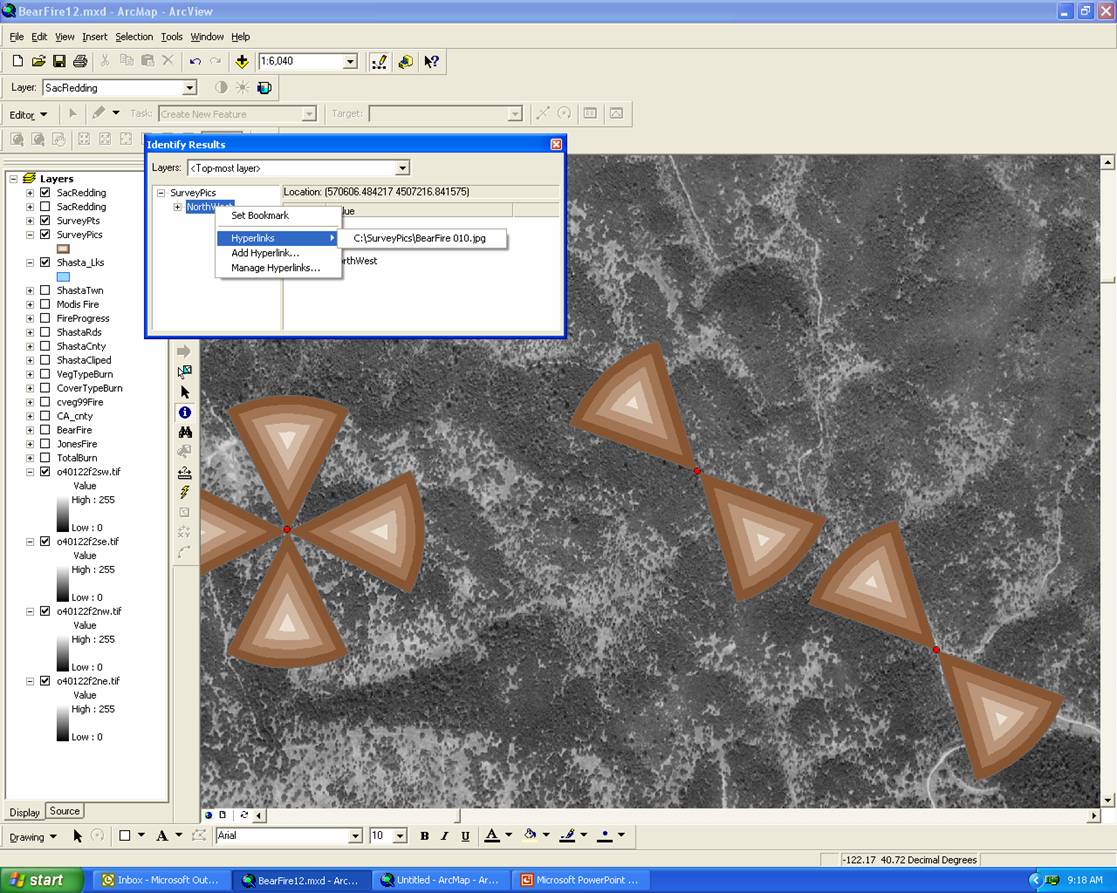 Coordinates were located and points recorded using a Garmin GPS76s, on loan from ARC’s GIS program. Image data for the locations was collected on a Canon A40 camera. After the first trip collecting data, where images were collected randomly I decided that each survey point would have 4 image files, the first taken facing North, then East, South, and West. Also to standardize data each image was taken with the camera "zoomed all the way out". This allowed the images to be referenced to its shape file fairly easily, which was drawn to the cameras approximate field of view. I calculated this by taking an image perpendicular to my fence at 10ft and measuring the width of the boards that were captured in the image, which was approximately 10.5ft. The original fire temperature file contained data for the entire United States for the year 2004, I used ArcMap to clip the points to a shape file of the Bear and Jones fire perimeters. The same clipping procedure was used on most of the other data as it covered either Shasta county or the whole state of California, reducing the file size allowed ArcMap to respond quicker. The fire temperature points were converted from .dbf to .gpx using Excel and notepad, this allowed the use of EasyGPS, using the .gpx file format, to upload the points into the Garmin GPS76s.
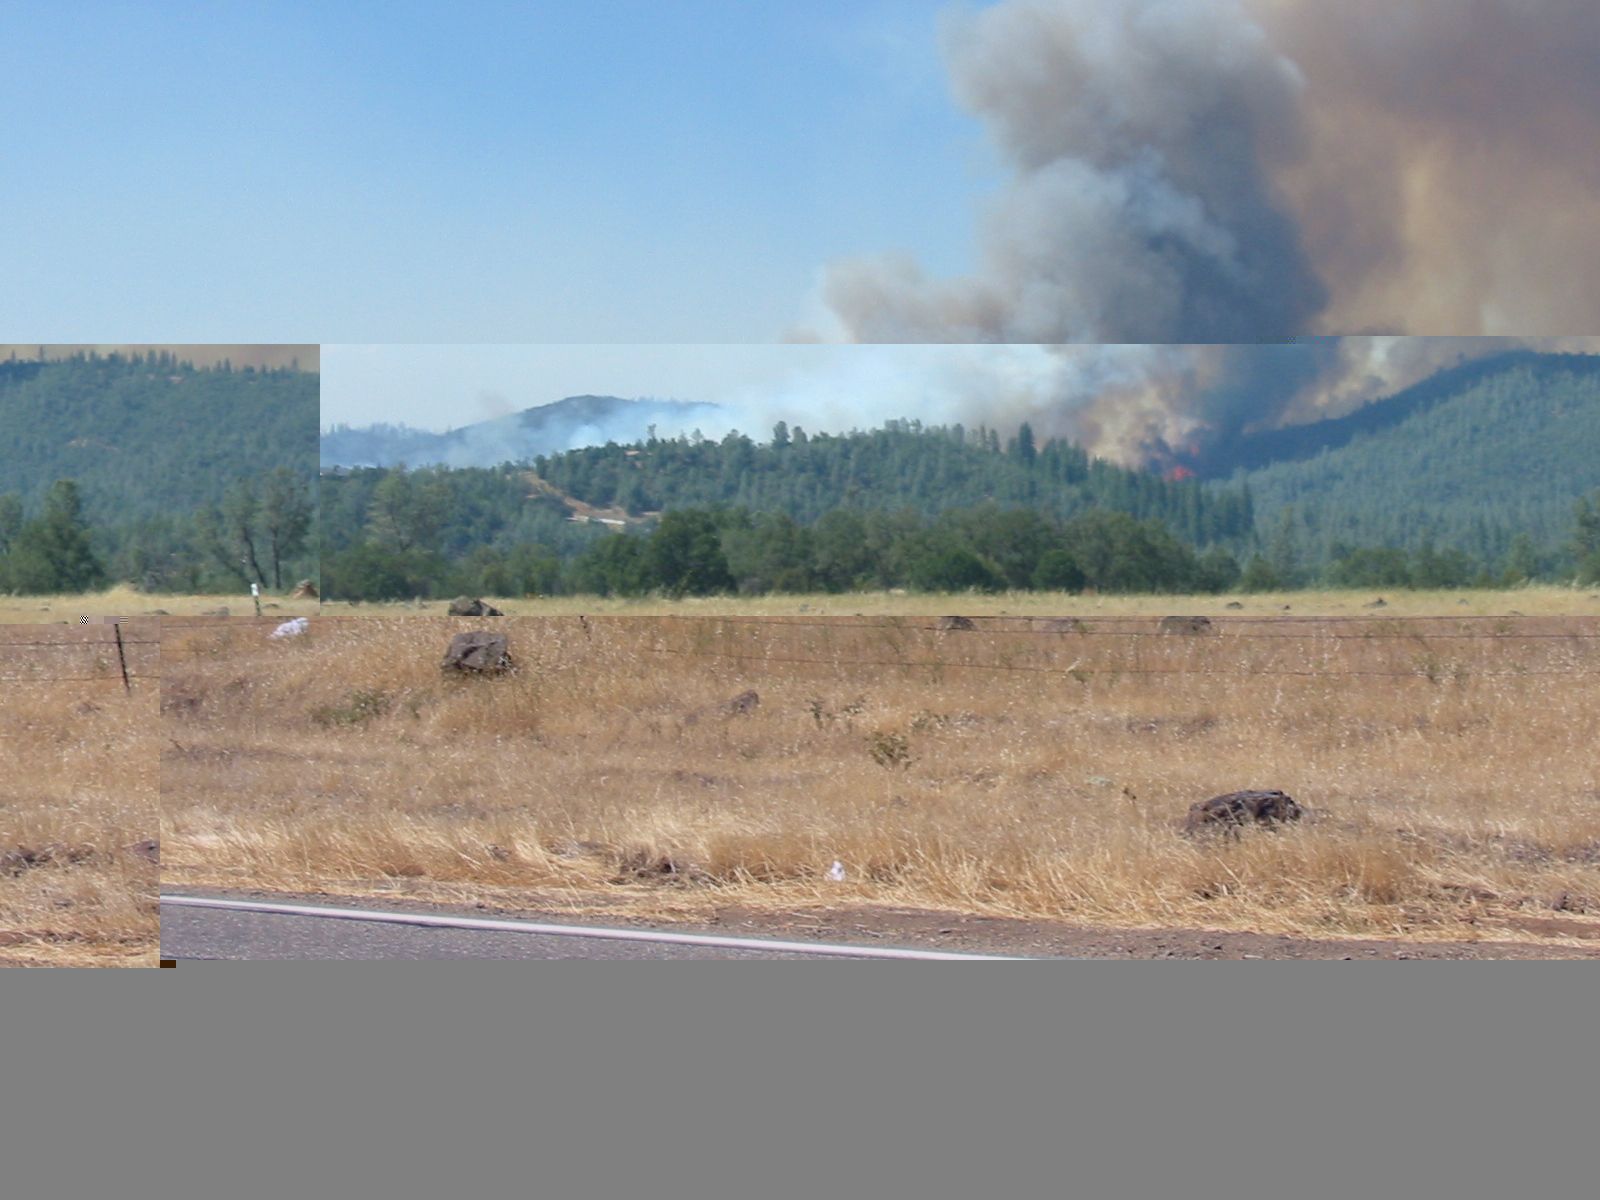
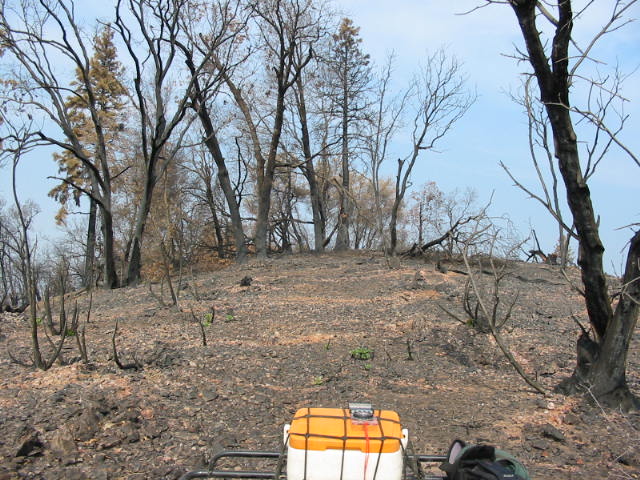
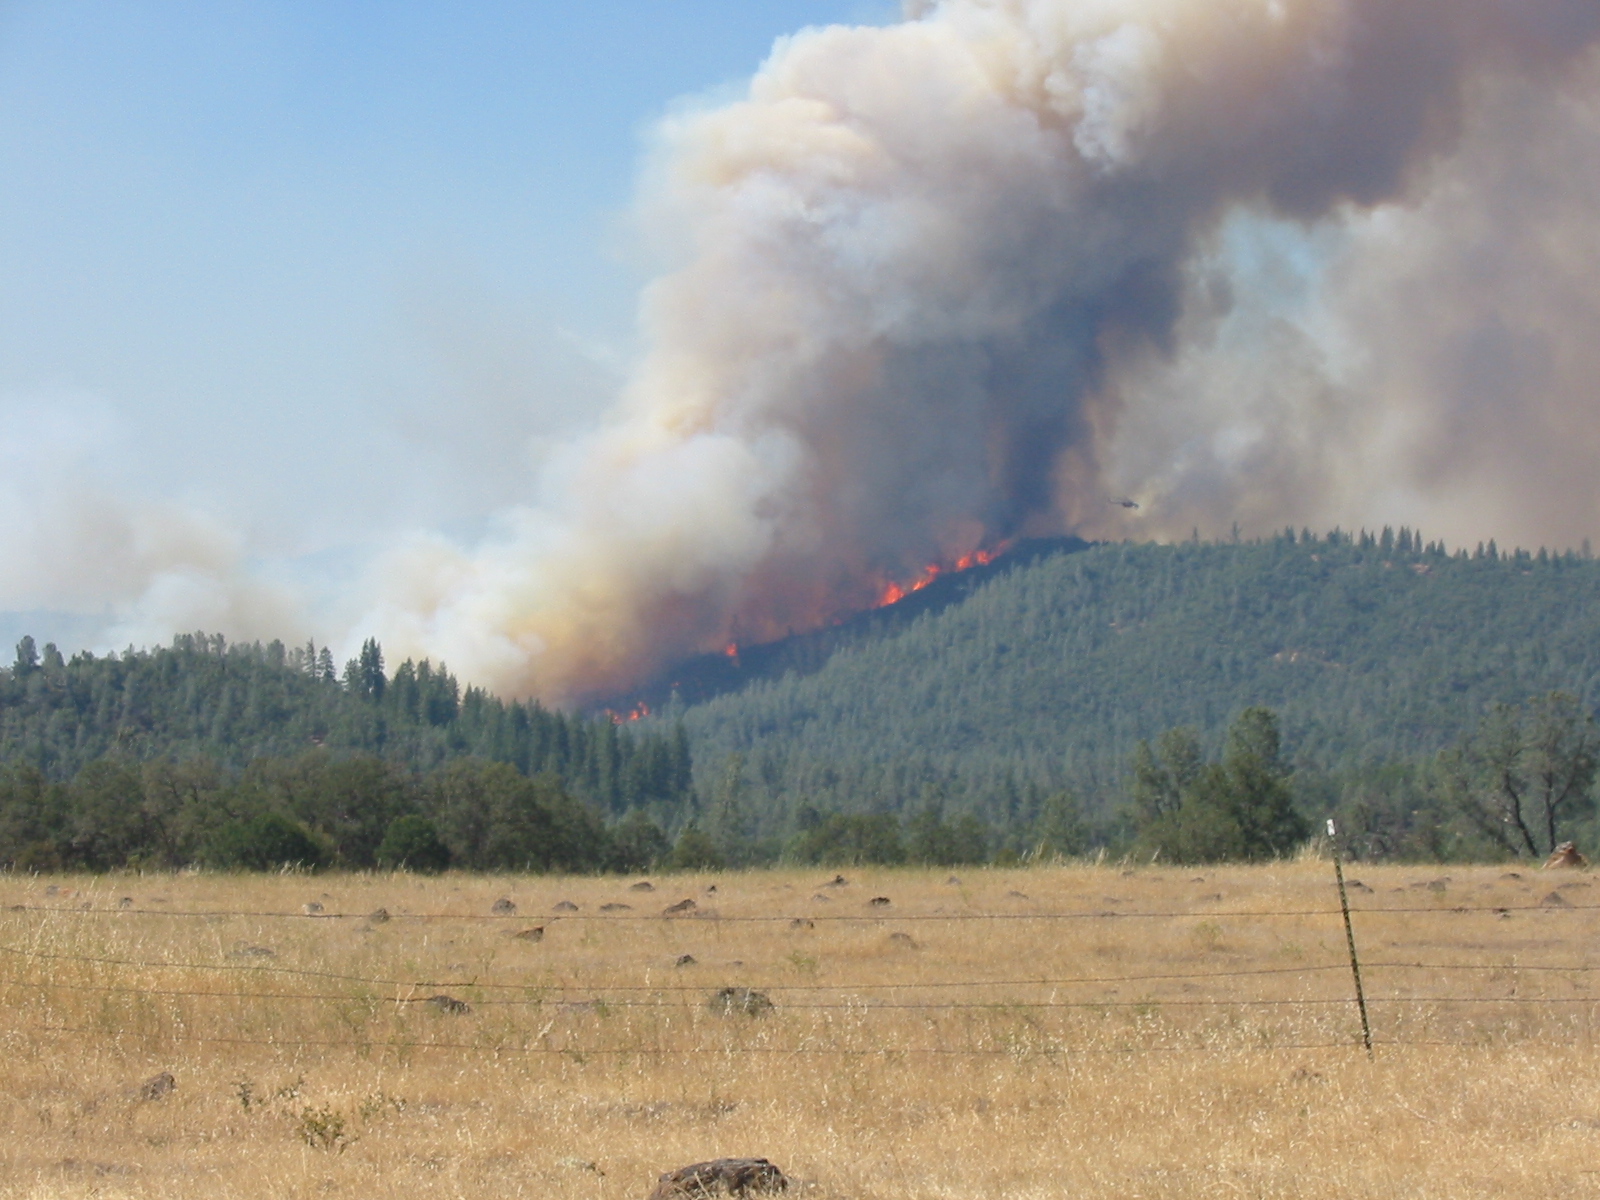 A major set back occurred in data collection on October 23, I thought it might be interesting to add the fire-breaks that were cut during August trying to control the fires progress. The left image was taken just as the fire reached the bottom of a fire-break that had been cut up the ridge to the north (right), the right image was taken approximately 1 minute later as the fire burned past the break and up the ridge. I had planned to save the fire-breaks as tracks on the Garmin and add as a line file to the project. I was interested to see why they chose the locations for the fire-breaks. I had just begun recording the track for the just mentioned fire-break when the front wheel of my ATV hit a soft spot in a water-break threw me off and rolled over on top of me. This put me out of commission for field data collection for over a month. Other obstacles to the field surveys was quite a bit of the land that burned is private property and some of the people living back there don’t take kindly to people coming on their land and taking pictures, even if it is for a project in Paul Veisze’s GIS data acquisition class. Another problem I encountered after healing enough to ride the Forest Service started erosion
control projects on Lake Shasta's watershed eliminating, with out some serious leg work, access to more area.
A major set back occurred in data collection on October 23, I thought it might be interesting to add the fire-breaks that were cut during August trying to control the fires progress. The left image was taken just as the fire reached the bottom of a fire-break that had been cut up the ridge to the north (right), the right image was taken approximately 1 minute later as the fire burned past the break and up the ridge. I had planned to save the fire-breaks as tracks on the Garmin and add as a line file to the project. I was interested to see why they chose the locations for the fire-breaks. I had just begun recording the track for the just mentioned fire-break when the front wheel of my ATV hit a soft spot in a water-break threw me off and rolled over on top of me. This put me out of commission for field data collection for over a month. Other obstacles to the field surveys was quite a bit of the land that burned is private property and some of the people living back there don’t take kindly to people coming on their land and taking pictures, even if it is for a project in Paul Veisze’s GIS data acquisition class. Another problem I encountered after healing enough to ride the Forest Service started erosion
control projects on Lake Shasta's watershed eliminating, with out some serious leg work, access to more area.
Analysis
Aside from not being able to locate current data one of the hardest or maybe most frustrating part of the project was this WEB page.
Conclusion
There is quite a bit of data available for our forests but due to the rapidly changing environment, from weather and fires, most of what I found was not applicable to the project. The vegetation data, or the data I located, was last updated in 1999 about the time of the Jones fire and I couldn’t tell if it was pre or post fire. Last winter the area around Redding received its first major snow fall, by Redding standards, in 18 years the weight of the snow brought down many oaks and mazanita that contributed to the fuel source for the fire. I didn’t see this addressed in any of the data I found but heard the fire personal mention it in interviews. I really didn’t notice any patterns in the fires paths, severity, or types vegetation that burned.
References
USDA ForestService Remote Sensing Applications Center Oct 2004
http://activefiremaps.fs.fed.us/fireptdata.php
Fire and Resource Assessment Program, California Department of Forestry and Fire Protection Oct 2004
http://frap.cdf.ca.gov/index.htm
USDA Forest Service - Remote Sensing Lab, Ecosystem Planning Oct 2004
http://www.fs.fed.us/r5/rsl/clearinghouse/gis-download.shtml
California Dept. of Forestry and Fire Protection, Fire and Resource Assessment Program Oct 2004
http://frap.cdf.ca.gov/data/frapgisdata/select.asp>
USDA ForestService RSAC MODIS Active Fire Mapping Program Oct 2004
http://activefiremaps.fs.fed.us/
USDA ForestService GIS Clearing House Oct 2004
http://www.fs.fed.us/r5/rsl/clearinghouse/gis-download.shtml>
USGS Fire Planning and Mapping Tools Oct 2004
http://wildfire.cr.usgs.gov/fire_planning/viewer.htm