TITLE Making Healthy Choices in a Fast Food World | |||
|
AUTHOR Connie Stark American River College, Geography 350: Data Acquisition in GIS; Fall 2004 | |||
|
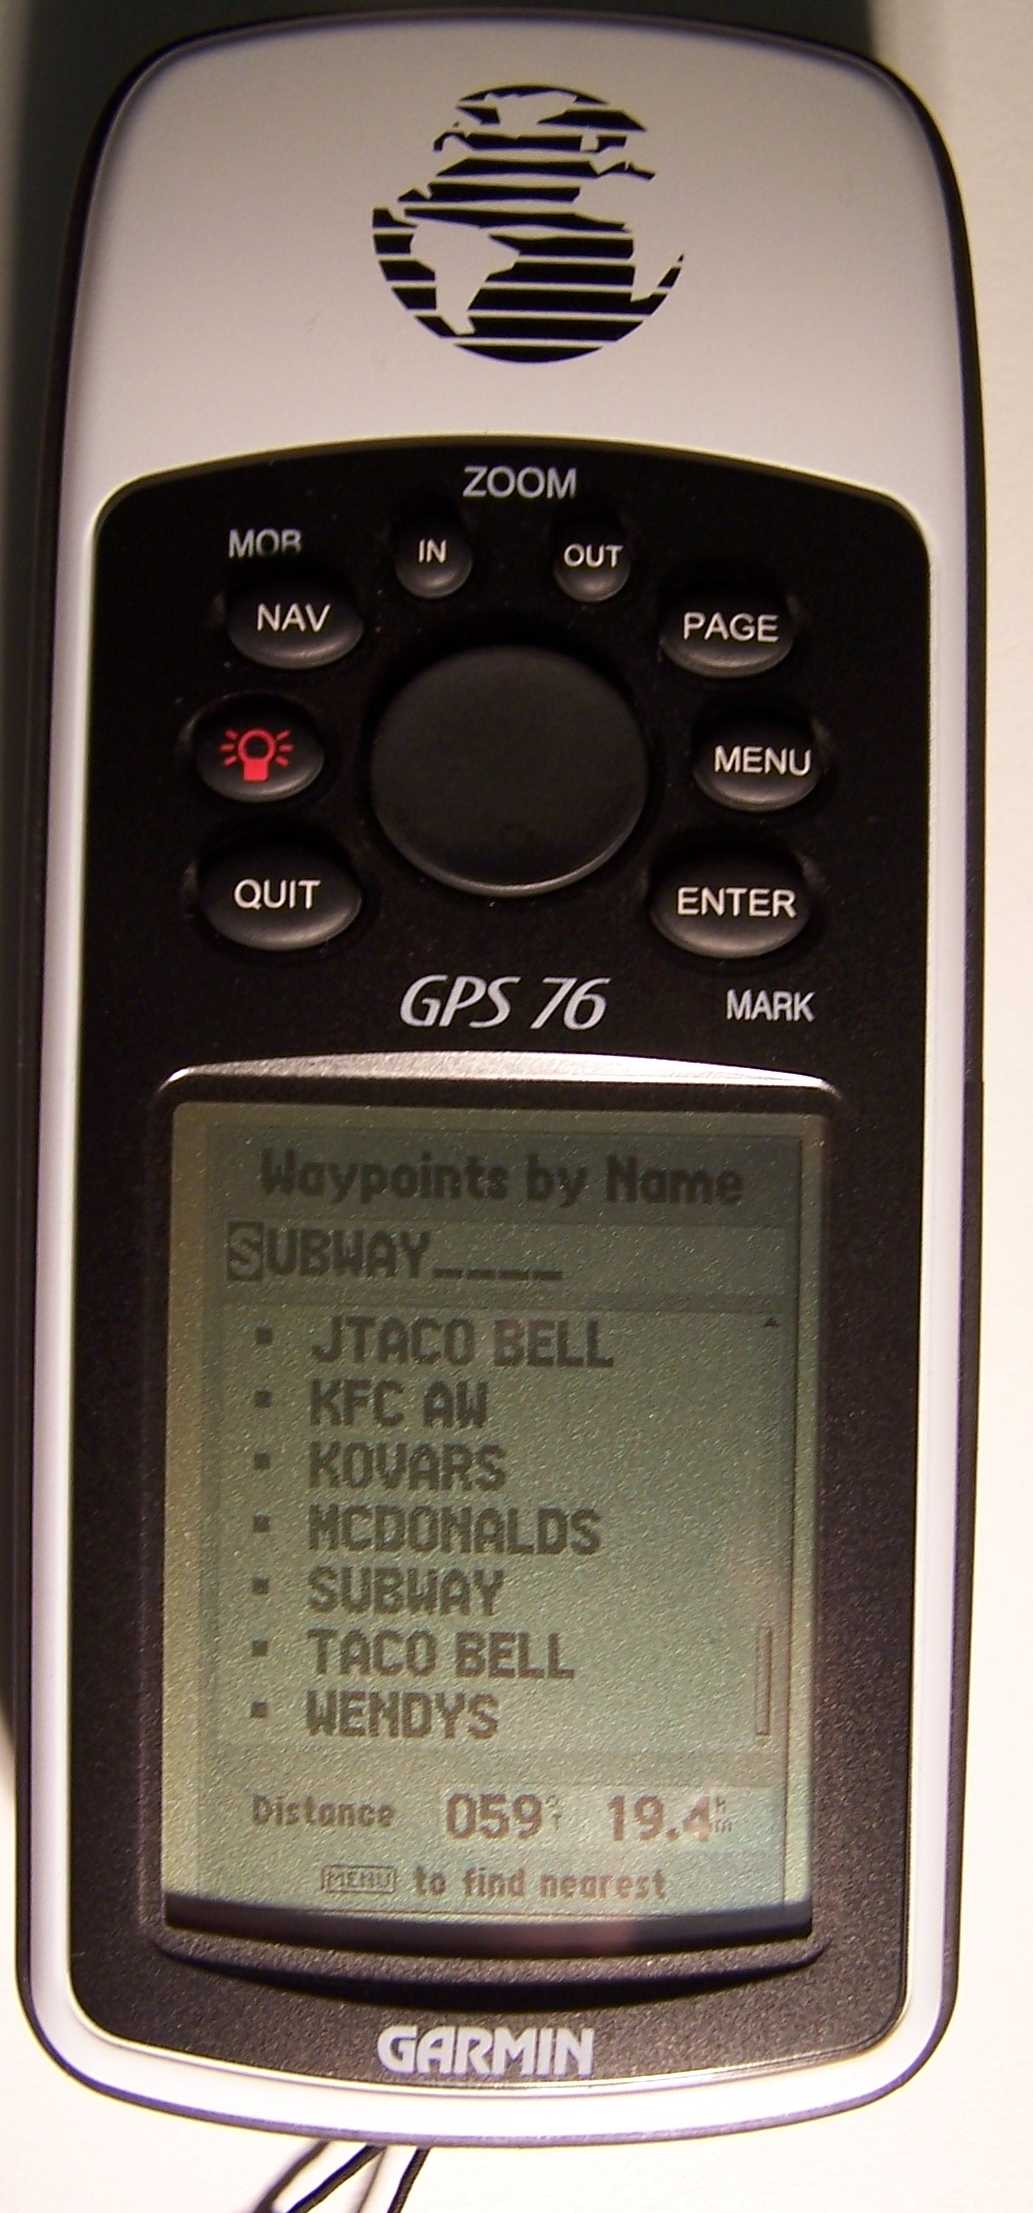
ABSTRACT There are a variety of different fast food restaurants on my children’s way to and from work. The focus of this project was to map out all the restaurants on their routes and see what healthy alternatives they had to offer. For this project I used the Garmin GPS 76 to mark waypoints, ArcMap 9 to prepare the map, researched the individual restaurant’s websites, and reviewed some literature on the subject of fast food nutrition. | |||
|
INTRODUCTION Did you have time for dinner before you came to class? Where did you go? What did you have? I get off work at 5:00 p.m. and class starts at 6:00 p.m., which doesn’t allow much time for a sit down dinner. I try to pack something from home, but sometimes nothing looks enticing or I just don’t have the time. When trying to decide where to go for a quick meal, I pass several fast food restaurants, trying to remember if they have offer salads or low-carb meals on their menu. While waiting in line at the drive-thru, I wonder what my kids, who also have hectic schedules, are eating. My teenage boy works three nights a week and my daughter, who is attending college and working, is never home for dinner. In a perfect world, they would be packing nutritional snacks and leftovers, salads and low fat turkey sandwiches. But alas, like their mother, they sometimes don’t have the time or inclination to do so. Fortunately, a lot of fast food establishments have included healthy alternatives to their menus, like salads, grilled chicken entrees and even deli style sandwiches. On their way to work, my kids pass a large variety of the standard fast food establishments, but out of habit, only opt for particular ones. They both have their favorites and have developed certain eating routines and habits. I really don’t think they realize what all their options are. I have decided to map out all the fast food establishments on their way to work. To make my kids more aware of the dining options at these locations, I will include tables with some standard menu items, but will emphasize some of the healthier alternatives. Even though the intent of this paper is to help my children make more conscientious choices, it should benefit you too. Since most of the fast food chains are represented in this paper, you will be able to locate the one you go to for an occasional lunch or dinner. Furthermore, you will be able refer to the tables and links to look up restaurant menus, healthy alternatives and the nutritional values of different meals. | |||
|
BACKGROUND The U.S. Department of Agriculture bases its guidelines for calorie intake on one’s age, gender and activity level. The USDA and many health organizations also recommend eating no more than 30 percent of calories from fat. - 1,600 calories per day and 53 grams of fat - 2,200 calories per day and 73 grams of fat - 2,800 calories per day and 93 grams of fat. Michael Jacobson and the Center for Science and Public Interest have been at the forefront of the fast-food reform movement, campaigning for healthier preparation of food and for labels that tell consumers what they are eating. In The Completely Revised and Updated Fast-Food Guide, 1991 he reviews several fast food chains and gives his recommendations. Mary Dondersloot, R.D. the founder and director of Personal Nutrition Management in San Diego California also gives her recommendations in The Fast Food Diet Quick and Healthy Eating at Home and on the Go, 1991. | |||
|
METHODS
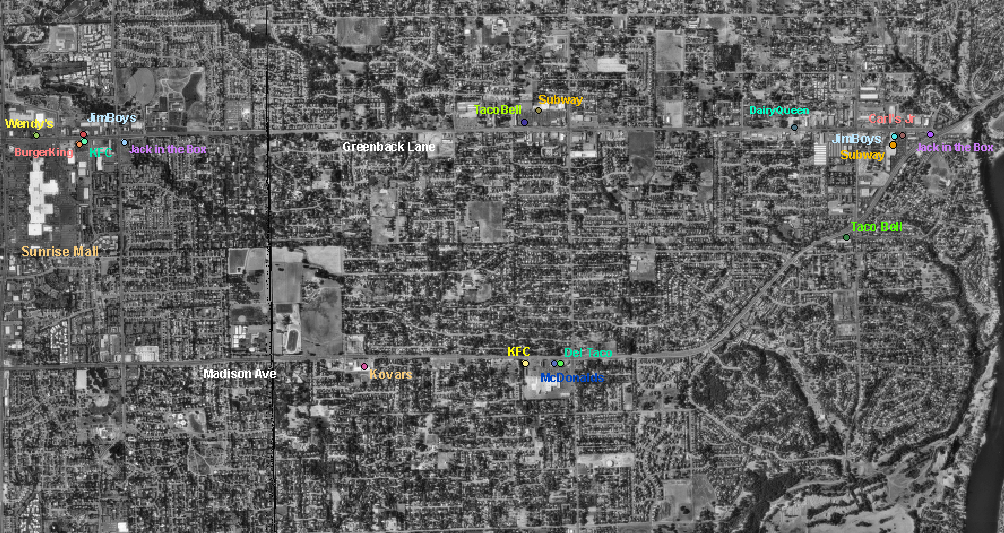
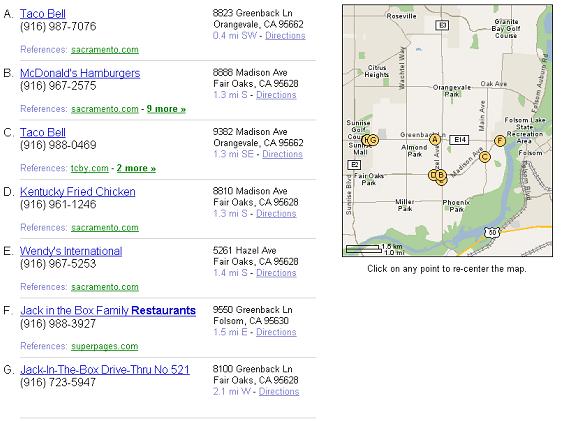
First I gathered GPS Waypoints with the GPS 76 of all fast food restaurants on my children’s way to and from work. After taking a waypoint at a restaurant, I went inside and asked for a nutrition chart. Some locations had them, others didn’t, but I was told that they were posted on-line. My next step was to download my waypoints and create a map. The Expert GPS program was very easy to use, but didn’t give me many options on creating and changing the map. Due to the close location of some restaurants, some labels were right on top of each other, so I decided to use the ArcMap 9 program. As shown in class, I created a table with the GPS’ longitude and latitude readings and converted it to a database file and then to a shape file using the ‘Display XY data’. Now I needed to find an aerial for my background so my waypoint shape file would make sense. Since our company has an account with GIS Data Depot, I thought that would be the best place to download the digital orthophotos (DOQQs) and get accurate data. In the California Index to Topographic and other Map Coverage I looked up the area I mapped to find the 7.5 Minute Quadrangle numbers needed to download the correct quads, in this case 38121f2 and 38121e2. After downloading the NE, NW, SE and SW files associated with the quads, I added them along with the projection files to my map. There were some black frames around subsections of the quads, blackening out some strategic areas. I had to call our GIS specialist in Seattle, Andy Bury, for assistance. He informed me that the order of the quads could be causing this and to right click on the quad, go to symbology tab, check the ‘Display Background’ box, make sure the value is at 0 and click on ‘No Background’. After cleaning up the black frames around the quads, I found my waypoints matched up beautifully, and I formatted them along with their labels. I also labeled the two major streets Madison and Greenback and my kids places of employment. I checked if there was a way to get a map of the restaurants on line and compare results. I did find a website, Google Local, that maps out the different restaurants in a given area. When I entered our city and zip code, it did provide a map and addresses of some of the restaurants but were missing quite a few. As mentioned above, I went to the individual restaurants and on line to get nutrition charts on their menu items. Incorporating all of the nutrition charts would have not only made this report difficult to read, but would have also effected the size of the file and its opening speed. Instead, I created tables with selected items from the menu and provided direct links to the nutrition charts. Then I compared selected items, listing those high in calories and fat, to healthier alternatives and listing options on how to reduce calorie and fat intake. When reviewing the websites, I noticed that they had store locators, so I included direct links to those as well so the reader could locate a restaurant near their home, work or way to school. To round out my research, I reviewed articles on-line and checked on books on the subject at the library. | |||
|
Map of Fast Food Locations On Route
| |||
|
Google Locator: Fast Food Locations
|
RESULTS
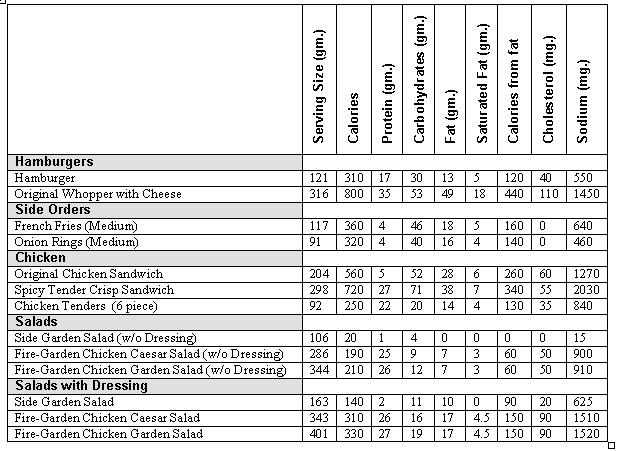
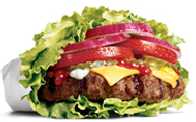
The healthier option would be to go with their Chicken sandwich, flame-broiled chicken white meat served on a bun with lettuce and slice tomato, and has only 267 calories and less than 2 teaspoons fat. Adding a side salad (no dressing) and orange juice to the BK Broiler chicken sandwich gives you a satisfying 374-calorie meal. Another healthy option, of course, would be their salads with low fat dressing: Fire-grilled Chicken Caesar salad, fire-grilled Shrimp Caesar salad, Fire-Grilled Chicken Garden salad or their Fire-grilled shrimp salad. For those of you who are counting carbs, Burger King offers any of their Whopper burgers and chicken sandwiches served with lettuce, tomato and 3g carb sauce (without the bun, mayo or ketchup). All of these sandwiches are below 10g of carbs.
|
||
Dairy Queen
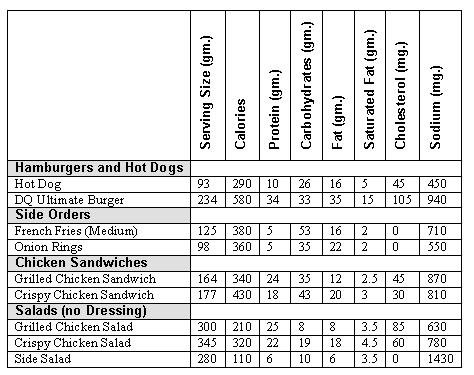
Eating healthier got a lot easier when the Grilled Chicken Fillet sandwich was added to the menu. This 300-calorie sandwich comes with lettuce, tomato, and reduced-calorie mayonnaise. Just 24% of its calories come from fat. The most nutritious sandwich, but not offered at all restaurants, is the BBQ Beef sandwich and weighs less than a regular McDonald’s hamburger. It only has 225 calories and 1 teaspoon of fat. If you crave a burger, Dairy Queen will give you a 340-calorie single or 490-calorie double; adding cheese would increase the calories to 540. Then, like the other restaurants, there is always the ultimate burger. In Dairy Queen’s case it is the DQ Ultimate Burger, with 580 calories, 11 teaspoons of fat is one of the unhealthiest items in the restaurant. Their regular hot dogs provide 4 teaspoons of fat and have a moderate 290-calorie count. The Quarter Pounder, however, is loaded with sodium and 9 teaspoons of fat. Then there are the beverages and desserts that have made Dairy Queen famous. The regular chocolate shake has 540 calories and a large vanilla offers 600 calories- equivalent to more than 3 cans of coke. With banana splits with 510 calories, or even a regular vanilla cone at 230 calories, it is not hard to construct a ridiculously fattening meal at Dairy Queen. Dairy Queen offers the following salads: Grilled chicken salad, Crispy chicken salad and a side salad.
| |||
Jack in the Box
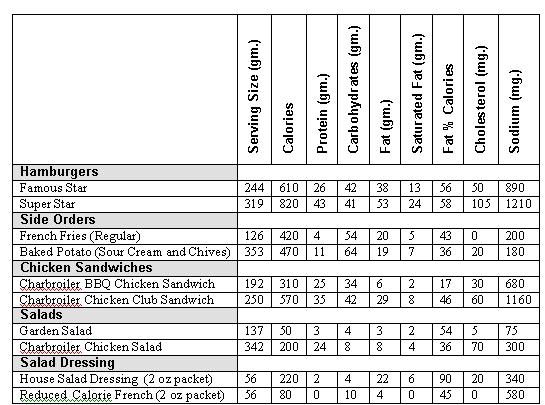
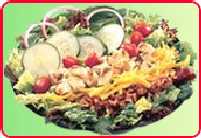
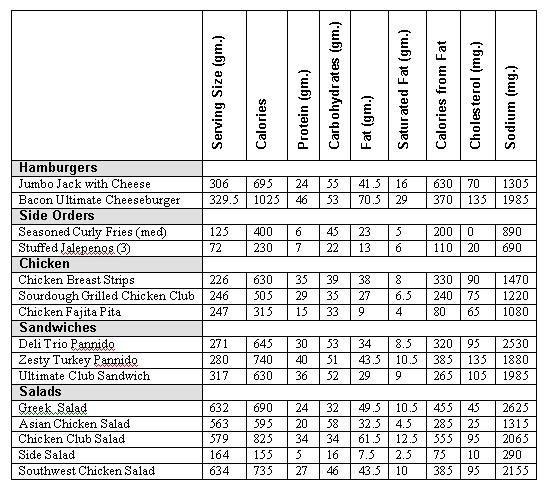
Among the salads, the side salad is a nice-size portion that has only 51 calories. The other salads pack a fair amount of calories, sodium, and fat. Surprisingly, the Chicken Club salad has 825 calories and gets 67% of them from fat.
| |||
KFC
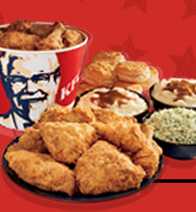
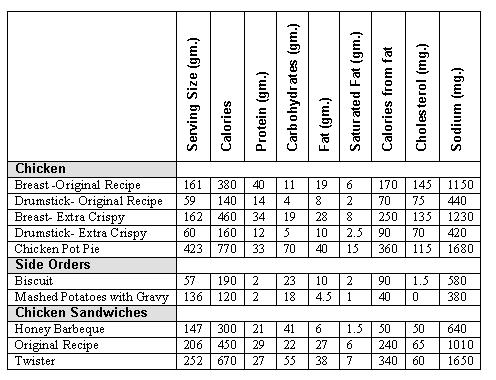
Recommended: the Honey Barbeque sandwich with 300 calories, and only 50 calories from fat, is one of the healthiest entrees on the menu.
| |||
McDonald’s
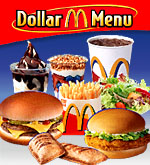
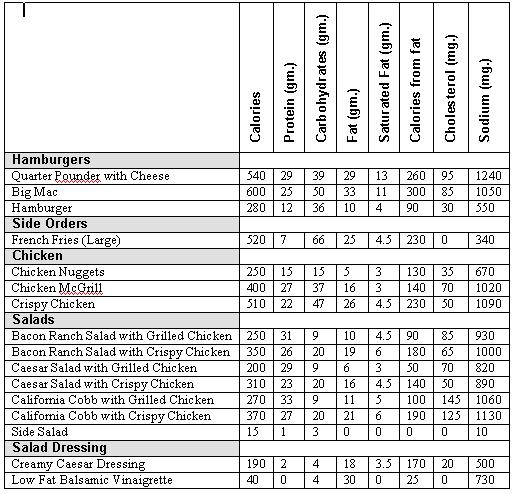
McDonald’s offers several prepackaged salads, but you have to be careful here as well. Your best bet would be to order the Grilled Chicken Salads: Bacon Ranch Salad, The Caesar Salad or the California Cobb Salad with Grilled Chicken. They offer 50% less fat from calories than their crispy chicken alternatives. Several regular and reduced-calorie dressings are available, the Low Fat Balsamic Vinaigrette is the lowest in calories with only 40.
| |||
Subway
| |||
Taco Bell
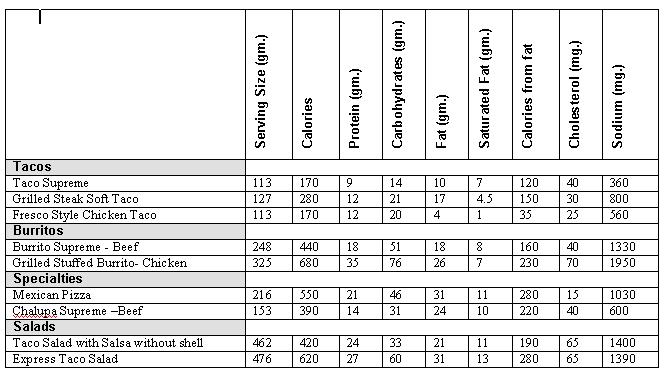
Taco Bell’s new fresco style chicken and steak tacos are among the best choices on the menu. They are made with several chunks of grilled meat, along with the standard shredded lettuce, cheese and sauce in a soft (non-fried) flour tortilla. Surprisingly far and away the fattiest food is the Taco Salad, proving that “salad” doesn’t necessarily mean low-cal. More than half of its 790 calories comes from 14 teaspoons of fat. You can cut calories and fat by skipping the shell.
| |||
Wendy's
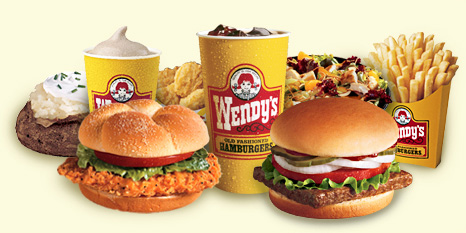
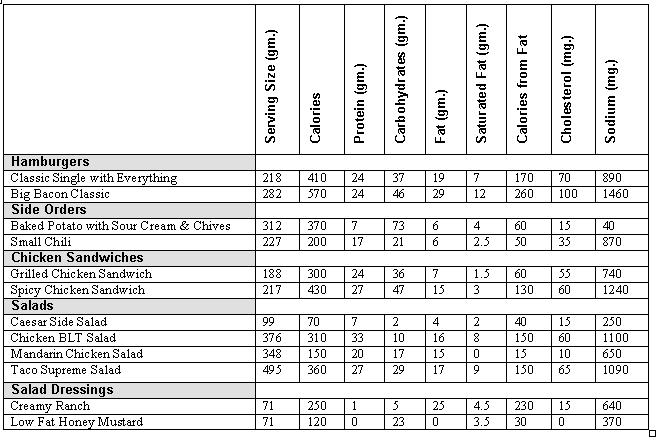
Wendy’s does offer of healthy alternatives. Their Garden Sensations Salads would be a good choice, with any of their three lighter dressings. Wendy’s also offers a plain baked potato that’s big, hot, filling and good for you. It provides 50% of the U.S. RDA for vitamin C and 20% of the iron allowance in just 284 calories. At your request, Wendy’s will heap the potatoes with all sorts of things, including vitamin- and mineral- rich cheese and broccoli. Consider some meal ideas from old favorites - all under 510 calories and under 10 grams of fat (when served with a diet soft drink):
| |||
|
ANALYSIS I had great success with the Garmin GPS 76 Unit. After taking the waypoints, and downloading them with Expert GPS, I was able to determine that my waypoints were very accurate when comparing them to the aerial map background provided. Unfortunately, I was unable to manipulate the labels, which were on top of each other. Not wanting to pay the additional cost for the program that would allow me to download these waypoints onto ArcMap, I just entered the coordinates in manually and converted them into a shape file. (At this time I was not aware of the free VB Garmin download that the California Department of Fish and Game offered on their website). Another problem I ran into preparing my map was when downloading the digital orthoquads for from the GIS Data Depot, a website used by the company I work for. When adding the subsections needed to show the area of my waypoints, there were large black frames around the subsections that needed to be cleaned up. I had to call our GIS specialist for assistance. You will still be able to see a thin vertical seam on the map, but by manipulating the sequence of the orthoquads and background box, I was able to remove most of the frame. In ArcMap I was successfully able to annotate my labels and place them so one could read the individual restaurant names. (After discussing the problems with the orthoquad frames with a classmate, he referred me to a website that has seamless aerials: www.seemless.usgs.gov. Unfortunately, there was no time to research this website and recreate the map. Once I have had the time check the quality of the aerials, the difficulty of downloading them onto the computer and their compatibility with ArcMap, I hope to be able to make a recommendation to our GIS department to use this site instead of GIS Data Depot. Fast Food Research: Evaluating the nutritional values of food was more complicated than I thought. A certain food might be low in cholesterol, but high in sodium. Or it might me high in vitamins and minerals, but oozing with fat. Not being a nutritionist, there was a lot of literature to absorb and try to make sense of. The best alterative for this project was to display popular menu items in easy to read tables, taking the nutritional values from the nutritional guides provided by the restaurants. Once that was completed I relied on recommendations made by Michael F Jacobsen, Mary Donkersloot or by the fast food restaurant websites themselves. | |||
|
CONCLUSIONS I don’t want to urge anyone to eat at a fast food restaurant. It is much healthier and cost less money to pack a lunch, or pick up a salad, fruit or yogurt at the supermarket. But when you do find yourself in a hurry and in line at the drive-thru, I hope that the information provided will help you to make healthier choices. | |||
|
REFERENCES Donkersloot, Mary, c1991.The Fast-Food Diet: Quick and Healthy Eating at Home and on the Go. New York, Simon and Schuster. Franz, Marion, Fast food facts: Complete nutrition Information on more than 700 Menu Items in 15 of the Largest Fast Food Chains. Minneapolis, MN, Chronimed Pub, c1994 Jacobson, Michael F. 1991. Fast-food Guide: What’s Good, What’s Bad, and How to Tell the Difference. New York, Workman Pub. The NutriBase Guide to Fast-Food Nutrition, New York, Avery, 2001. United States Geological Survey National Mapping Program, California Index to Topographic and other Map Coverage, (no year). | |||
