 | |
| Title Utilization of Geographic Information System (GIS) and Global Positioning System (GPS) Technologies in the Selection of Environmental Monitoring Sampling Sites | |
|
Author Keith Starner American River College, Geography 350: Data Acquisition in GIS; Fall 2004 | |
|
Abstract An important aspect of a well-designed environmental monitoring study is the selection of appropriate sampling sites. To assist in this task for a pesticide surface water monitoring effort, pesticide use data was mapped and digital images taken during a site survey added to the map. The map with images was then utilized to identify optimal sampling sites. This approach greatly simplified the task of assessing the appropriateness of potential sampling sites, allowing for easy comparison of many different sites. | |
|
Introduction When conducting environmental monitoring of rivers and streams for chemical contaminants such as agricultural pesticides, an essential step is the selection of appropriate sampling sites. A sampling site is a location on a stream of interest where environmental samples can be collected and analyzed to determine if pesticides are present in the stream system. The purpose of this project is to demonstrate the usefulness of Geographic Information System (GIS) and Global Positioning System (GPS) technologies in the selection of sampling sites appropriate for a pesticide environmental monitoring study. | |
|
Background Site Selection: There are many factors to consider when selecting appropriate sampling sites for an environmental monitoring study. These factors can vary greatly depending upon the goals of the specific study. A detailed discussion of such factors is beyond the scope of this project, but is available elsewhere (Artiola, et al., 2004). In order to demonstrate the usefulness of GIS/GPS technologies in the selection of monitoring sites for a pesticide monitoring study, two spatially related factors will be considered: the amount of pesticides applied to fields in the area adjacent to a stream of interest, and the relevant physical characteristics of the sampling sites under consideration. Pesticide Use Data: In California, all agricultural use of pesticides must be reported monthly to the county agricultural commissioner, who must in turn report the data to the Department of Pesticide Regulation (DPR). These data are available to the public through DPR's California Pesticide Information Portal. Growers who apply pesticides are required to report the amount of the pesticide applied and the date and geographic location of the application, along with other information. Data are checked for errors through a statistical "outlier program" developed by DPR. | |
|
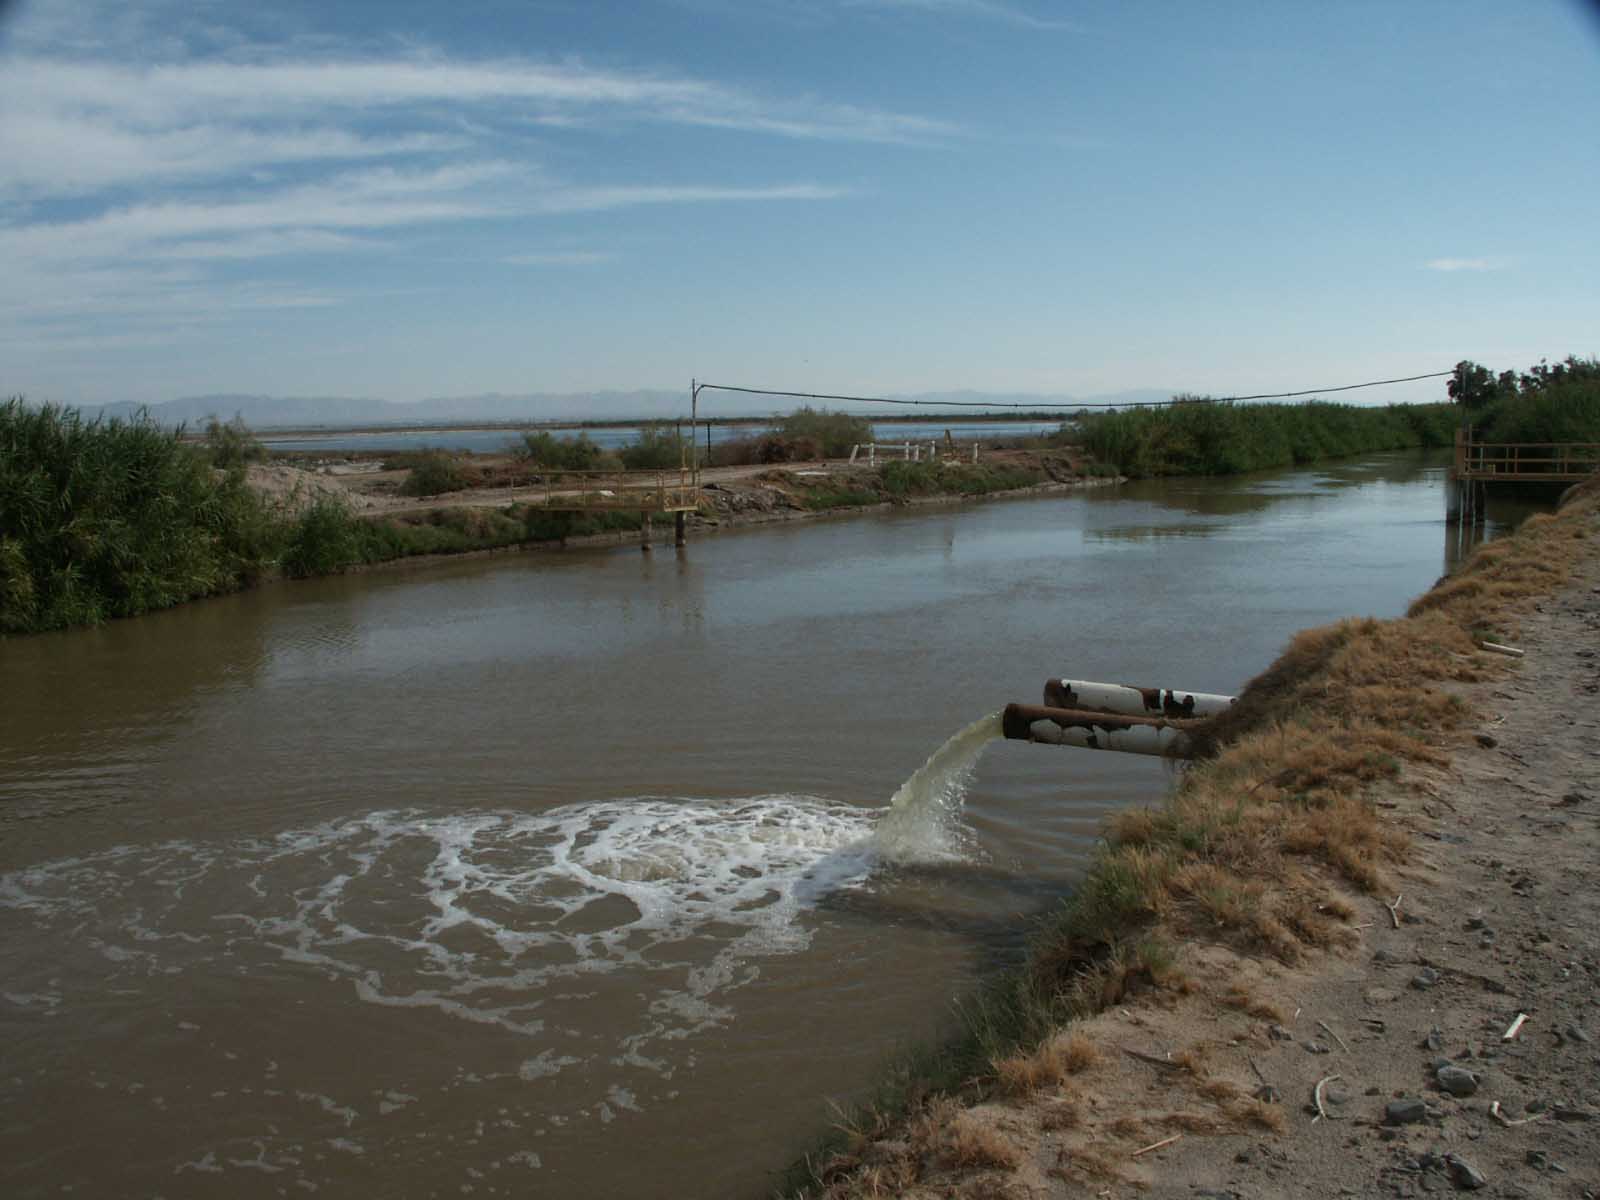
Methods Under the highly simplified scenario described above, selection of sampling sites most appropriate for the monitoring study described here involves identifying sampling sites which: 1) are physically located near agricultural fields treated with relatively high amounts of pesticides and 2) have site characteristics which are appropriate for the study. To determine areas with pesticide use adjacent to streams of interest, pesticide use data from the California Department of Pesticide Regulation was mapped using ArcGIS software (Figure 1). From such a map, a list of potential monitoring sites was developed based primarily on proximity of high pesticide use areas to the streams of interest. Utilizing this list of potential sampling sites, a site survey of the area was undertaken to determine which sites in the high use areas had the appropriate site characteristics. A site survey is essentially an inspection of the potential sampling sites designed to gather detailed information regarding the site characteristics that are relevant to the monitoring study. Site characteristics, many of which can be assessed in a relative way from a visual inspection of the sites, may include site accessibility (nearby road, safe access), stream flow, suspended sediment load in the water, potential for run off or erosion, and adjacent land use. Many potential sampling sites were visited in a short time period in order to gather as much information as possible regarding the potential sites in the area. Extensive field notes were taken regarding site characteristics, and digital photos were taken at each potential site. A hand-held GPS unit (Garmin e-trex Legend) was used to collect GPS coordinates along the survey route and at each potential sampling site. | |
|
Results Upon completion of the site survey,
the digital photos of the sites were processed using GPS-Photo Link
software. This software links digital photos to the GPS coordinates of
the location where the photo was taken and adds the coordinates to each
image as a watermark. The user can also add additional notes and
descriptive text to each photo as a watermark. During processing of the
digital photos with the GPS-Photo Link software, notes taken from the
actual field notes were added to some images. These notes are visible in
the images as a watermark, and can be used to further identify site
characteristics. Additionally, the software allows the user to create shape files of the points where photos were taken so these locations can easily be added as points to an ArcGIS file. These points were added to the previously developed ArcGIS map of pesticide use. In this way, thumbnail images of the potential sites could be easily viewed within the ArcGIS map of pesticide use simply by hovering the cursor over the associated point on the map (Figure 2). The full sized image could be viewed by double-clicking the thumbnail image (Figure 3). This function greatly simplified the task of assessing the appropriateness of the potential sites. The images, with field notes, provided a visual indication of the characteristics of each site, while the amount of pesticide use in the area of each site could be estimated from the map. The images displayed on the pesticide use map, in conjunction with field notes taken during the survey, were utilized to select the appropriate sampling sites. | |
|
Figures and Maps | |
Figure 1. Pesticide Use Map.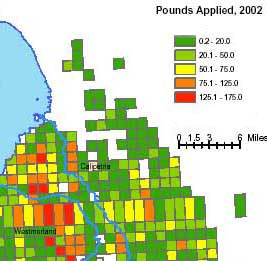 | |
Figure 2. Detail of Pesticide Use Map with
Thumbnail Image. 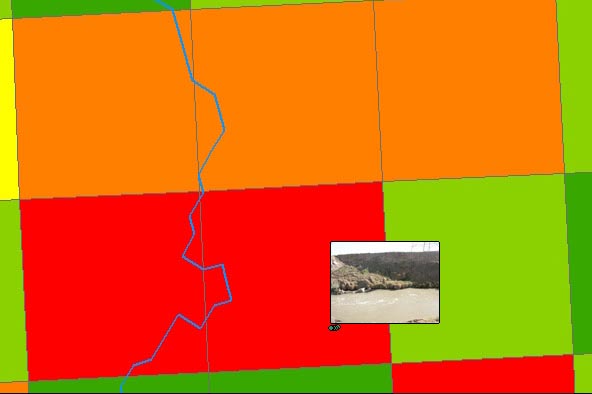 | |
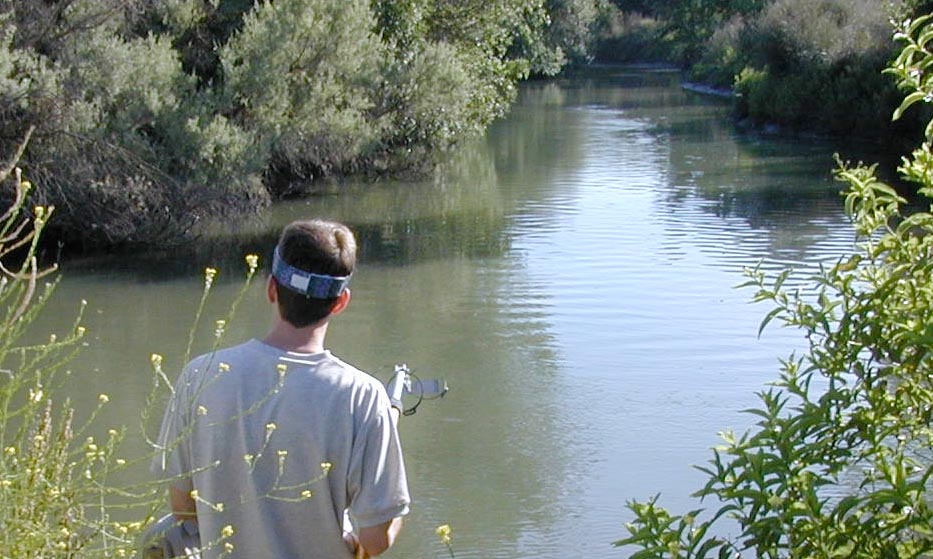
Figure 3. Full Image with Labels. 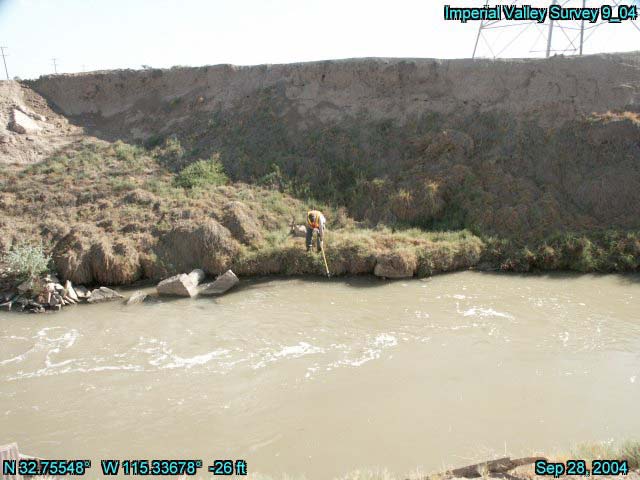 | |
|
Analysis The combination of the pesticide
use map with the digital images greatly simplified the initial site
selection process. For example, a site with good site characteristics but with relatively low pesticide use could be easily identified and eliminated in favor of a nearby site with good site characteristics and relatively high pesticide use. If two sites had similar pesticide use, but one had better access and flow characteristics, for example, this also could be readily determined from the map and images. | |
|
Conclusions The site selection process was
made simpler and more efficient through the application of GIS/GPS
technologies. It was possible to collect data on more sites than would
have otherwise been feasible, and more accurate assessment of the relative
appropriateness of the potential sites was greatly simplified. | |
|
References Artiola, J. F., M. L. Brusseau, I. L. Pepper, 2004. Environmental Monitoring and Characterization. | |
 |