| Title Predictive Modeling for Archaeological Sites | |
|
Author Lara Wood American River College, Geography 350: Data Acquisition in GIS; Fall 2004 Contact Information: larawood33@yahoo.com | 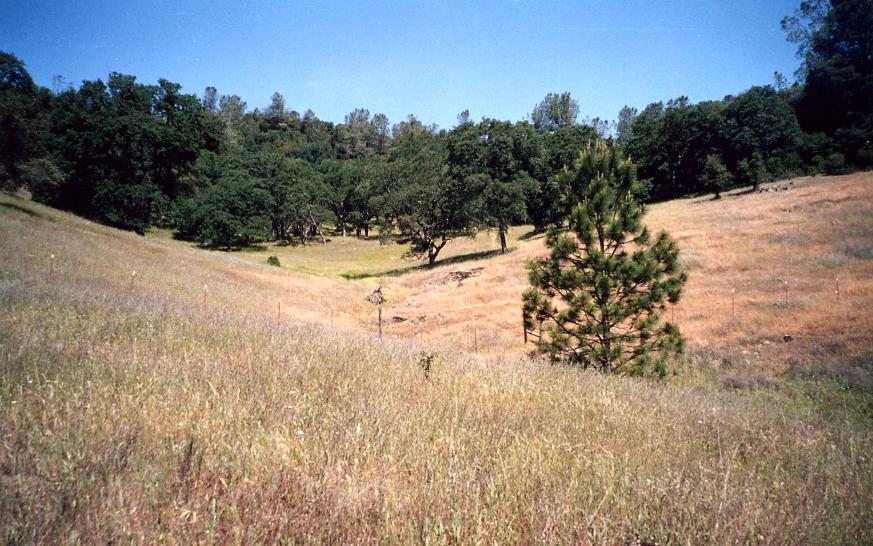
|
|
Abstract After participating in an archaeological survey of the Mammoth Bar Recreation Area in Auburn, California, I decided to attempt to create a GIS model to potentially predict prehistoric (Native American) archaeological sites. The methods utilized were the collection of relative datasets based on known or assumed patterns of site desirability, and the manipulation of these datasets using ESRI's Spatial Analyst. The results were compelling, but ultimately inconclusive. | |
|
Introduction One of the most expensive and time consuming aspects in the field of archaeology is locating unknown sites. The tried and true method has been the "survey". This consists of walking at specified intervals (transects), while looking closely at the ground for any hint of previous human occupation. When the focus is on prehistoric or Native American sites, cultural patterns, documented by ethnographers and anthropologists, can lend clues as to environmental factors that make some areas more likely than others to contain archaeological sites. Therefore, by pinpoimting and analysing many of these factors in a GIS, a potential predictive model could be derived that would greatly reduce the guesswork in locating areas containing sites. This summer I participated in an archaeological survey at the Mammoth Bar Recreation Area in Auburn, California. During this survey, there was GPS data created when sites were found or relocated. While most of the sites were historic (goldrush era), there were a few Native American sites located. By combining environmental factors such as vegetation coverage, proximity to water, slope of terrain and aspect of slopes, I created a predictive model for additional Native American sites. | |
|
Background The question guiding this project was, "How accurately can the location of archaeological sites be determined using a predictive model?". Although GIS is a relatively new tool for archaeologists, I was able to locate a source containing predictive models. This source, compiled by R. Joe Brandon and Connie L. Westcott, is a collection of papers submitted by archaeologists who have used GIS in a variety of ways. Two papers, A Predictive Model of Archaeological Site Location in the Eastern Prairie Peninsula and The Application of GIS Predictive Site Location Models within Pennsylvania and West Virginia, were particularly informative (Brandon and Westcott, 5-67). | |
|
Methods | |
Datasets were collected both online and from personal sources (instructors) and then manipulated using ESRI's Spatial Analyst. The actual process is outlined below. Datasets Used 1.) Hydrography- Obtained from CASIL- "National Hydrography Dataset CA SWRCD Region 5 HPBA (sb)" and "National Hydrography Dataset CA SWRCD Region 5 HPBA (nl)." These vector polyline shapefiles show California Hydrography for Placer County. 2.) County Boundaries- Obtained from CASIL- "County Boundaries 1:24,000." This vector polyline shapefile provided county outlines with which to create a study area grid. 3.) Landuse - Obtained from K. Keller- "nlcd_cal." This raster dataset showed landuse coverage for the state of California. 4.) Elevation- Obtained from K. Keller- "ned." This raster dataset contained a digital elevation model of the state of California. Spatial Analysis 1.) Created a study grid based on the county boundary vector layer by selecting Placer County and converting it to raster. 2.) Resampled "nlcd_cal" and "ned" to set output to 30 meters, bilinear. 3.) Created hillshade based on resampled elevation dataset ("ned"). 4.) Created new clip layers in Raster Calculator for "nlcd" and "ned" to mask them for Placer study grid. 5.) Reclassified (with Equal Interval, 10 classes) "nlcd" by ranking landuse 1-10 based on suitability. 6.) Created slope based on "ned," and reclassified it by ranking slope 1-10 based on suitability being = 20%. 7.) Converted Hydrography vector files to raster, merged them, and reclassified them (Equal Interval, 1class) to create a dataset from which to calculate distance. 8.) Calculated straight line distance from water to 800 meters, or ~1/2 miles. 9.) Reclassified the resampled ned to rank elevations based on potential visibility. 10.) Created Aspect layer from "ned," used CON (conditional) statement to create layer for only flat or southward facing slopes. 11.) Used Raster calculator for weighting and combining datasets. Final calculation was: [Distance to Water] *0.125 + [rclass_nlcd] * 0.1254 + [Aspect] * 0.25 + [rclass_slope] * 0.5. 12.) For map purposes, reclassified original landuse clip to combine similar landuse types and change the color to represent types. |
|
|
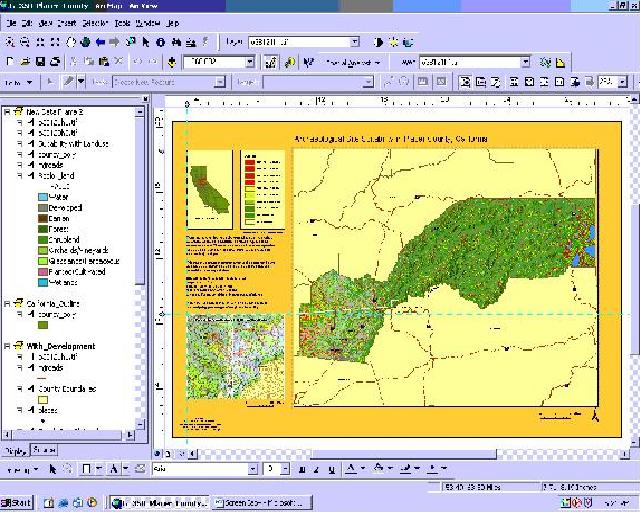
Results After performing the spatial analysis on the datasets collected for the predictive model, I compared the resulting map with previously taken GPS points of known prehistoric sites. While privacy issues prevent me from displaying the actual points on the map, they were located in the red areas designated as potential site locations. |
Map Suitability Map of Placer County, California |
 | |
|
Analysis Problems that I encountered consisted mostly of coming up with a calculation for weighting the datasets. I had to try several different calculations before I arrived at one I felt worked. I also had to change the distance from water to only a half mile because of the size of my study area. Actual catchment analysis is generally based on the distance that can be traveled to and from a base site in one day, and would therefore be more valid at a distance of approximately two miles. More datasets in general would also be beneficial in calculating more adequate results. This process would involve the collection of additional data in the field, as well as the conversion of this data to digital format. | |
|
Conclusions The results of my predictive model show some areas of suitability, highlighted in red. I do believe these would be valid areas to look for archaeological sites. Due to the 30 meter resolution of the datasets, however, I don't feel that this model adequately represents the areas of potential. | |
|
References Literature cited. Brandon, R. Joe and Connie L. Westcott (eds.). 2002. Practical applications of GIS for Archaeologists: A Predictive Modeling Kit. Taylor & Francis, Philadelphia. ESRI. 2001-2002. Using ArcGIS Spatial Analyst. ESRI Press, Redlands, California. |