| Title CENSUS: THE OTHER GIS | |||||||||||||||||||||||||||||||||||
|
Author Dennis Royce American River College, Geography 350: Data Acquisition in GIS; Spring 2005 Contact Information (Address, phone, mtroyce2000@yahoo.com) | |||||||||||||||||||||||||||||||||||
|
Abstract How well do you know your community? The US Census contains countless databases, geographies and instructions for processing this information. Learning what census geographies, census data, and tools to use can be daunting to us newcomers. Accessing the source data is the first order of business. Processing the data producing maps, tables, and charts that successfully convey the information soon follows. With practice and guidance demographic census maps can be easily produced. | |||||||||||||||||||||||||||||||||||
|
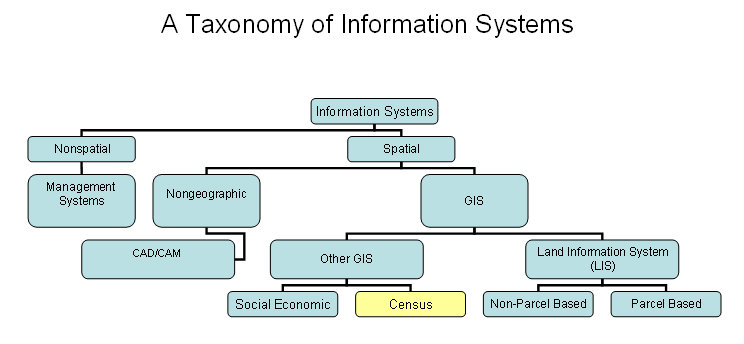
Introduction The Geographic Information Systems Acquisition textbook “Fundamentals of Geographic Information Systems”, contains a section in the first chapter titled Introduction to Digital Geography where the taxonomy of geographic information systems (GIS) is illustrated. GIS information systems are displayed as a sequence of hierarchal relationships that separate into two distinct branches of study. One branch concerns itself with “Nonspatial” data related to information systems. The other branch does concern “Spatial” information systems. Drilling further down into the hierarchal relationship we find that this spatial branch of information systems divides into “GIS” and the “Nongeographic” information systems of computer-assisted drafting (CAD) and computer-assisted manufacturing (CAM). The GIS trunk further splits into two separate relationships, one being land information systems (LIS) and the remaining branch “Other GIS”. The land information systems (LIS) concerns GIS systems that are either parcel or non-parcel based. The focus of my project will be on the “Other GIS” concerned with socioeconomic information systems in general and census information systems specifically. |
|||||||||||||||||||||||||||||||||||
 | |||||||||||||||||||||||||||||||||||
|
GIS training and literature is currently dominated by professionals working in the public sector where the research emphasis is on the environment and activities related to government municipalities. The public and private sector might already to be saturated with professionals well-versed in LIS GIS skill sets. Of the four GIS classes I've completed at Los Rio Junior College and where personal introductions were called for, I can recollect only twice where a student’s main field of interest or employment were in business applications. One student mentioned health services and the other telecommunications. I believe that in the near future private industry will provide the best opportunities for employment in GIS and that the major concentrations of employment will be in consulting, sales, and marketing relying on the “Other GIS” skill sets related to “Social Economic” and “Census” data. Knowledge on how to extract and interpret raw census data will likely be a major skills set needed to fill the growing need for demographic information. Even if the information is outsourced it will be wise for the private sector to have staff that can interpret and verify the validity of the analysis. I believe that this capability would increase our value as an employee or consultant to the private sector. The focus of my research and the basic premise of this project will be to learn, understand, and perhaps teach how the census data is parsed and how raw data can be extracted and applied to one's studies or areas of personal interest. | |||||||||||||||||||||||||||||||||||
|
Background A thorough understanding of current U.S. Census practices would not be possible without at least a cursory review of the historical processes and the efforts that were taken to computerize census geography and automating the processing of the various Census Questionnaires. I highly recommend reading the benchmark article, The Government Publications Review, “The TIGER System: Automating the Geographic Structure of the United States Census,” written by
The goals of the census are intelligently articulated within Marx’s quote: “In its best interests, a civilized nation counts and profiles its people and institutions. The abiding mission of the U.S. Census Bureau is to provide, ably and objectively, these basic statistics about the people and the economy of the nation to the Congress, the executive branch, the business and academic communities, and the general public. The success of a census rests not only on collecting data, but also on linking those data to geographic areas.”An earlier interesting study Census Use Study Report, No. 4, “The DIME Geocoding System” by
For detailed instruction on extracting and applying census data I recommend studying Unlocking the Census with GIS by | |||||||||||||||||||||||||||||||||||
|
Methods | |||||||||||||||||||||||||||||||||||
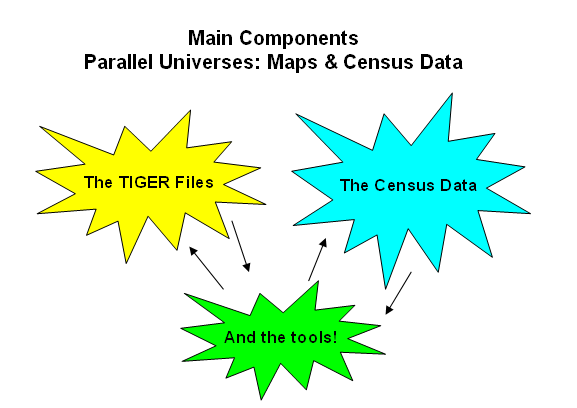 | |||||||||||||||||||||||||||||||||||
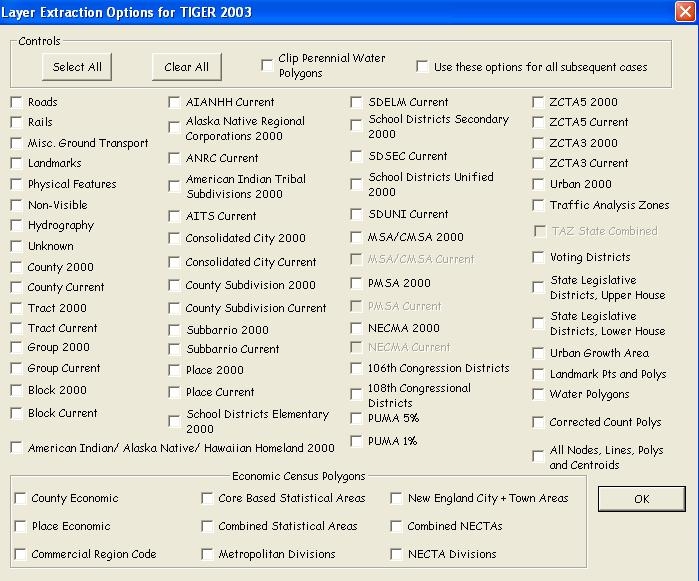
The retrieval of census data requires the collecting and merging of disjoint datasets. The geographical data is found in one of eighteen The TIGER files are zipped files that need to be downloaded and extracted for personal use. Shapefiles for downloading of limited geographies are available. But using raw data allows for better control all available geographies that you can use toward your information output. Most GIS software is capable of processing TIGER formats. The TIGER files are series of string texts that the software parses to build topologically correct points, lines, and polygons. There are also free standing software programs that can process the data into shape files for importation into the GIS. ERSI Arcview 9.0 has such capability but I have not tested that process. Instead I used TGR2shp software. |
BASIC CENSUS GEOGRAPHIES
| ||||||||||||||||||||||||||||||||||
| The demographic data from census questionnaires and surveys may be retrieved from the
|
CENSUS QUESTIONNAIRES Extracting the data is but the first steps in analyzing census data. Once the raw data is downloaded and unzipped the work of joining the geography with the census data begins. The American Fact Finder defines this as “advanced” processing. However, anyone with a basic knowledge of rational databases and data joins can do this quite easily. The main technical issue is that the Geo_IDs for the Census Data and for the TIGER files are usually parsed differently so that some data manipulation must be made to allow for the tables to join in the GIS. For instance the Census Tract might be defined as 0600140210010120 in one data set but 4021 in another. After parsing the data for joining the tables the next issue is data format. Once the Geo and Census tables are joined and the measurement levels (nominal, ordinal, interval/ratio) defined it’s pure GIS analysis. The tools I used for completing this process consisted of basic spreadsheets (MS Excel),databases (MS Access), TRG2shp software, DBFView, and the American Fact Finder. Although I downloaded and studied the Ferrett tool I was able to proceed without using it.
| BASIC CENSUS GEOGRAPHIES
| Results Armed with these tools I decided to use Albany, California as my study area. My reasoning being it has a small set of census tracks that would be contained in a small project. I am familiar with the city and would be able to interpret the results. The first step was to produce a map showing the Census Blocks, Census Block Groups, and the Census Tracts. I then downloaded census data from the American Factfinder web site for analyse and display in Arcview 9.0.
| 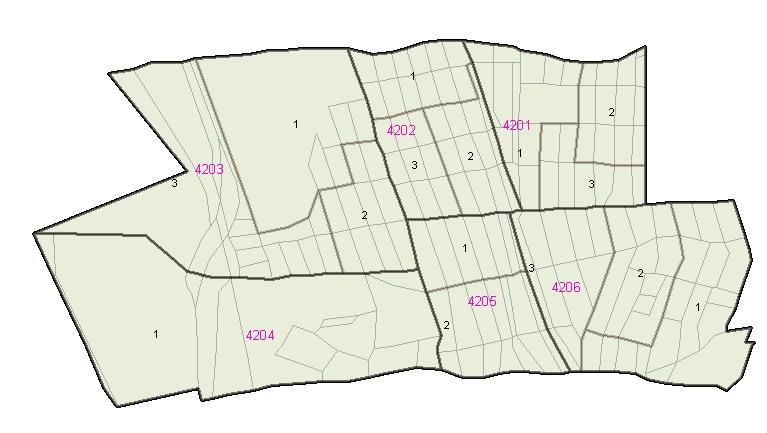
Figures and Maps Albany, California census blocks, census block groups, and census tracts. Now that I have the basic geography I can add cartographic elements (street names, etc) although they should be kept at a minimum. One reference map should be sufficient. Now that I have my base maps prepared in ArcView, I am ready to join census data downloaded from American Fact Finder web site. Click here to see the TIGER tables that were parsed for this geography
| 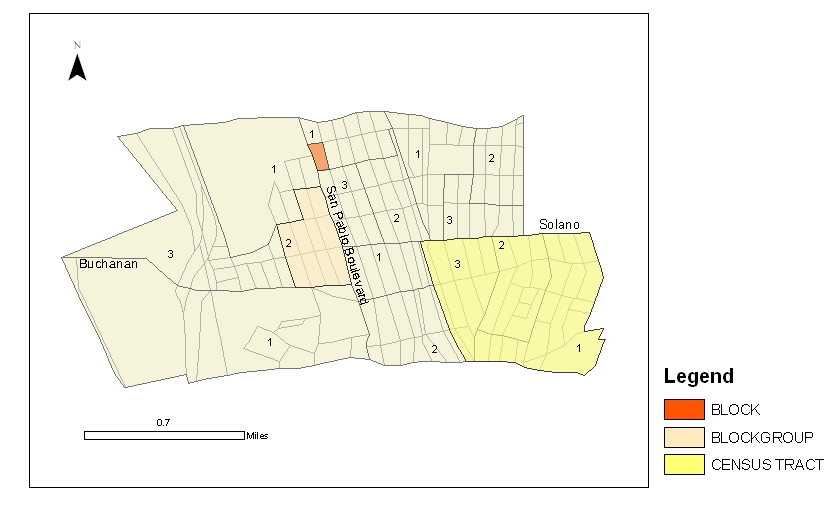
Figures and Maps Albany, California Census Blocks, Census Block Groups, Census Tracts Much of the economic and housing census data is only available at the census block group and census tract level. This is due to confidentiality and because statistical sampling error is introduced when a disproportionately small population is used for analysis. The typical census tract population is 4,000. Click here to see the TIGER tables that were parsed for this geography
| 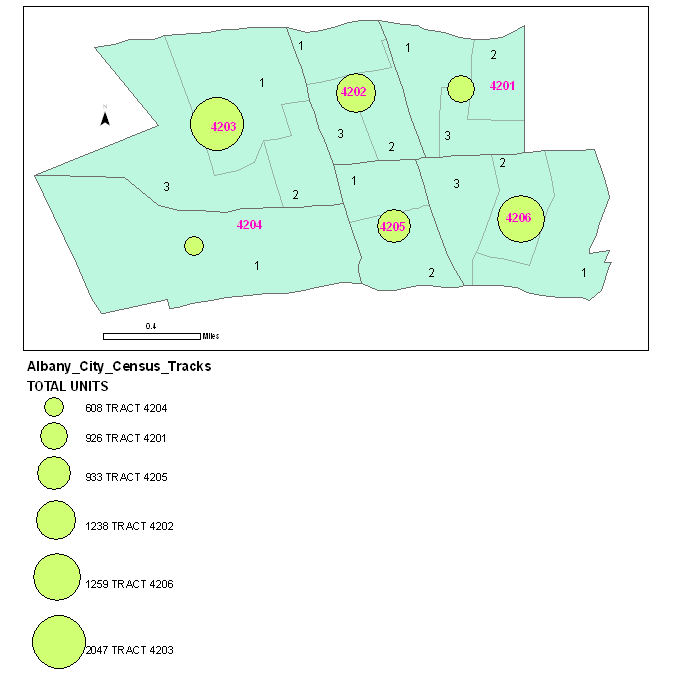
Figures and Maps Albany, California Total Housing Units Census blocks, census block groups, and census tracts. Much of the economic and housing census data is only available at the census block group and census tract level. This is due to confidentiality and because statistical sampling error is introduced when a disproportionately small population is used for analysis. The typical census tract population is 4,000. Click here to see the TIGER tables that were parsed for this geography
| 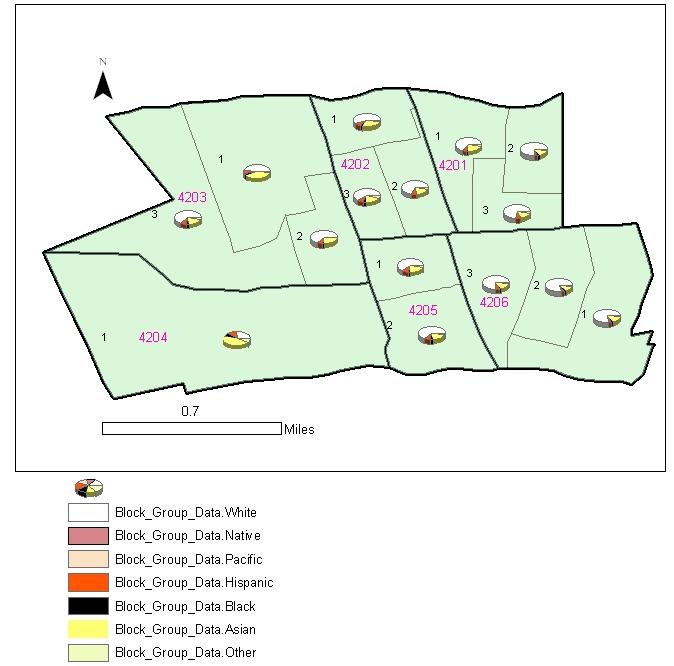 Figures and Maps Albany, California Race Map Here I have pie charts showing the ratio of the racial distribution. Click here to see the census tables.
| 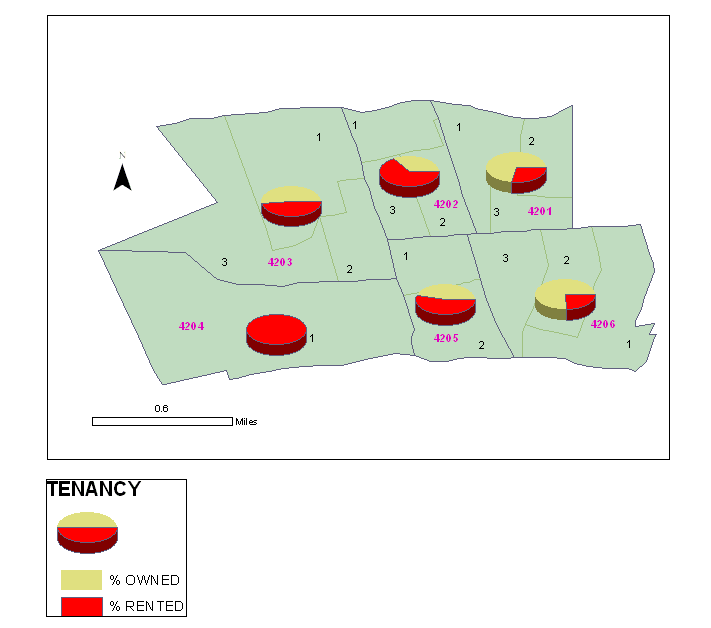
Figures and Maps Tenancy Map Albany, California Here I have pie graphs showing percentage of tenancy defined as owned or rented. Click here to see the census tables.
| 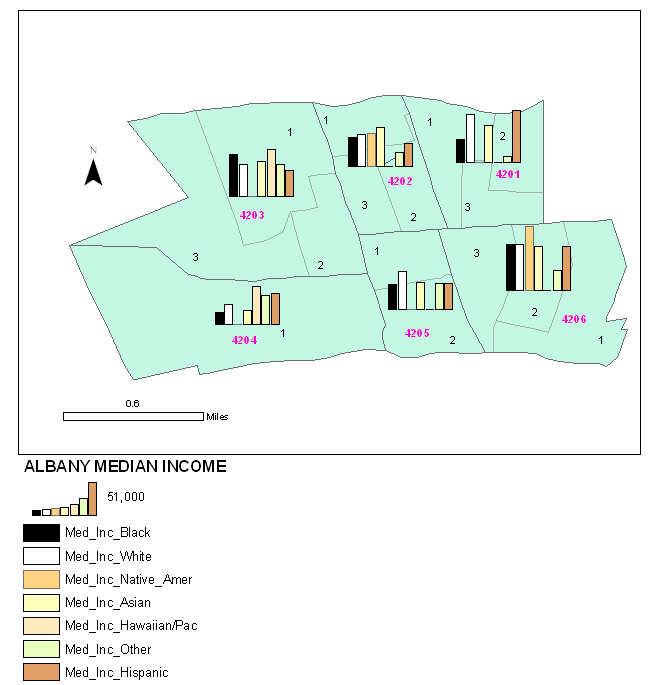
Figures and Maps Median Income Albany, California Median Income at census tract level. Here I have bar graphs showing median income of races for each tract. (Please note that the average income is not 51K as the bar graph might suggest.) Click here to see the census tables.
| Analysis My objective was to study and learn how access and process census data. I started the project with little experience with this topic and completed the current phase of the project with a good basic understanding of the various components and data sources needed to generate census reports. One of the challenges I faced was importing the tables into the map layer. While ESRI allows for this, the process proved very fragile and so I resulted to hyper linking table data to most of the maps. I found that the best process was to export the tables to MS Excel, format, save as a DBF file, than use DBFView to export to HTML. MS Access is also my preferred method for processing tables. Projecting the data onto a map can be a bit of a challenge. I found it best to experiment with various levels of symbolism to see which communicated the information the best. I find two of the maps particularly interesting. The Tenancy map displays the ratio of rented housing units versus owned housing units. Less than 1% of the residences living in census tract 4204 own the property. This part of Albany contains a lot of student housing and small high density triplexes. People living in rented communities are generally in more need of social services. The second map of interest is the Total Housing Units map. The Albany tract with the highest number of units is Tract 4203. This area of Albany is dominated by Albany Hill which is flanked by high rise condominiums on the west and high density apartments on its eastern and southern slopes. Albany hill is still largely undeveloped
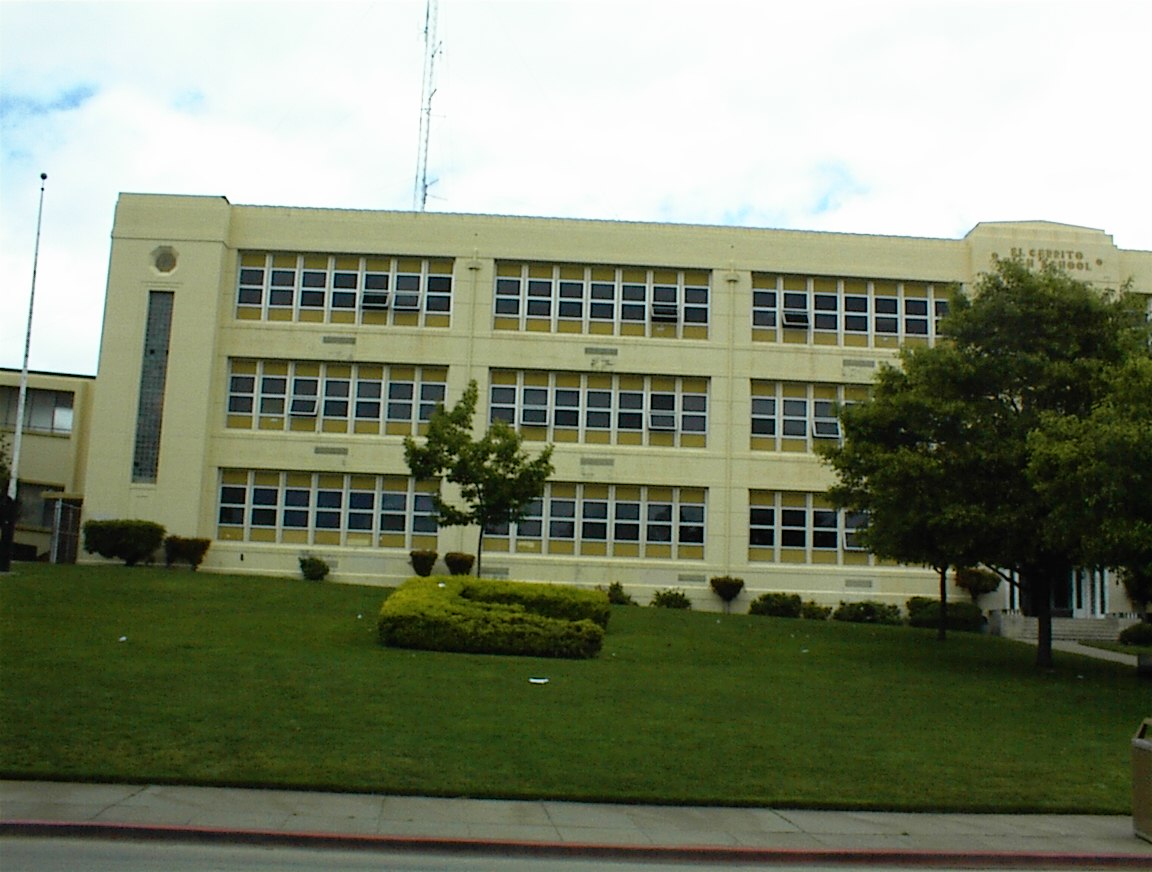
| Conclusions A society has no two greater responsibilities than the care of its senior citizens in appreciation of their life services and to its future statespersons, its youth. As an advocate and champion of and for premium education of the nation’s youth, I am particular disturbed by what appears to be the inequities in education due to continued social injustices and the enhancement of social Darwinism being championed in 21st century America. I had wanted display geospatial photos of Albany High which architecturally resembles a junior college campus and compare them to El Cerrito High which architecturally resembles a junior state or federal penitentiary. These schools may be located less than 2 miles apart geographically but architecturally they are worlds apart. During my project I learned that El Cerrito High is being demolished in the summer of 2005 and replaced with a state-of-the-art campus-like facility. I am proposing that overall the grades of the students attending the new El Cerrito High will rise and that morale will improve. Demographic maps supported by census data can give compelling arguments in helping social scientists target critical areas that need additional financial resources. I plan to continue my study of the census and will be using the census for my project in the Spatial Analysis course offered at Los Rios Junior College.
| References Demers, Michael N., (2005), “Introduction to Digital Geography”, Fundamentals of Geographic Information Systems. 3rd ed, John Wiley Sons, Inc., Hoboken, New Jersey, pg 11 Peters, Alan and Heather McDonald. (2004) Unlocking the Census with GIS., Redlands, California. Marx, R.W., 1986, “The TIGER System: Automating the Geographic Structure of the United States Census.” Government Publications Review, 13:181-201. George Farnsworth and James P. Currry, 1970, “The DIME Geocoding System.” Washington: U.S. Bureau of the Census [for sale by the Supt of Docs, U.S. Govt. Print. Off.] Census Use Study Report, No. 4.
| Appendices Hyperlinks to Census DataCensus Bureau web page where you can download TIGER files for each StateAmerican Fact Finder web page where you can download Census Data for Tiger Files American Fact Finder web page where you can download Tiger Files Technical Documentation American Fact Finder web page where you can download Tiger Files Metadata Census Bureau Questionnaires from 1930 Census Bureau's Instructions to Enumerators from 1940 Census Downloads Census Block shape files for each State Census Bureau's Subject Hyperlinks page Census Bureau's Questionnaires Download generalized Cartographic boundary shape files The U.S. Census Bureau's homepage California's Counting California homepage National Atlas census "people" maps MapStats: United States containing data on areas with greater than 25K in population with hyperlinks to smaller information sets The U.S. Census Bureau's Frequently Asked Question Page Download PDF Census Bureau information flow chart U.S. Census "using data effectively" information site U.S. Bureau of Labor Statistics homepage Learn about and download the Ferrett Data Extract tool The National Center for Educational Statistics homepage | ||||||||||||||||||||||