| Title How Safe is the American River College Campus? | ||
|
Author Scott Sampson American River College, Geography 350: Data Acquisition in GIS; Spring 2005 email: scotts@lanset.com or shirowm@gmail.com | ||
|
Abstract This is a report done on a preliminary crime analysis for American River College in Sacramento. It details processes used to create a GIS of crime incidents symbolized by type, details of which are shown in the Figures and Maps section. Signifacnt findings are given in the Analysis section. | ||
|
Introduction How safe is American River College? How many incidents happened last year? Which crimes were most common? Where did they happen? When did they happen? Campus security is everyone’s responsibility. By being informed,students and faculty can make choices to insure their safety. To this end, I will use ArcView GIS to map incidents occuring between September 1, 2004 and March 31,2005 on an aerial photo and do priliminary crime analysis. For reference, I will also map the locations of gates, emergency phones, and the Campus Police office. | ||
|
Background This Project was inspired by a saftey analysis GIS my brother Kevin did while at UCLA. His was a map of the UCLA campus that had layers for buildings, lighting fixtures and their illumination zones, Campus Security routes, and emergency phone booths. (Sampson, 2003) His report is available upon request. (email: shirowm@gmail.com) | ||
|
Methods On March 10 I started collecting GPS coordinates for the background data. I started with the American River College marquee on the corner of College Oak and Myrtle. Over the course of five separate days I recorded the positions of the gates and lamp posts in parking lots A through D and the visitor and staff parking lots, the Campus Police Office, and emergency phones. I then downloaded the waypoints using VB Garmin, made a shapefile out of them, and imported them into ArcMap 9. Next, I downloaded an aerial photo mosaic of the campus from TerrraServer USA. After encountering some difficulties (see Analysis section), I succeeded in putting the points on top of the images. In the meantime, went to the Campus Police office and requested the incident reports for September through March. I then manually entered the incidents into an Excel spreadsheet, all 152 of them. Next, I exported the spreadsheet as a database file, imported it into ArcMap, and joined the table with the crime points shapefile. When that was done, I selected significant crime types using Select by Attribute queries, made a layer of each set, and symbolized them with ArcMap’s Crime Analysis symbol The crime types chosen were: Assault With a Deadly Weapon, Sexual Battery, Hit and Run,Motor Vehicle Theft (Grand Theft Auto), Grand Theft, Petty Theft, Auto Burglary, Burglary, Vandalism, and Disorderly Conduct. Finally, I used a definition query to select emergency phones, the Campus Police office, and gates and entrances from the waypoints shapefile and symbolized them. The lamp posts were not symbolized in the final map as a all the data displayed at once would have made the parking lots too densly populated. |
||
|
Results For this project, I chose to do a GIS because I felt it would be important to see the data in spatial form. This allowed me to see how analyze the number of crimes occurring in the locations specified in the incident reports, even though specific coordinates were not given. | ||
|
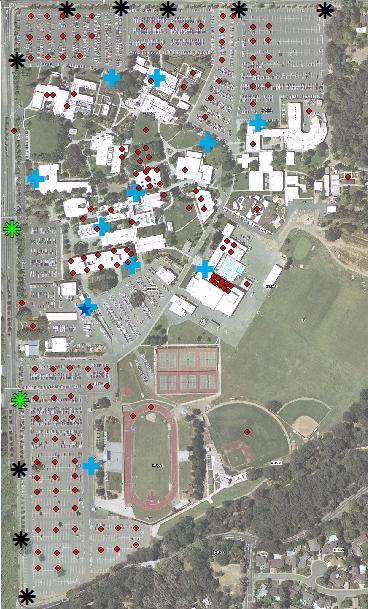
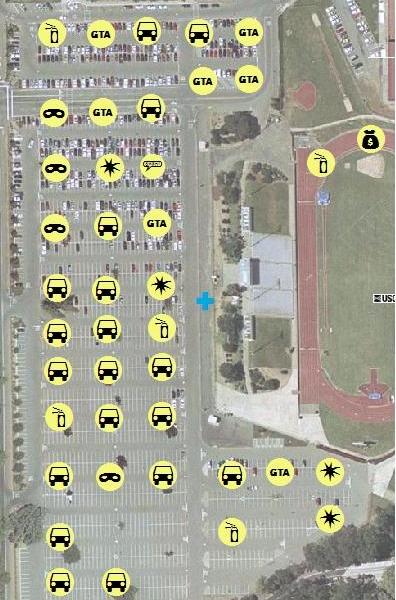
Figures and Maps The map on the left shows the data unclassified by crime type. The asterixes are gates and enterances, the blue crosses are emergency phones, the blue star is the Campus Police office, and the red dots are individual crimes. The map on the right is a close up of the stadium parking lot with significant crimes symbolized by type. This parking lot is a major hot spot. 42 out of 152 crimes, 28 percent, happened here during the period studied. | ||
 |
 | |
 | ||
|
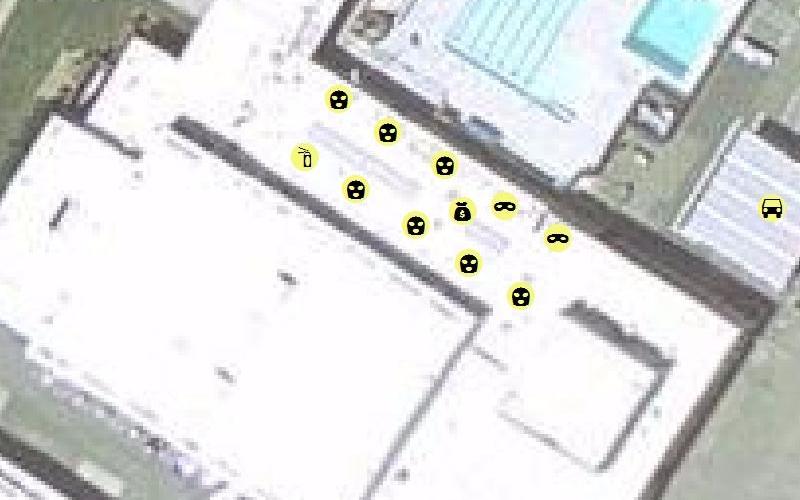
Analysis Findings: American River College’s parking lots were hotspots for crime during the 7 months studied. 82 out of 152, or 54 percent, of the crimes studied happened in parking lots. The majority of them occurred in the stadium parking lot. 42 crimes happened there alone for 28 percent of the crimes studied. Of those 19 were Auto Burglaries. Of the crimes reported, 37 Auto Burglaries were committed, and 13 vehicles were stolen. What I believe contributes to parking lots’ being unsafe is that they are large, open areas with unsupervised entrances and low surveillance. There is one notable exception, however. No crimes were reported in the Staff Only parking lot. This could be due to the facts that it has exclusive access and is in close proximity to several buildings. Another major hot spot was the men’s locker room. In 7 months, 11 crimes were reported, 7 of which were Burglaries. What makes it a major hot spot is that it is a confined area with high use and low surveillance. Other high use, high crime areas were Davies Hall and the Library. Davies had 11 incidents, of which 5 were Petty Theft and 3 were Burglaries. The Library had 8 incidents, 1 of which was the only reported incident of Sexual Battery during the period studied, and 2 were Grand Theft. Difficulties: After I downloaded an aerial photo mosaic of the campus from TerrraServer USA, I ran into difficulty trying to make a single raster out of it. A classmate suggested I try using a DOQQ instead, so I downloaded one of Citrus Heights from CaSIL and succeeded in overlaying the points on it. However, it wasn’t what I was looking for. I then overlaid the aerial photo mosaic on the satellite image and tried to use it to georeference the aerial photos, but neither had enough resolution to precisely place the control points. I finally succeeded in putting the points on top of the overlaid images. Another challenge was finding a way to symbolize seven months worth of crime incidents when the reports did not include geographic coordinates and none of the locations were unique. As a result, all crime points were manually plotted in the order in which they appeared in the data according to the area in which they occured. | ||
|
Conclusions 152 incidents in 7 months average to approximately 22 per month, by my calculation. And those are only the ones that were reported. A month after I completed collecting data, a woman was raped in a vehicle in a parking lot in broad daylight. This underscores the need for increased surveillance and supervision of American River College by the Campus Police, and increased vigilance by the student population. The analysis detailed here is only preliminary. Further investigation is needed for a full assessment of the problem. Using the data in the Campus Police’s crime reports only got me so far. If it contained precise coordinates for each incident, and were in database format, it could be spatially analyzed by GIS to reveal crime flow patterns by location, date, and time. Vulnerable areas could be precisely located and remedies could be accurately applied. By making the nature of the problem readily available faculty and students could make informed choices to ensure their safety and the safety of the campus. | ||
|
References Sampson, K, 2003. Project; "Analysis of Campus Safety at UCLA Through Geographic Information Systems". Geography 170,Advanced Geographic Information Systems, 1(1):5-23. | ||