| Title The Role of GIS in the Jones Tract Flood of 2004 | |
|
Author Jane Schafer-Kramer American River College, Geography 350: Data Acquisition in GIS; Spring 2005 Contact: jschaferkramer at aol.com | |
|
Abstract When the levee along Bacon Island Road in the part of northern California known as ”the Delta” sprung a major leak one June morning in 2004, engineers from the Department of Water Resources were on the scene quickly. This agency eventually led the effort to repair the levee break and pump out the water that inundated the island known as Jones Tract, which sits around twelve feet below sea level. The Delta is a unique geographic feature, and this flood event highlighted the critical part that the Delta plays in the State’s water supply and ultimately its economy. The incident response effort encountered obstacles, but once the water level equalized and it was safe to send crews in, repair work began on the break and all of the island’s levees were reinforced. The water was eventually pumped out, a process that took several months. GIS played an important but low profile role in the emergency response, and its utility as a planning and documentation tool is starting to be recognized within the Department and the State. | |
|
Introduction The weather on the morning of Thursday, June 3, 2004, in the Sacramento-San Joaquin River Delta, California was seasonal and typical with clear skies and a light breeze. It was not at all the type of weather normally associated with flood season in this part of the world. But the combination of an astronomical high tide, a peat levee over one hundred years old, and other factors which can only be suspected and not confirmed, resulted in the waters of the Middle River punching a hole in the Bacon Island Road levee. Since the fertile fields of corn, wheat, alfalfa, and tomatoes on the other side of the levee sit at ten to fifteen feet below sea level (California Department of Water Resources, News Release, December 20, 2004); there was nothing to prevent the water from rushing in, eventually submerging over 12,000 acres (California Department of Water Resources, News Release, December 20, 2004), seven farmhouses, and the livelihood of many farmers and farm workers. Emergency responders gathered from San Joaquin County, the U.S Army Corps of Engineers, the Department of Water Resources, and the local Reclamation District to assess the situation and plan the response. Although local residents had enough warning to move themselves out of danger, a larger threat was looming. As fresh water that normally flowed out to the San Francisco Bay was now filling a lake over the two Delta islands known as Jones Tract, salt water was pulled upstream from the Bay toward the pumps of the State Water Project, threatening to contaminate irrigation water in the Central Valley and the drinking water supply for millions of downstate residents. It was clear to all involved that quick action was needed. Within hours after the levee breach, the California Department of Water Resources assumed the lead role in the incident response. A library of digital orthophotos of the Delta area had recently been acquired by the Department. An engineer in the Levees and North Delta Branch began working to produce maps that would aid the Planning and Intelligence Section and the Operations Section of the Incident Command Post that was quickly set up in a pair of trailers near Trapper Slough. This event was the first test of the role of a Geographic Information System in a Department of Water Resources flood response. This article will explore how GIS was used at Jones Tract, and some lessons learned for future emergency response planning. | |
|
Background The area commonly known throughout the State of California as “The Delta” is the gathering place of the runoff from over 40 percent of the State’s land area, including the Sacramento, San Joaquin, Mokelumne, Cosumnes, and Calaveras Rivers. The waters eventually pass through the Carquinez Straits into the San Francisco Bay, but the combination of the narrow passage at Carquinez and influence from the tides created a marsh where the water levels fluctuated with seasonal and tidal flows, and the water quality varied from fresh to brackish. In 1850, the passage of the Swamp and Overland Act triggered development of reclamation projects. Land ownership passed from federal to state to county and eventually to private over the next twenty years. The soil under the marsh waters was primarily peat which is decomposed plant material. This soil was, and still is, very fertile and attractive to farmers. Laborers were brought into the area to construct levees that hold back the tides and rivers and convert the marsh to productive farmland for grain and row crops. The peat composition of the soil soon proved problematic, as the organic matter decomposes when exposed to the air and blows away in the wind when dry. The land began to subside, and that subsidence continues to this day. The simple peat levees could not hold back the waters without reinforcement. By the 1870’s the job of “reclaiming” the land shifted to steam-powered dredges that moved large amounts of alluvial soils and sediment that had collected in the river channels as a result of hydraulic mining during the Sierra gold rush. The dredging resulted in the web of large levees, sloughs, and islands that make up the Delta today. The next century saw the construction of major dam and aqueduct projects, the federal Central Valley Project (CVP) with the Shasta Dam at its head, and the State Water Project (SWP) which originates at the Oroville Dam. These world-renown water storage and conveyance systems provide irrigation water for the Central Valley as well as drinking water for the arid but highly urbanized communities of southern California. Virtually all of the water that is transported through these projects passes through the Delta en route to the projects’ pumps near the towns of Byron and Tracy. The State Department of Water Resources (DWR) and the U. S. Bureau of Reclamation (USBR), who operate these projects, constantly monitor the flows for water quality, including the level of salinity. The Delta today serves not only as an important agricultural and water supply resource. It is a popular recreation area for boaters and anglers, and population growth in the Bay area increases pressure to develop the land for housing. In recent years, the role of a healthy ecosystem and natural habitat for threatened species has been studied and recognized as an important factor in a functioning water system. Responding to all of these demands is a delicate balancing act for the state and federal agencies as well as local counties, cities, and reclamation districts. The responsibility for maintaining the levees in the Delta is shared by the U.S. Army Corps of Engineers for those levees associated with the federal flood control projects, DWR for the SWP levees, and the local Reclamation Districts with financial assistance from DWR for the non-project levees. | |
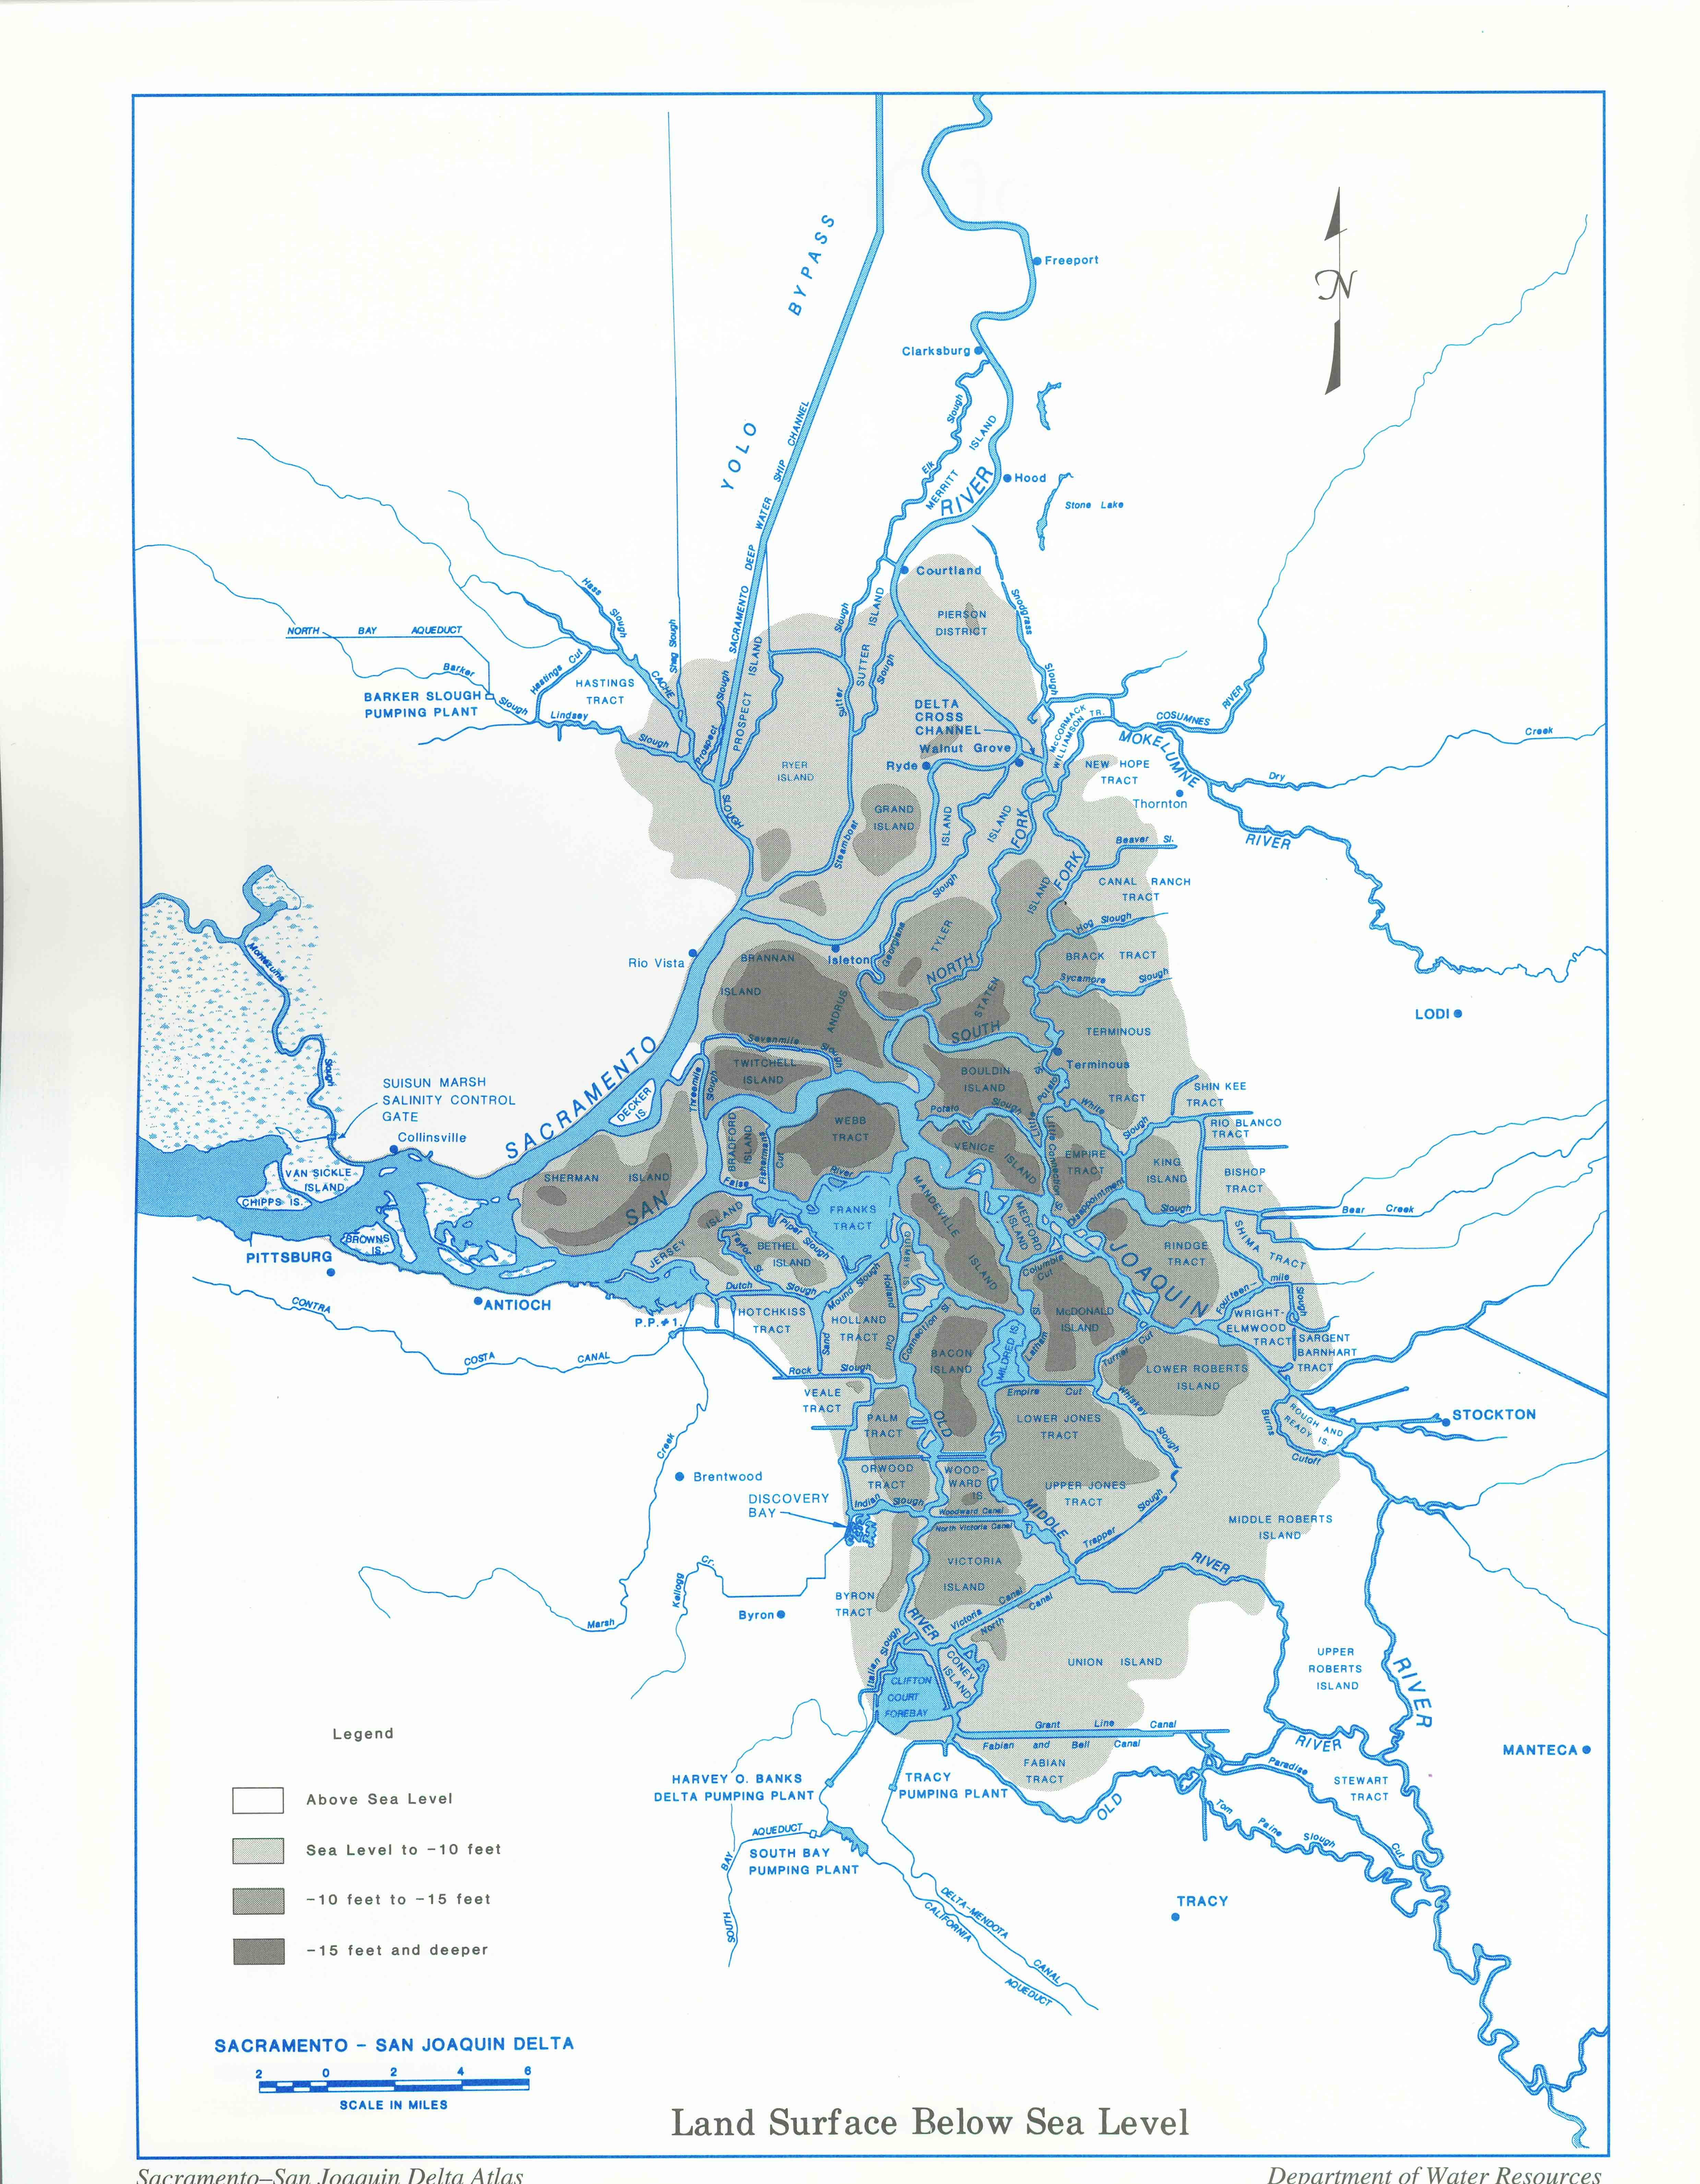
| This map appears in the "Sacramento
-San Joaquin Delta Atlas," last published by DWR in 1995. This map shows the flows
from the source rivers through the maze of sloughs and canals on towards the San
Francisco Bay, with diversions to the SWP and CVP project pumps and the southbound aqueducts.
This map shows the elevation of Jones Tract to be 10 feet below sea level. Measurements taken while
the island was flooded indicated that the land is now as low as 18 feet below sea level. |
 |
|
Methods Information for this project was collected through personal observations and notes,DWR public documents,conversations with DWR staff, and researching the DWR public website: http://www.water.ca.gov GIS at DWR Although DWR does not have a centralized Geographic Information System (GIS), various offices within DWR, including the Bay-Delta Office, have begun to collect GIS data within the last few years. That office’s Levees and North Delta Branch purchased a collection of USGS orthophotos of the Delta area, and had collected and input data for some of the islands. This data includes locations of levee stations, areas of recent work, and historical problem sites. Another important component of a Geographic Information System is people. Recognizing this, the lead engineer for this project, Joel Dudas, worked to develop a network of GIS contacts with other DWR users, USBR, San Joaquin and Contra Costa counties, and the Reclamation Districts to obtain and share data when needed. These contacts proved valuable during the Jones Tract Flood of 2004. The Flood of 2004 In California, major flood events are usually associated with stormy winters and high water years. June of 2004 was neither, but an important fact to keep in mind about the Delta is that the levees are essentially dams; that is, they must hold back water all year around. The levees of Reclamation District 2039 on Upper Jones Tract, ten miles west of Stockton, had been regularly inspected and maintained at a cost of $300,000 annually (San Francisco Chronicle, “Deluge in the Delta – ‘It was like an ocean’: Levee gives way – farmland inundated,” June 4, 2004). Shortly before 8:00 the morning of June 3, a fisherman noticed a break in the levee along Bacon Island Road, which runs atop a levee separating the Middle River from Upper Jones Tract. He reported it to the San Joaquin Sheriff’s Department; upon their arrival on the scene the break was sixty feet wide. The rushing water continued to erode the levee, and the break eventually grew to 500 feet before the water level equalized on both sides. Residents of the island, mostly farm employees, were evacuated, and farmers struggled to move their equipment to higher ground. The Department of Water Resources was notified, and by 9:00 a.m. the State-Federal Flood Operations Center in Sacramento was activated. While representatives from the State and San Joaquin County Offices of Emergency Services (OES), San Joaquin County Sheriff, the Corps of Engineers, DWR, the California Department of Transportation (CALTRANS), the Reclamation District, and other agencies conferred, an Incident Command Center was established by San Joaquin OES on the southeast part of the tract near the junction of Trapper Slough and Whiskey Slough, just off State Highway 4. By 6:00 p.m. that evening, water had begun flowing through a drainage tunnel in a dirt berm supporting the railroad tracks that separated Upper and Lower Jones Tracts. There was some initial confusion and disagreement over who should assume responsibility for the response action and where the money would come to pay for it. It wasn’t until the next day that the Corps of Engineers agreed to pay for closure of the breach and fortification of the Trapper Slough levee, which supports Highway 4, with the cooperation of CALTRANS and materials provided by DWR. Governor Arnold Schwarzenegger declared a State of Emergency. The change in the direction of flow of water from the Middle River into the newly forming lake instead of out to the bay caused salt water to flow upriver towards the SWP pumps at Byron, so the pumps were shut down to prevent salt water from flowing down the aqueduct. On June 5 the Governor visited the site, and an agreement was reached to allow Dutra Construction to close the breach. The next day, DWR established its own Incident Command Post housed in two trailers next to the OES command post, and on Monday, June 6, DWR assumed control of the incident response. The organization of the response team was based on the Statewide Emergency Management System, which establishes clear channels of authority for response action. | |
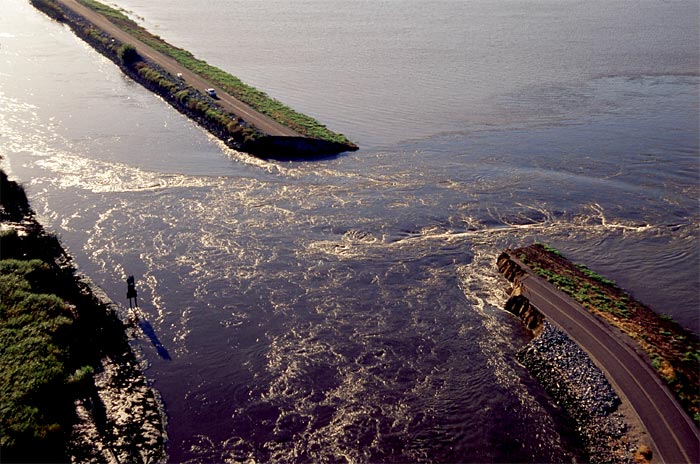
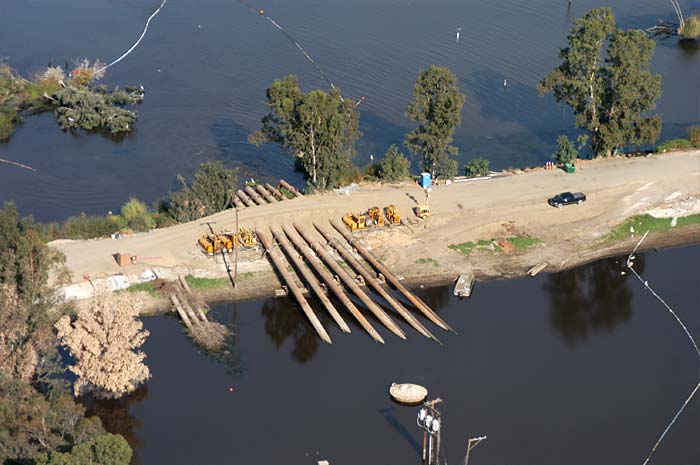
| Aerial photo taken by DWR staff on June 4, 2004, showing water flowing from the Middle River into the newly formed lake at Jones Tract. |
 |
|
The Incident Response In the days that
followed, many public agencies worked together to reinforce the interior
levees of both islands. The services of the California Conservation Corps
and the California Department of Forestry (using Department of Corrections
inmate crews) were contracted by DWR. Most of the reinforcement was done
using visquine (heavy-duty plastic sheeting) and sandbags, but some areas
required reinforcement with rock, due to the threats posed by high winds
and high tides.The trailers housing the Incident Command Post (ICP) initially had no land-line telephone service and no computer network or Internet connections. DWR cell phones had no signal in the area, and a few laptops with limited software were all that the ICP staff had to work with. DWR engineer Joel Dudas worked through the weekend at DWR Headquarters in Sacramento to create map images that could be used for the daily planning and tracking of work . He plotted several large aerial images of the area, adding the layers that he determined could be most useful. These large wall maps and dry erase markers became the focal points and tools for the twice-daily briefings of DWR ICP staff, and the daily meeting with the other agencies and parties involved. Another engineer from the Levees and North Delta Branch, Monica Martin, was assigned to the ICP to work in the Planning and Intelligence Section. Ms. Martin had experience working with ArcGIS, and she coordinated with Mr. Dudas to create image files that could be used in the Incident Action Plan that her section produced and printed daily. Since none of the laptop computers at the ICP had GIS or graphic software, Ms. Martin pasted the images into Microsoft Word documents and used the drawing tools to track daily work on the maps. When additional data was needed, she traveled to the offices of San Joaquin County to use their GIS data and tools, and then drove back to the ICP with the new maps. The Incident Action Plan was photocopied in back and white, so the use of GIS symbology was limited. Instead, arrows and callouts created with the Word tools were used to display the information. (Conversation with Monica Martin, March 3, 2005) | |
| Acting Planning/Intelligence Chief Monica Martin leads daily planning meeting, June 15, 2004 |
 |
|
Personal Observations As an Office
Technician in the Bay-Delta Office of DWR, I was assigned to the ICP for
eleven days, beginning on Day 6 of the event. Although I was working in
the Finance and Administration Section, I had the opportunity to observe
the other Sections at work through the briefings and the sharing of tight
quarters and sparse equipment. I was impressed with the quality of the
work that was accomplished under challenging constraints, and the
dedication of the people assigned to the ICP. I am still in awe of the
work that was performed by the sandbag crews of the CCC and the CDF, who
worked very long days in the hot sun and stinking stagnant water. However,
there is much that was learned by this event, and this information can and
should be considered when planning and preparing for the next flood
emergency.Both of the engineers who performed the GIS work for DWR’s response to the Jones Tract flood have since moved on with their careers and are no longer with DWR, but I was able to meet with Ms. Martin before her departure. She acknowledges that the maps she was able to produce served their purpose at the time, but much time was wasted traveling between the flood site and her office at DWR Headquarters, as well as the San Joaquin County Office, because there was no mobile GIS capability. Access to the software as well as the data on-site is possible with existing technology, but not the technology that DWR had invested in at the time or to date. While no lives were threatened in this incident, the next flood emergency may have very different circumstances, and data-gathering time could be more critical. Specifically, she recommends that the Department invest in a laptop computer with ArcGIS installed, and wireless access to the data housed at Headquarters. The position of Incident Commander at Jones Tract was held by Bill Burkhard, Senior Engineer with the Levees and North Delta Branch, and his relief commander for several days during the response was David Mraz, Supervising Engineer with the Branch. I did speak to each of them recently, almost one year after the levee broke. Mr. Burkhard doesn’t share Ms. Martin’s view concerning GIS at flood emergencies. He believes that GIS is a valuable tool for documentation of the event, but that it isn’t needed for on-site analysis and decision-making. During our conversation , we discussed how GIS is used for wildland fire fighting, where there is a multitude of factors that can affect what the fire will do and how it will spread. In a flood event, he explained, all one needs to know is elevation data, because water will always flow downhill, and investing in a mobile GIS for this is overkill. He believes that the resources that were used at Jones Tract (pasting map images into Word documents) worked well and would be adequate for future events. One example that illustrates his position is the situation on the Trapper Slough levee during the event. Trapper Slough runs along the southern boundary of Upper Jones Tract, and Highway 4, which has become a major commuter route between Stockton and the Bay Area, runs along this levee. When high tide and wave action threatened to erode this levee, a decision was made to raise it by one foot to prevent overtopping. According to Mr. Burkhard, "Soon after the raise, when we compared the CALTRANS benchmark used for the Levee survey with other benchmarks “brought in” by EBMUD(East Bay Municipal Utility District) and and KSN (a local engineering firm), we found the CALTRANS benchmark had subsided and the Levees was then raised a second foot." The data that DWR and the Reclamation District used to determine how deep the newly-formed lake was, and to decide where to locate the pumps, was outdated by a few years. Soundings had to be taken using "a rock and a string." Subsidence had settled the land to as low as 18 feet below sea level at the lowest point of the island. Calculations of how much water was to be pumped out of the lake turned out to be off by 30,000 acre-feet, because current data was not available. Mr. Burkhard makes the point that a GIS can only produce results as good as the data that goes into it; in other words, "garbage in, garbage out." Subsidence in the Delta averages one inch per year, and that doesn't take into account differences from the grading that farmers do every year. His vision for an increased GIS role is to encourage the local agencies, such as county governments and Reclamation Districts, to contribute data to a flood contingency map that would then be made available to DWR and other responding agencies during an emergency. This map would show details such as water channel relief cuts, pump-out stations, levee crest elevations, sites of past problems, sites of recent work, etc. When that data is available, GIS will be very useful in situations like this. DWR just doesn’t have the resources at present to collect this data on its own, and so the few dollars that are available are better spent on levee maintenance. (Conversations with Bill Burkhard, May 5 and May 17, 2005) I also spoke with Mr. Mraz, who has another idea. While tapping into the GIS resources of the local agencies would be very useful, his Branch is investing in a digital camera with built-in GPS (Global Positioning System) capability. This would be used on every levee inspection performed by his staff to record and collect location as well as pictorial data on current areas of concern and sites of historical problems. Data that could be accurately tracked would include sites of old repairs, locations of residences, locations of utilities, and alignment of cross levees. Having that collection of data incorporated into their GIS will be a priority for his group in the near future. He also believes that it’s important to communicate and network with other agencies, groups and individuals about the existence of such a system, in order to make it more useful. (Conversation with David Mraz, May 10, 2005) | |
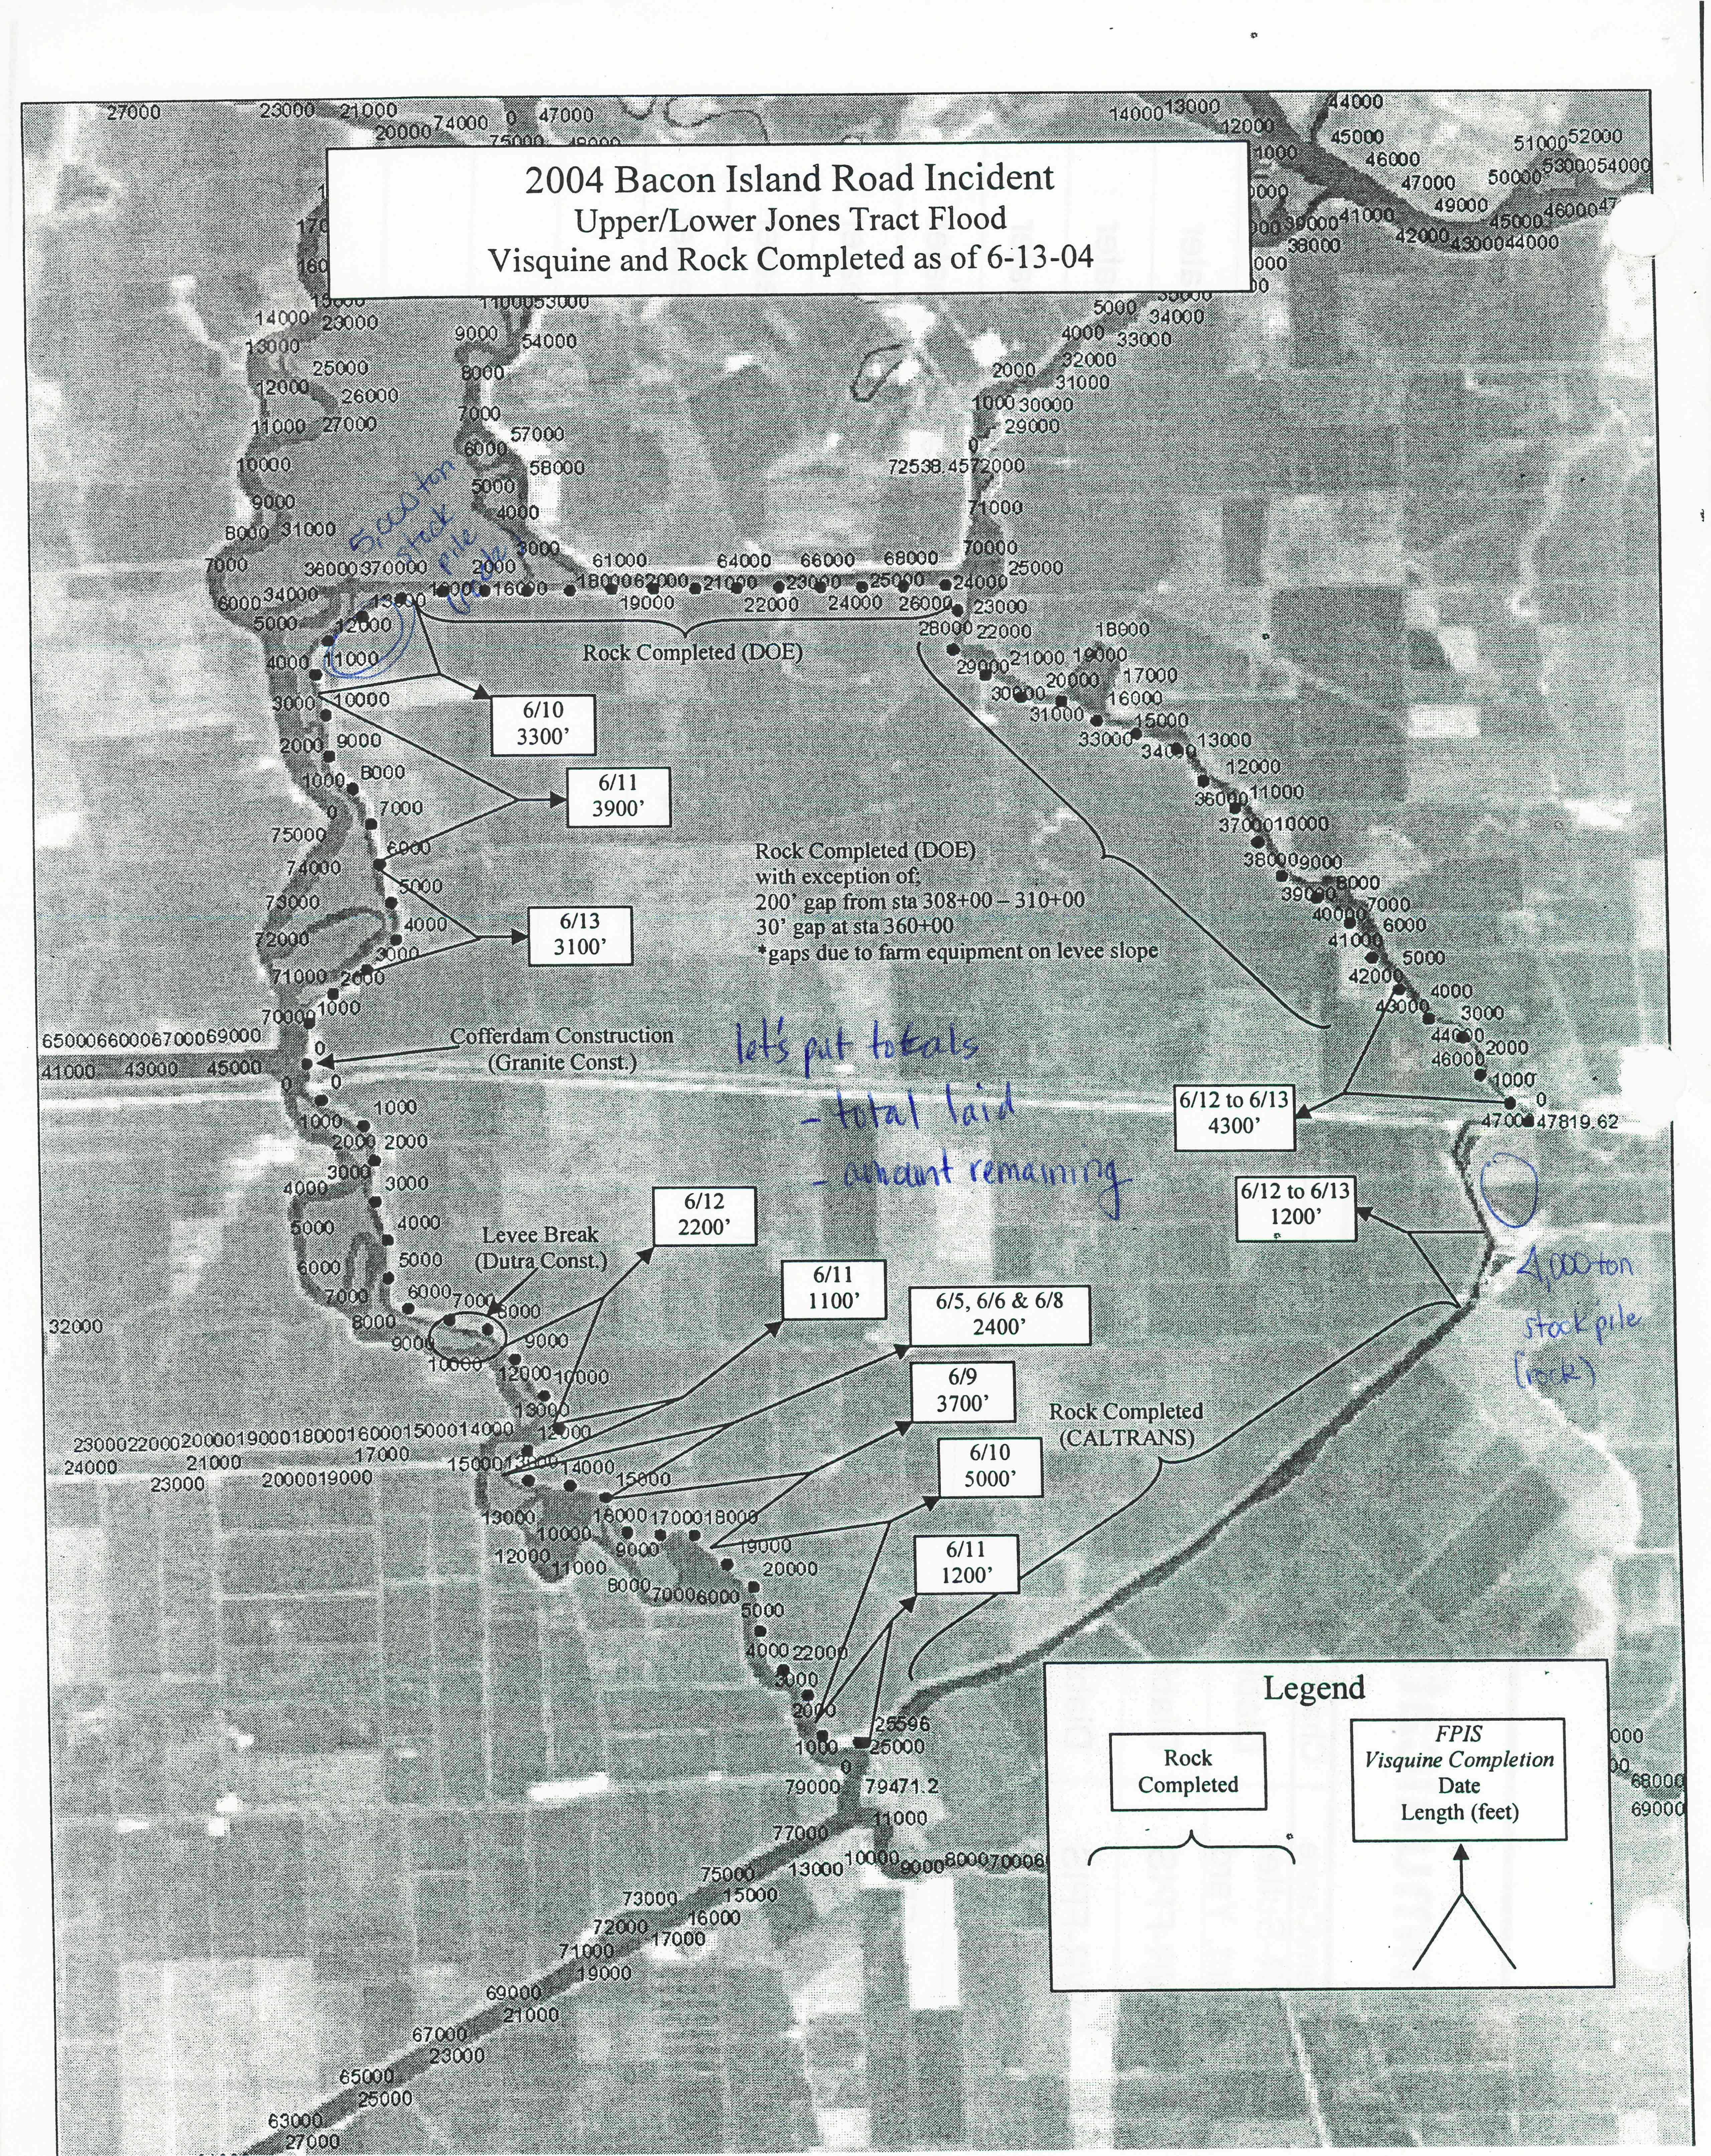
| A scanned version of the photocopied map that appeared in the Daily Incident Action Plan (IAP) on June 14, Day 11 of the flood. GIS was used to initially prepare the map image from an orthophoto with a layer added to show the levee stations (markers placed at 100 foot intervals along the levees). The image was then pasted into Microsoft Word, since that was the format used to prepare the daily plan. The IAP was distributed each morning to ICP staff and used as a working reference and notebook. |
 |
| The Incident Command Post contained several wall maps that were prepared from the GIS files at headquarters. Printed on high-gloss paper, they were used to track the progress of levee repairs. With dry-erase markers as tools, this was the working Geographic Information System at the ICP. |
 |
 |
This map is an example of what the working map could have looked like if GIS software had been installed on one of the laptops, along with a few CD's worth of data, and it was connected to a color printer. The map could be quickly modified and updated as work progressed. This map was produced using the same base image and the same data source as the wall map in the above photo. |
|
All’s Well That Ends Well In the end, the Jones Tract Flood of 2004 resulted in no deaths or serious injuries. The levee breach was closed on June 30, and pump out began on July 12. The last of the water, with the exception of a small pond that had formed where the land was scoured out 50 feet deep in the initial break, was pumped out by December 20. President George W. Bush declared the site a federal disaster area, allowing federal funds to pay for some of the costs which totaled approximately $90 million. Crops are once again growing on Jones Tract, and the water is flowing through the pumps to irrigate the Central Valley and keep California’s economy going. The cause of the levee failure will most likely never be known for sure. The locals strongly suspect the tunnelling activity of rodents; others suspect that less-than-optimal levee maintenance was a factor. Two after-action reports on the Jones Tract Flood have been prepared. An internal memorandum report was submitted to DWR’s Chief of the Division of Flood Management in December 2004, and an interagency report by the Governor’s Office of Emergency Services (OES) is still in draft form. A list of prioritized recommendations appears in the internal DWR report, and there is no mention of GIS technology or preparations, but the fourth item in the list of thirteen Recommended Pre-Event Flood Emergency Actions is to develop and annually review an emergency voice/data telecommunications plan. This acknowledges that access to data was a problem at Jones Tract and a plan should be developed to prevent that problem in the future. The draft OES report does specifically acknowledge that “GIS Maps were slow to arrive at the ICP during the early stages of the disaster.” It recommends that “SOC (State Operations Center) staff should notify GIS staff immediately when a disaster occurs and request standard mapping configurations (these may have to be developed) at the onset of the disaster to expedite getting information to the OA (Operational Area).” Reorganization within DWR in recent months has moved the units that work on Delta levees programs out of the Bay-Delta Office, which has more of a planning function, to the Division of Flood Management, which has more of an operational focus. Although this reorganization is not mentioned in either report, some within DWR believe that the Jones Tract Flood effectively highlighted the unique and critical nature of the Delta and its aging levee system, and may have triggered the move. The Department is also taking steps to improve the quality of the data it has on the Delta. It has contracted for LIDAR imaging services to be conducted later this summer and again next winter, which will produce current elevation and bathymetry data. State agencies are not usually known for their ability to do anything quickly, and it is often the case that an institution will be reluctant to invest in new technology until the old technology is proven repeatedly to be woefully obsolete. This may be the case with GIS and the Department of Water Resources, but there is no doubt that the people who make up the workforce of the Department are capable of mobilizing quickly and working long and hard hours to accomplish its mission: "To manage the water resources of California in cooperation with other agencies, to benefit the State's people, and to protect, restore, and enhance the natural and human environments." (Department of Water Resources public website: http://www.water.ca.gov) | |
|
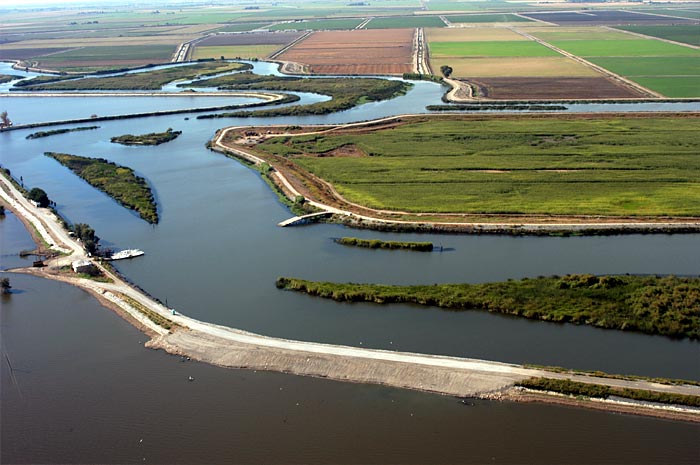
The Pump-Out The levee breach is closed, and the
water recedes as pumping progresses. These photos were taken by DWR staff
on August 24, 2004. | |
 |
|
 | |
|
References 2004 Bacon Island Road Incident Action Plan for Upper/Lower Jones Tract Flood, June 14, 2004 Division of Flood Management, California Department of Water Resources, “After Action Report: 2004 Jones Tract Flood Incident Memorandum Report,” December 2004 Kennedy, David, N., Director, California Department of Water Resources, “Sacramento-San Joaquin Delta Atlas,” 1995 Working Draft of Upper Jones Flood 2004 After Action Report, Governor’s Office of Emergency Services, April 15, 2005 Department of Water Resources public website, Jones Tract News Archive, http://www.publicaffairs.water.ca.gov/newsreleases/2004/jones04.cfm | |
 | |