Mountain Lions: Why do They Attack Humans? - A GIS Approach. |
|||||||||||||||||||||||||||||||||||||||||||||||||||||||||||||||||||||||||||||||||||||||||||||||||||||||||||||||||||||||||||||||||||||||||||||||||||||||||||||||||||||||||||||||||||||||||||||||||||||||||||||||||||||||||||||||||||||||||||||||||||||||||||||||||||||||||||||||||||||||||||||||||||||||||||||||||||||||||||
|
Author Gregory P. Ewing American River College, Geography 350: Data Acquisition in GIS; Fall 2005 Contact Information: gewing@allvantage.com |
|||||||||||||||||||||||||||||||||||||||||||||||||||||||||||||||||||||||||||||||||||||||||||||||||||||||||||||||||||||||||||||||||||||||||||||||||||||||||||||||||||||||||||||||||||||||||||||||||||||||||||||||||||||||||||||||||||||||||||||||||||||||||||||||||||||||||||||||||||||||||||||||||||||||||||||||||||||||||||
|
Abstract
In years past, there have been many reports of mountain lion incidences and attacks in California. Some people have had the unfortunate opportunity of experiencing one of these events first-hand. For the individuals who have fallen victim to and died from cougar attacks, the public wants to know why the attacks occur. As a way in which to research this question, urban area census data, mountain lion habitat, cougar incident and attack data were used to see what trends would result from the overlap of these layers in ArcMap. While reviewing the results of the incident data, the outcome showed that a few of the incidences were indeed in urban areas; however, the reader should know that this data is still in the preliminary stages. When the attack data was reviewed, it illustrated that there was no location information; therefore, no analysis could be done in ArcMap. As it turned out the results of determining why mountain lions attack humans were inconclusive; hence, further research is needed. |
|||||||||||||||||||||||||||||||||||||||||||||||||||||||||||||||||||||||||||||||||||||||||||||||||||||||||||||||||||||||||||||||||||||||||||||||||||||||||||||||||||||||||||||||||||||||||||||||||||||||||||||||||||||||||||||||||||||||||||||||||||||||||||||||||||||||||||||||||||||||||||||||||||||||||||||||||||||||||||
|
Introduction
Over a number of years there have been periodic reports about mountain lion sightings or attacks that were presented on the evening news, or through other forms of media. Some people have had first-hand experiences seeing these big cats in their backyards from a safe distance, while others have had the unfortunate experience of being confronted and attacked by these animals. The outcome of those confrontations has not always turned out well. As a normal public response, the first questions that are generally asked are: What provoked this attack, and what is being done about it? This is where the Department of Fish and Game comes in. The California Department of Fish and Game's (CDFG) role is to manage all wildlife and to provide maintenance of habitat on which animals depend to ensure their survival. With this understanding of CDFG's responsibilities one might then ask, "What is done with animals that cause physical injury or death to a human being?" When animals such as mountain lions become either a nuisance or a threat to the public, it is up to CDFG to take care of it through whatever means they see fit. One might think that it is just a matter of finding the animal that was involved in the attack and destroying it, but it is not quite that easy. It is much more involved than that. It is true that if the lion that is responsible for the attack is found it will probably meet its demise, but questions need to be asked and information has to gathered during the whole process to help prevent future attacks. For example, questions that might be asked include: Did the attack occur because the victim's home is in mountain lion territory? Could it be because the mountain lion population is increasing, which creates more competition amongst themselves for food? In order to understand why these animals are showing up in people's backyards or why these attacks occur, we must first understand the animal itself, and as many of the variables as possible that play a part in the attacks. In the exploration of this project, it became apparent that the variables that play a part in California Mountain Lion attacks on humans are numerous and interconnected. Through the use of resources such as the ArcMap GIS application, California Department of Forestry and Fire Protection's (CDFFP) Fire and Resources Assessment Program (FRAP), U. S. Census Bureau, California Spatial Information Library, and CDFG's California Wildlife Habitat Relationship System, it is my goal to explore, identify, and explain why mountain lion attacks occur. |
|||||||||||||||||||||||||||||||||||||||||||||||||||||||||||||||||||||||||||||||||||||||||||||||||||||||||||||||||||||||||||||||||||||||||||||||||||||||||||||||||||||||||||||||||||||||||||||||||||||||||||||||||||||||||||||||||||||||||||||||||||||||||||||||||||||||||||||||||||||||||||||||||||||||||||||||||||||||||||
|
Background
Historical Facts of Mountain Lions
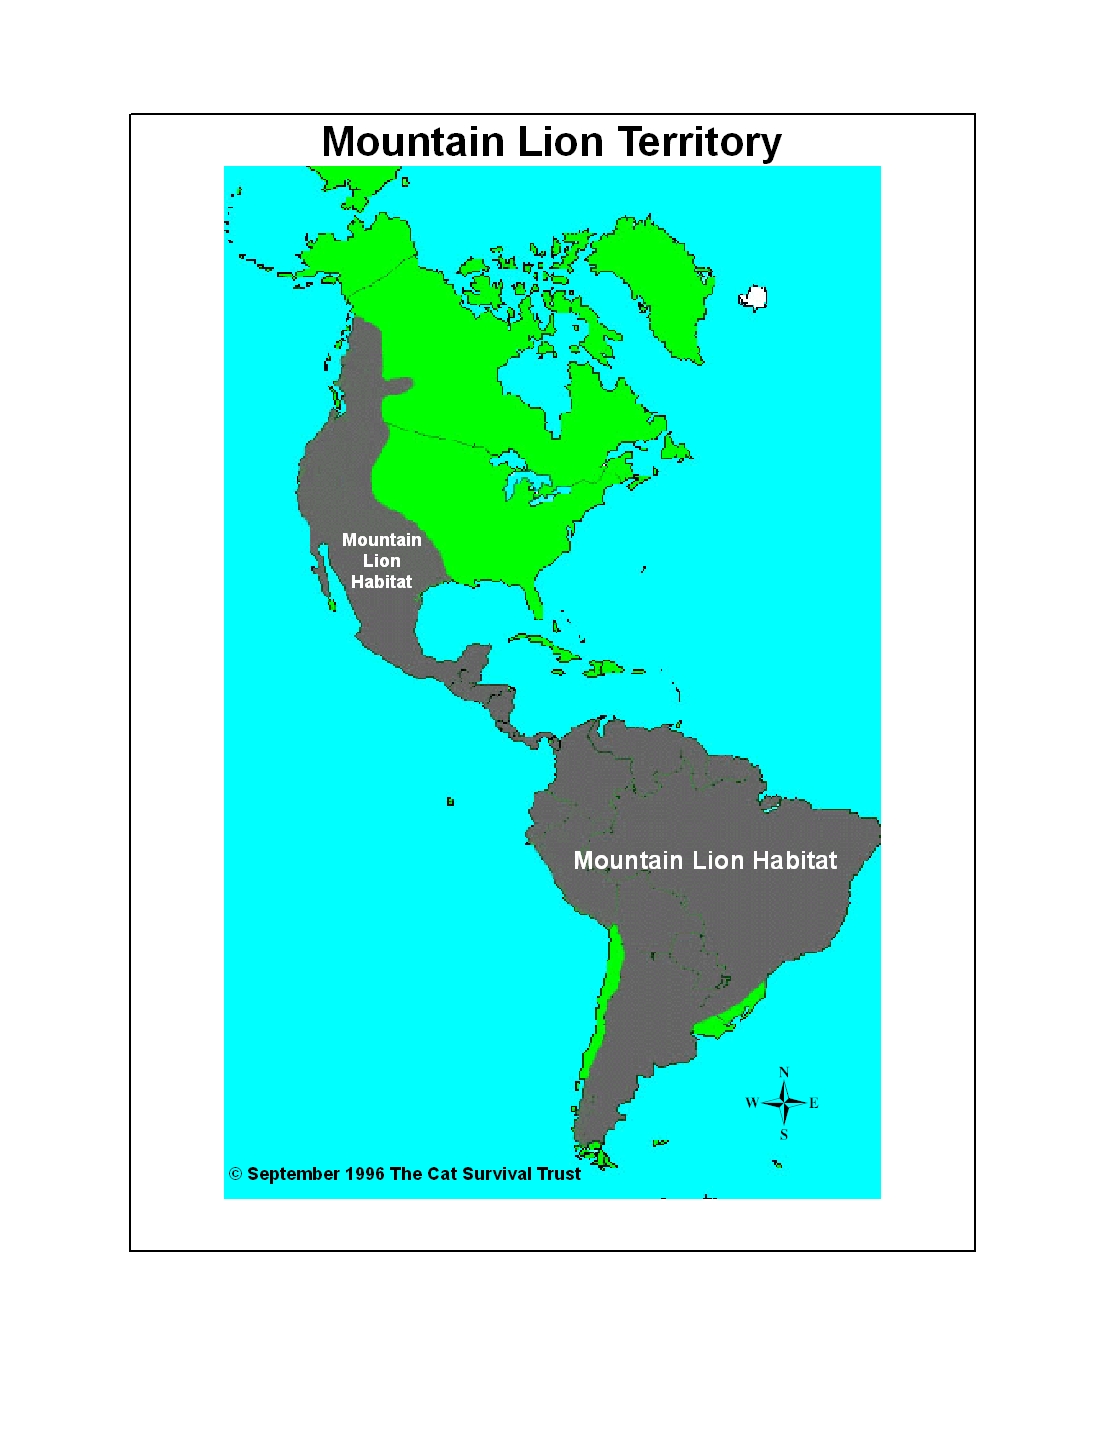
Painter. Catamount. Leon. Gato monte. Mountain screamer. Cuguacuarana. King cat. Mountain devil. What do all of these names have in common? They are all names given to Felis concolor, better know as the mountain lion. From where does this mammal receive so many names? In order to answer this question, one must first consider the size of this cat's domain. The mountain lion's habitat range spans from the Canadian Yukon, through the western side of the United States, down to the southern tip of South America. Since each of these areas are home to different cultures, it is no wonder that there are so many names that describe this big cat. Shifting the focus from mountain lions in various countries to those in the state of California, their status has not always been one of reverence and concern for this animal by the human population. From the turn of the 20th Century through the early 1960's, mountain lions were seen as "pests" and were often shot on sight. The state government went so far as to offer bounties to hunters as a way in which to exterminate these big cats. By the late-1960's, the status of the mountain lion changed from "bountied predators" to that of "game animal". Once this status change took affect, hunters were required to buy state licenses in order to hunt these mammals. After the passage of Proposition 117, better know as the California Wildlife Protection Act of 1990, cougars were raised to the final status of "specially protected mammal", where their classification remains today. This law, still in place, prevents the hunting of these cats unless proof can be shown that there is a threat to people, livestock, or property (UC Davis Magazine, 1996; Fish and Game Code 2004). As a way of addressing these threats, the Department of Fish and Game has published a set of procedures on their web site for the public's awareness. These guidelines are structured in a manner that categorizes personal safety issues in one of three ways: Type Green (Sighting), Type Yellow (Threat), or Type Red (Attack). Type Green issues are defined by a confirmed or unconfirmed report of an observance that is perceived to be a public safety problem. In this classification the mere presence of wildlife does not necessarily equate to a threat. Type Yellow matters are defined by a report of a confirmed presence of an imminent threat (i.e. the likelihood of human injury) to the public by wildlife. This confirmation is accomplished through a field investigation by either a law enforcement officer or department employee. The final classification, Type Red, deals with the actual occurrence of an attack, whether through physical contact, injury, or death. The commonality of these three categories is that each of them is initiated with the completion of a Wildlife Incident Report. Once that report is turned in to CDFG, and depending on the level of threat of the incident, what action is taken will be determined (Public Safety Wildlife Guidelines 2072). While CDFG's procedures determine the course of action for a threat to public safety, they do not specifically address the response that is taken in the event of property damage or a loss of livestock. In cases such as these, the party that has had the loss still needs to file a Wildlife Incident Report and may request a permit to kill the offending animal. Providing there is ample evidence, the department will issue a permit within 48 hours of the request; however, the individual who plans to pursue the animal must abide by strict regulations that are laid out by the CDFG (Dave, 1996). Mountain Lions: Up-Close and Personal
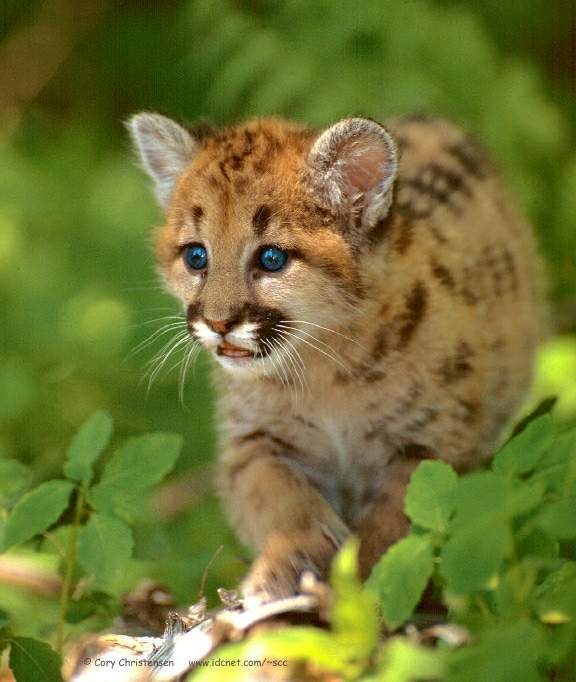
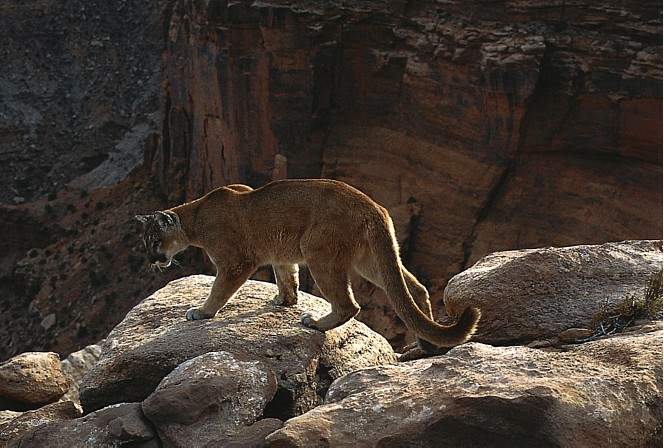
Mountain lions are very elusive, solitary animals. For the first two years of their lives these cats depend on the adults for their survival. From birth, kittens learn very quickly that in order to stay alive they must compete, being that a normal litter size is anywhere from one to six. By six months of age, these cubs are mature enough to go out with an adult to learn the fine art of hunting. After lions reach the age of two these animals are no longer cared for and forced to find their own food in their own terrain for the remaining 18 years of their lives ( Zoological Society of San Diego, 2005). A cougar's territory is quite large. A male's "home range" can span up to 100 square miles [depending on the source that is consulted], while the females domain is general half of that (Lewis, 2005). Since these mammals hunt by stealth, or with the element of surprise on their side, they gravitate towards habitats that have ledges, brush, or any kind of vegetation that they can hide in or behind. Being that they prefer this type of terrain, they can very easily adapt to regions that range from sub-sea level such as Death Valley up to mountainous areas such as Mt. Shasta.
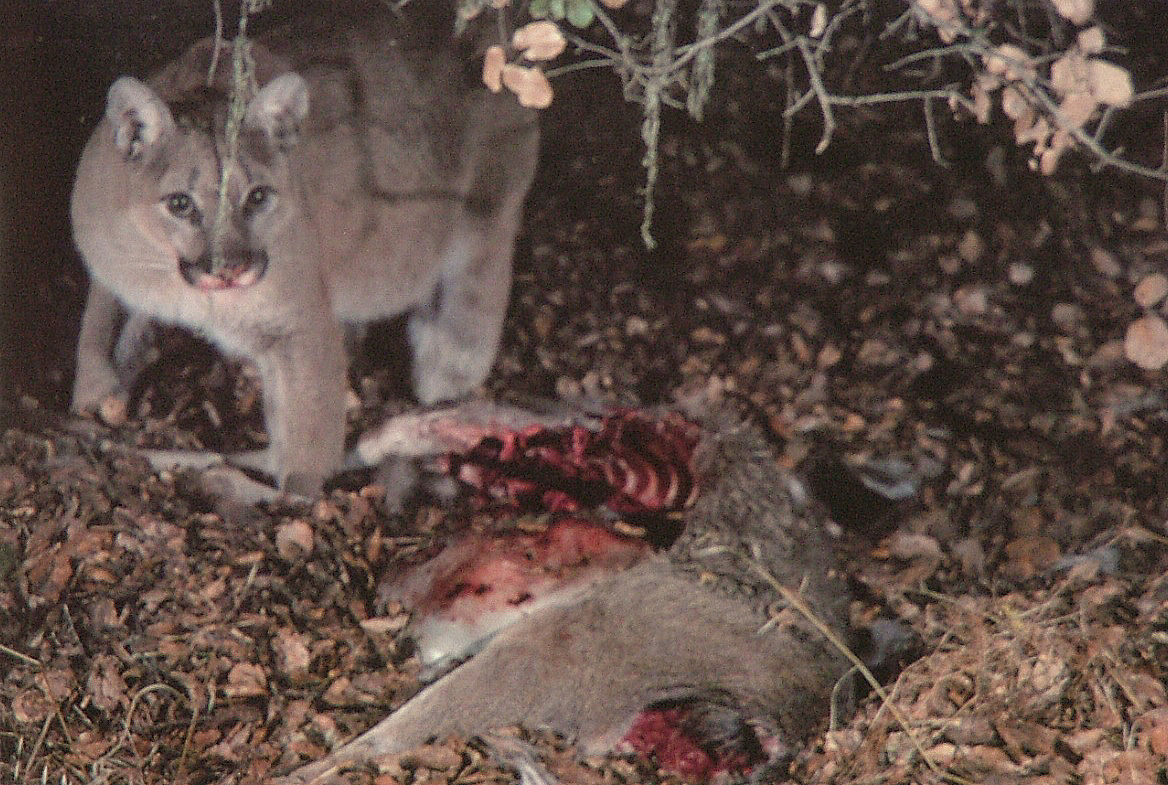
As it turns out, the overall territory of mountain lions within the state of California is the same as that of the deer. Since deer are the main food source of mountain lions, this should not be a surprise. Deer make up anywhere from 60 to 80 percent of a cougar's diet and it is not uncommon for deer to be preyed upon once a week. As a general rule, mountain lions will follow the deer herd wherever they migrate. These cats also eat anything from rabbits, porcupines, coyotes, fish, insects, and even berries (Ahlborn, 1999). Mountain Lion Encounters with Humans: The Possible Causes Since the turn of the 1900s, the human mindset on mountain lions has evolved from one of seeing these animals as a nuisance to that of concern for the conservation of its existence. Also during this time, information has been collected and documented as a way in which to track the behavior and trends of these big cats. While some difficulty has been experienced in the field trying to study these animals due to their elusive nature, progress has been made. During the time of studying the mountain lion much has been learned, but there is still a plethora of unknowns that remain a mystery about these cats. As previously stated, it is known that the mountain lion's main dietary staple is deer. It is also known that cougars hunt using stealth and use the element of surprise to their advantage. What is not known is why they attack; more specifically, why do they attack humans? During the initial research into this project, it became apparent that there is no single cause that is at the root of attacks on humans; rather, there are a multitude of reasons that are interconnected or may play a part in these incidents involving humans. One of the first potential causes of aggressive behavior towards humans is that some of these cougars may test positive for diseases such as rabies. Rabies is a virus that attacks the central nervous system through the physical contact of an infected animal's saliva on an open cut or bite wound. One of the many symptoms of Rabies is increased agitation (CDC, 2003). If an individual happened to be confronted by a lion that had rabies this cat may be more inclined to attack than try to escape.
Another reason that may play a part in attacks on humans is a potential increase of the mountain lion population. Since cougars have to establish their own territory once they reach maturity, an increase in their population would increase the amount of competition between these cats. This in turn would have an effect of forcing mountain lions that are just reaching maturity to move to regions that have not already been claimed. In some cases this may be in urban areas, which would provide an explanation as to why they are being seen in people's backyards. In order to validate this theory though, an on-going study would have to be done state-wide to determine their overall population. At this point their population ranges between 4,000 to 6,000, but that is only a "guesstimate" ( DFG Newsroom, 2004). The final reason that may have some bearing on whether an attack will occur, which will be the focus of this project, is the increased human encroachment into mountain lion territory. Mankind has long enjoyed the outdoors, whether it is simply engaging in recreational activities or a desire to live in the backcountry. Because humans have enjoyed being in these surroundings as much as they have, some have gone to the lengths of building a permanent residence there. Over time this idea has caught on with the general populace and has turned a small handful of dwellings into growing communities. In time those communities will continue to increase in population. While the initial thought of owning a home in the woods, away from the hustle-and-bustle of the big city, sounds very pleasant and peaceful, what is it doing to the balance of nature? In order to build these homes, some of nature has to be destroyed. The destruction of even a small area of nature can have a profound impact on the overall local food chain. Mule Deer populations, for example, can decline due to the fragmentation, degradation, or destruction of habitat caused by urban development or expansion (Ahlborn, 1999). The reduction in deer numbers will in turn influence where the mountain lion will be required to hunt to survive. If no food is available in their normal home range then, in some cases, this may drive the cat into urban areas to seek out a meal. When man and lion come together, sooner or later there is going to be a clash. |
|||||||||||||||||||||||||||||||||||||||||||||||||||||||||||||||||||||||||||||||||||||||||||||||||||||||||||||||||||||||||||||||||||||||||||||||||||||||||||||||||||||||||||||||||||||||||||||||||||||||||||||||||||||||||||||||||||||||||||||||||||||||||||||||||||||||||||||||||||||||||||||||||||||||||||||||||||||||||||
|
Methods
When first considering the details of this topic, it quickly became evident that all of the aspects that play a part in mountain lion attacks on humans are too numerous for the parameters of this project. In order to narrow the topic down, this project focuses on what effect, if any, an increase in urban area development has upon mountain lion attacks: Was there a correlation between the overlap of mountain lion territory and a growth in urban areas? If there was, how did this growth contribute to the attacks? All of these issues will help it bring the GIS user closer to answering the ultimate question: Why do mountain lions attack humans? As a way in which to work towards answering this question, county boundary data for the state of California was used as a foundation from which to build. This data set was found on the Fire and Resources Assessment Program's (FRAP) web site. The scale of this data set was set at 1:24000 using an Equal Albers projection with a NAD 27 datum. Additional sources of data that were found to be useful were the urban areas for the 1990 and 2000 Census data. The 1990 Census data came from the California Spatial Information Library's (CaSIL) web site. This vector data was created using an Equal Albers projection with a NAD 27 datum. The second of the two census data sets were the urban areas for the 2000 Census. This particular data set was found at the United States Census Bureau's web site. This vector data was originally set to a geographic projection using a NAD 27 datum. Even though each of these data sets came from two different locations, the goal was to show, with the help of ArcMap, that there was a pattern of growth in urban areas between the two groups of census data. With the two layers of census data now in place, the next information that was needed was about mountain lion territory. This data set was created by CDFG with the help of the California Wildlife Habitat Relationship (CWHR) System. This modeling database, maintained by CDFG, provided the necessary information to help determine the suitable habitat types and the movement corridors for cougars. It also provided a way in which to assess and rank the areas that would best support and sustain the mountain lion population. While an overlap of the mountain lion habitat and the two urban area layers do not necessarily equate to an occurrence of attacks, the potential is more likely than areas where there is none. This cougar layer, which was previously acquired from CDFG for the purpose of past GIS examples, was provided with the California Teale Albers projection and a NAD 83 datum. As a way in which to further build the case for a correlation between areas of overlap of the two urban area layers and cougar terrain, and the likelihood of attacks occurring within them, actual incident and verified mountain lion attack data was acquired from the CDFG. This data was segregated into two types: incident data with location information, and attack data without a spatial reference. The portion of data that specified incidences, which included this spatial component, provided the benefit of being able to import these data points into ArcMap and overlay them on top of the other existing layers. By doing so, the GIS user could now see if there was any relationship among these three elements. While this point layer does not equate to attack information, it does provide an opportunity to see just where these incidences are occurring in reference to the proximity of urban areas. As for the attack data that did not have location information, while it could not be mapped, the raw data did show that there might be a possible connection that exists among these three areas. To determine the validity of this theory, further research would need to be done to determine if location coordinates do exist for these attacks. |
|||||||||||||||||||||||||||||||||||||||||||||||||||||||||||||||||||||||||||||||||||||||||||||||||||||||||||||||||||||||||||||||||||||||||||||||||||||||||||||||||||||||||||||||||||||||||||||||||||||||||||||||||||||||||||||||||||||||||||||||||||||||||||||||||||||||||||||||||||||||||||||||||||||||||||||||||||||||||||
|
Results
During the research process of investigating why cougars attack humans, one of the first important details to determine was the location of mountain lion habitat within the state of California. This map, as shown here, was created by simply overlaying the mountain lion habitat shapefile over an existing county boundaries layer in the ArcMap session. The datum of this data set was already set to NAD 83 with a Teale Albers projection. As the reader can see, this territory covers nearly two-thirds of the state and it represents terrain that supports mountain lion populations based upon the habitat needs of this animal.
As a way in which to provide more clarity for the reader, it is worth mentioning that mountain lion habitat is divided into interspersed regions that are represented by four suitability categories: high, medium, low, and little or no suitability. These categories represent the desirability of habitat areas under which mountain lions are most likely to live. The high suitability area of terrain, for example, is where mountain lions will most likely be found living based on habitat needs. The different habitat suitability regions were the result of analyzing the original mountain lion territory attributes and assigning the desired symbology to each of the suitability categories to create a well defined map. The result of this map can be seen here. The next batch of information that was useful in this project was cougar incident data, which was provided by the Department of Fish and Game. This data was supplied in an Excel format which needed to be brought into ArcMap. This process was accomplished with the help of ArcCatalog. Once in ArcMap, a geographic projection (North American Datum 1983 whose linear unit was in degrees) needed to be assigned to make use of the Lat / Long coordinates that were incorporated in the raw data. Since the projection of choice for this project was California Teale Albers NAD 83, the datum of the incident information needed to be changed once more. This datum modification was necessary so that all layers (mountain lion suitability, city, lake, and cougar incident points) within ArcMap would be using the same spatial reference system. To provide some clarity to the reader, some explanation about the incident data is needed. First of all, this data describes incidences of wildlife encounters only, not attack information, and should not be misinterpreted as such. Secondly, the title "Perceived Public Safety by Reporting Party" within the table of the data is an interpretation of a perceived threat by the individual who is reporting the incident to CDFG. This, however, may not equate to an actual threat (i.e. cougar taking a defensive posture towards an individual) as defined by the CDFG. Finally, it needs to be stated that this incident data is in the preliminary stage of acquisition and is therefore not a representative sample. The table of incident data can be seen below. Mountain Lion Incident Data (Preliminary)
Since this incident data is not a representative sample and consists of only a small number of incidences, the results are confined to three counties within the state: Shasta, Siskiyou, and Trinity County. As stated earlier, mountain lion territory is divided into suitability regions. Each of these categories consists of different types of vegetation within the given region. For example, high suitability regions consist of Douglas Fir, Montane Hardwood, and Montane Riparian to list a few. At the other end of the spectrum, the little or no suitability regions consist of barren, saline emergent wetlands, urban areas, agricultural areas, and water regions.
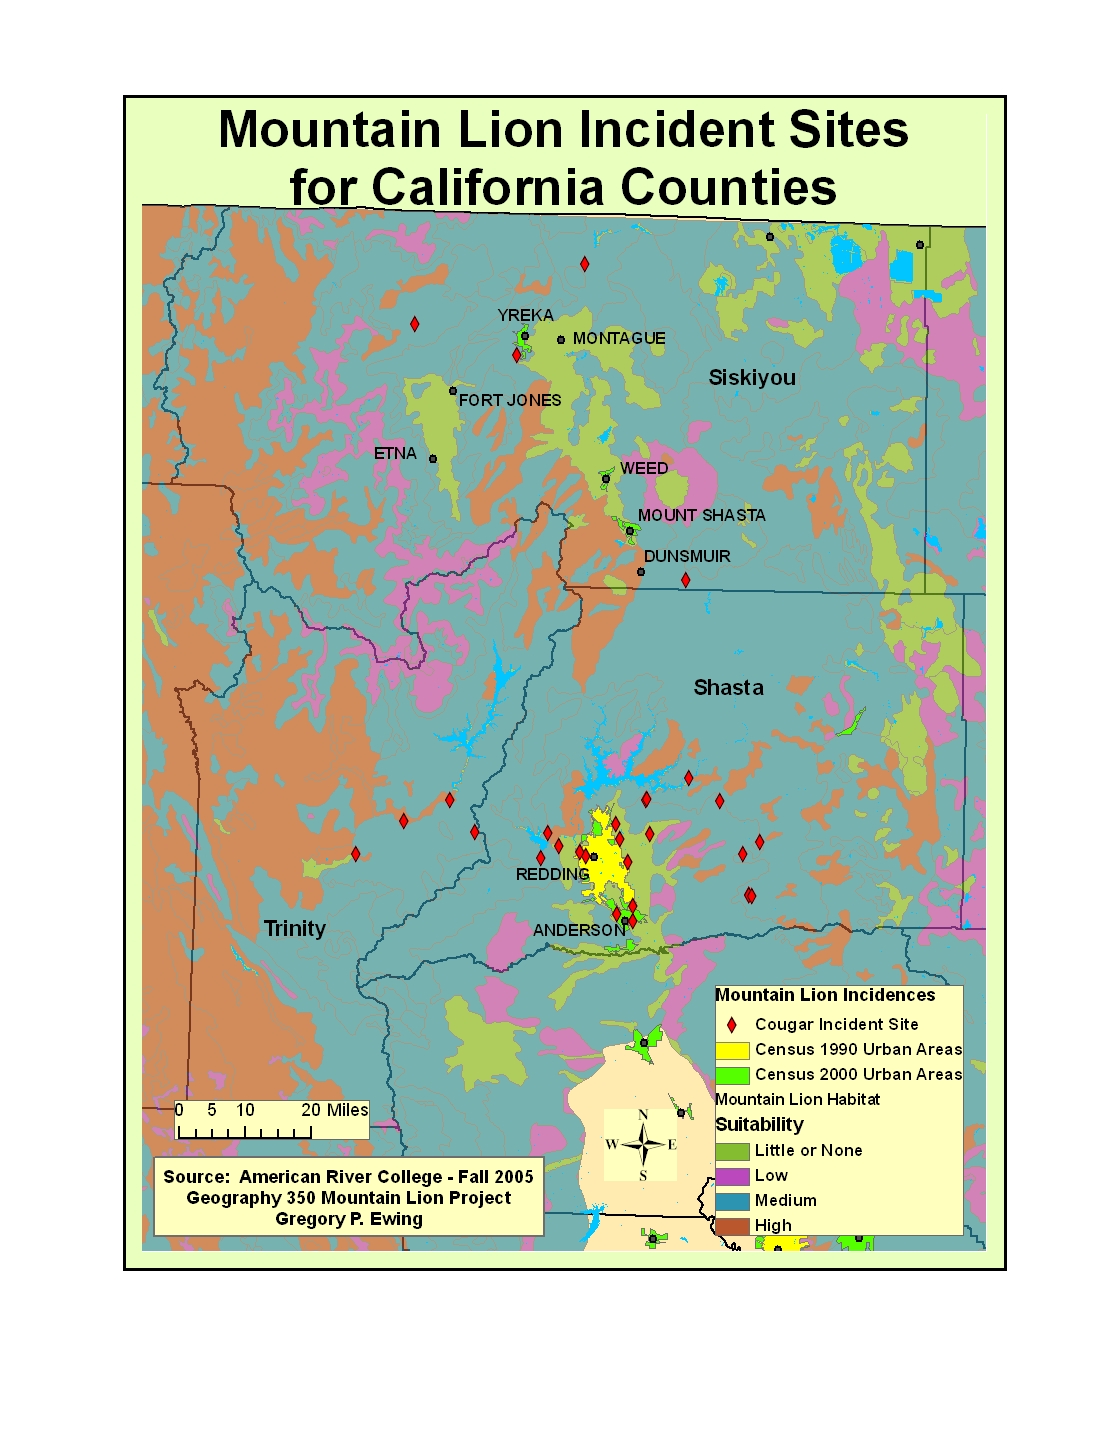
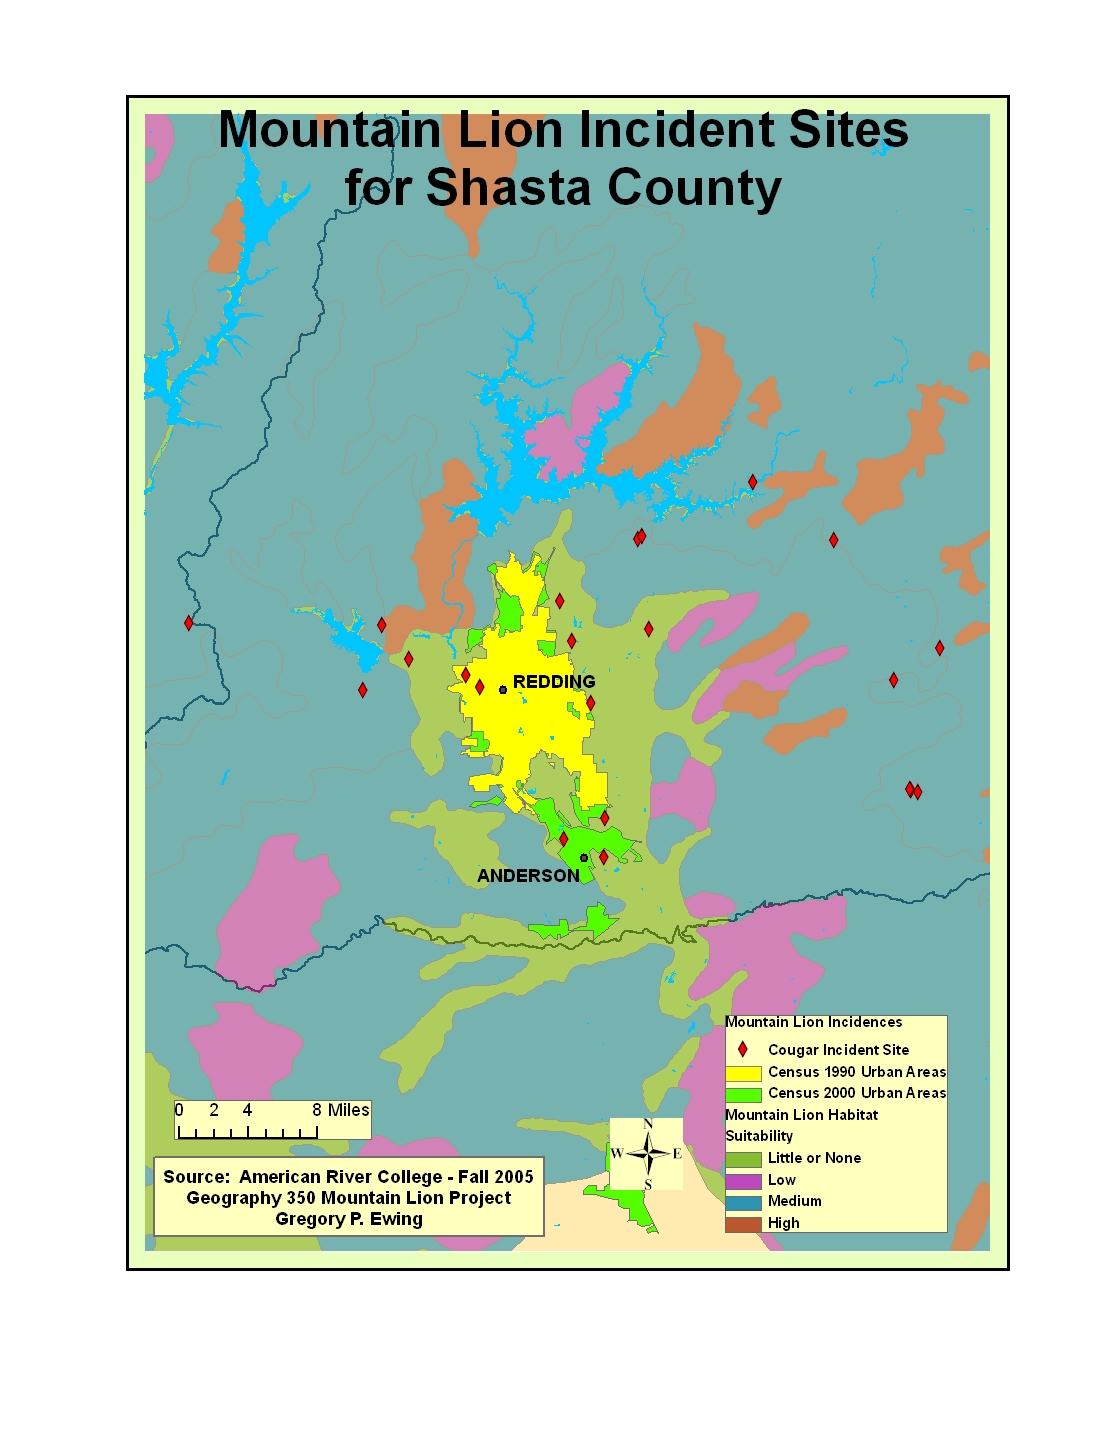
When examining the results of the incident data after their inclusion into the ArcMap session, it is interesting to note that some of the incidents were in areas that are defined as a "little or no suitability" region. To further emphasize this fact, the 1990 and 2000 Census Urban Area layers were added. With these two layers included, not only is it evident that there was urban growth between the two census dates, but there is proof that some of those cougar incidences were in urban areas even if they are not a representative sample. Maps showing these two views can be seen here. The last batch of data that is worth taking into account is verified mountain lion attacks that were acquired from the CDFG. As it turns out, this data does not have a spatial component associated with it. Because there is no location information included with this data, these records can not be mapped in GIS. This batch of evidence is simply a table of data that provides some of the details behind each of the attacks that have occurred throughout the state. While this information does not tie directly together with any of the above incident data, it is still relevant and it could provide some insight into why these attacks occur. If enough attack information is collected over time, perhaps a common element will appear that has not been seen or considered before. This table is shown below.Verified Mountain Lion Attack on Humans in California
(1890 through 2004)
|
|||||||||||||||||||||||||||||||||||||||||||||||||||||||||||||||||||||||||||||||||||||||||||||||||||||||||||||||||||||||||||||||||||||||||||||||||||||||||||||||||||||||||||||||||||||||||||||||||||||||||||||||||||||||||||||||||||||||||||||||||||||||||||||||||||||||||||||||||||||||||||||||||||||||||||||||||||||||||||
|
Analysis
Considering whether this project was a success or a failure depends solely upon the method used to measure it. Even though there were numerous questions that did not get answered about the specifics of attacks on humans, some insight was gained from the data that was acquired. Take the incident data for example: Since these records had a spatial component associated with them, they provided the benefit of being able to map each of these cougar incidences in ArcMap. With this information in ArcMap, queries could be processed to provide answers to given questions. What was learned about these records was that around one third of the 29 accounts that have been recorded were in areas classified as having "little or no suitability" for the mountain lion's habitat needs. Of those 10 accounts, four were reported as having been viewed as a perceived threat by the reporting party, three claimed to have had some level of property damage, and one reported both. Even though this data is not a representative sample, and these are incidences, not attacks, it is a place to start. What was surprising about this incident data though, was that there were not as many accounts to work with as what was envisioned there would be prior to their acquisition. When analyzing the verified attack data that was acquired, one of the difficulties that was experienced with this set of records was that no location information was incorporated within the data set. Without that spatial component, there was no real way in which to map these attacks to show their exact location. All that was known was that each of these records occurred in different counties around the state and, as it turns out, they had no common location attribute with the incident data that was previously mentioned. Another challenge was that there were not very many records, nor was there very much detail, to the attack data. The details that were provided did convey enough information to give the GIS user a very general sense of what happened, where it happened, and when it happened, but not much more. Beyond the nicety of having the spatial component, what would have been helpful is to have more details provided on each attack (i.e. age of mountain lion, circumstances behind the attack, action taken after attack occurred, etc.), so that a trend might show up over time. One of the biggest challenges of the whole project was finding data that showed increasing urban area growth, within mountain lion habitat, that would provide proof that human encroachment is altering nature's equilibrium. As urban development increases to keep up with the demands of the population, nature will have to be modified to accommodate for this. The line of thinking that was being used here was that more development equates to more people living in mountain lion terrain. The more people that live in this cat's habitat area, the higher the potential not only for encountering mountain lions, but for possibly being involved in an attack as well. The original plan was to use a data set from Fire and Resources Assessment Program's (FRAP) web site that not only displayed graphically the growth of urban areas for the entire state from 1940 to 2010, but it also predicted graphically what kind of growth might occur around the state from 2010 to 2040. This data set was originally based upon the 2000 Census and was divided into decades of growth. The difficulty came in to play when trying to use this data set in ArcMap. Because of the lack of understanding of the data set's attributes, working with this shapefile turned into a non-productive endeavor. As a way in which to get around this problem, the next idea was to try the gif file that is associated with that data set. The thought process here was to take the gif file and georeference it to the county boundaries layer within ArcMap. Once this was accomplished the plan was to use that image as the background and have all other layers overlay on it. This choice turned out to be problematic for a different reason. When zooming in to the counties that contained the incident data, the image was so blurry that it was of no value to clearly show each decade of growth; therefore, this idea was abandoned as well. The next idea was to use the same data set described above, only in this case, it was already produced in the form of a ready-made map. The line of thinking here was to, again, try to take the gif file that was downloaded and attempt the same georeferencing process. The outcome was the same - a blurry image that was of no value. After much thought and exploring on web sites, urban area shapefiles from CaSIL and the U.S. Census Bureau were used. After making the appropriate projection changes, and adding them to the other existing ArcMap layers, these data sets did show a growth pattern between the 1990 and 2000 Census. While the growth pattern was not as dramatic as what would have been shown had the urban development data set been used, it did show a good enough growth trend that helped convey a correlation with the incident data on or around the urban areas of Redding and Anderson. |
|||||||||||||||||||||||||||||||||||||||||||||||||||||||||||||||||||||||||||||||||||||||||||||||||||||||||||||||||||||||||||||||||||||||||||||||||||||||||||||||||||||||||||||||||||||||||||||||||||||||||||||||||||||||||||||||||||||||||||||||||||||||||||||||||||||||||||||||||||||||||||||||||||||||||||||||||||||||||||
|
Conclusions
Looking back over the course of this project, much has been learned. The idea of mountain lions being elusive, solitary animals has been visited. There has also been increased awareness that cougar territory makes up two-thirds of the state, while each individual's home range can span up to 100 square miles. Since 60 to 80 percent of the cougar's diet is made up of deer, it should not be a surprise to learn that they follow the migration patterns of deer herds. Additional information that has been identified is that urban development has not only occurred in mountain lion territory, but it is also increasing in size for certain regions. As mentioned earlier, this increase in urban areas causes the local food chain to be altered due to the destruction of habitat for the sake of development. This devastation to the environment can also bring about a decline in deer population. Unfortunately, since the alteration of a single species is not mutually exclusive, it influences every plant or animal that is part of the food chain in one form or another. If the deer population is indeed declining, this would cause a modification to the cougar's behavior. These cats would be forced to search elsewhere to supplement the loss of a major food source. Depending upon the mountain lion population and the amount of local competition, whether it is due to neighboring cougars or other species, some of these cats may be forced to hunt for their meals in urban areas. When looking at the incident data that was acquired from the CDFG, there were 10 incidences that fell in the "little or no suitability" category of habitat. Of those incidences, four were in urban areas. After viewing the spatial location of these four incidences, the questions that come to mind are, "What caused these particular incidences to occur inside an urban area? Could they be due to the reduction in the deer population caused by urban expansion? Could they be due to increased mountain lion populations?" The answers to these questions are unknown at this point. After reviewing the attack data, it is difficult to see a visual pattern of exactly where and why these attacks are occurring in relation to each other and to urban areas in general. The difficulty of knowing where the geographic location of these attacks occur is simply due to the fact that there is no spatial component associated with this data. The best result that can be obtained with these records at this point is to find the general area of the event. No specific attack location can be determined at this time. If there is a need to determine the exact coordinates of these sets of attacks, how can one go about obtaining them? Since the CDFG has these attacks documented, they would be a great place to start. When trying to determine why these attacks occurred and what were the circumstances were behind them, that question has no answer for now. While the exact reason why mountain lions attack humans is not known at this time, the attack data did convey some interesting facts. In the last 114 years, six of the attacks were fatal and nine were not. After digging a little deeper it was found that four of those six individuals were attacked while alone. Since several of the questions that were touched upon in the project do not have answers at this point, further field research is necessary. In the meantime, the best that can be offered as a safeguard against attacks is to educate oneself and to use common sense: Find and read as much information as possible to stay informed and be aware of one's surroundings when venturing out into mountain lion territory. If confronted by a cougar do not run, but rather act as big as possible by opening up your coat if one is being worn. While the likelihood of being involved in an attack is remote, it is always good practice to be prepared. Being armed with knowledge and using common sense will take an individual far when it comes to the safety of one's well-being. |
|||||||||||||||||||||||||||||||||||||||||||||||||||||||||||||||||||||||||||||||||||||||||||||||||||||||||||||||||||||||||||||||||||||||||||||||||||||||||||||||||||||||||||||||||||||||||||||||||||||||||||||||||||||||||||||||||||||||||||||||||||||||||||||||||||||||||||||||||||||||||||||||||||||||||||||||||||||||||||
|
References
Ahlborn, G., 1999. "M165 Mountain Lion Felis concolor", California Wildlife Habitat Relationships System. Ahlborn, G., 1999. "M181 Mule Deer Odocoileus hemionus", California Wildlife Habitat Relationships System. California Fish and Game Code 2004. Department of Fish and Game, 2004. "Common Asked Questions About Mountain Lions", DFG Newsroom. Department of Fish and Game. "DFG Public Safety Wildlife Guidelines 2072", DFG Newsroom. Department of Health and Human Services, 2003. "About Rabies", Centers for Disease Control and Prevention (CDC). Dick, Dave, Special Edition 1996. "How the Law Deals with Mountain Lions", Outdoor California, Volume 57, No. 3. Lewis, Linda, 2005. "Mountain Lion Attacks Introduction". News and Notes, Summer 1996. "The Elusive Mountain Lion", UC Davis Magazine, Volume 12, No. 4. Zoological Society of San Diego, 2005. "Mammals: Mountain Lion (Puma, Cougar)". |
|||||||||||||||||||||||||||||||||||||||||||||||||||||||||||||||||||||||||||||||||||||||||||||||||||||||||||||||||||||||||||||||||||||||||||||||||||||||||||||||||||||||||||||||||||||||||||||||||||||||||||||||||||||||||||||||||||||||||||||||||||||||||||||||||||||||||||||||||||||||||||||||||||||||||||||||||||||||||||
|
Data Sources
California Department of Fish and Game, 2004. "Verified Mountain Lion Attacks on Humans in California".
California Department of Fish and Game, 2004. Wildlife Incident Data (Preliminary).
|
|||||||||||||||||||||||||||||||||||||||||||||||||||||||||||||||||||||||||||||||||||||||||||||||||||||||||||||||||||||||||||||||||||||||||||||||||||||||||||||||||||||||||||||||||||||||||||||||||||||||||||||||||||||||||||||||||||||||||||||||||||||||||||||||||||||||||||||||||||||||||||||||||||||||||||||||||||||||||||
