|
North Sacramento Acquisition and Creation of GIS Data for Historical Economic Analysis | |
|
Author Karen Grunert American River College, Geography 350: Data Acquisition in GIS; Fall 2005 Contact: (email: akubra_keg@yahoo.com) | |
|
Abstract The City of North Sacramento was annexed by the City of Sacramento in 1964. Following annexation, this formerly affluent area has experienced a dramatic economic decline. This project will generate a map in ESRI's ArcView incorporating current spatial and attribute data available from the United States Census Bureau and other sources, and create spatial and attribute data from historical United States Census records which are unavailable in digital format. This map will then be utilized to perform a Census tract-level economic analysis of North Sacramento, both prior to and after annexation. | |
 | |
|
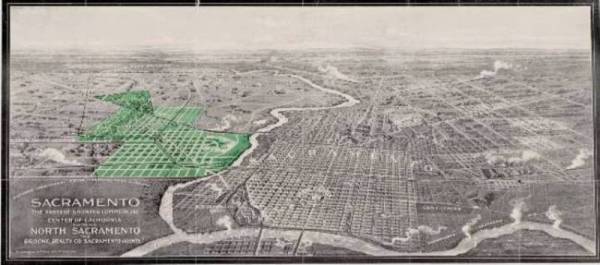
Introduction For forty years, the City of North Sacramento existed as a separate, prosperous community across the American River from the City of Sacramento. Located in the southern 4,400 acres what was once the Rancho Del Paso Mexican land grant, the area was purchased in 1910 by Midwestern real estate developers from horse-breeder James Ben Ali Haggin. Subdivisions were laid out, public services established, and in 1924 the town of North Sacramento was incorporated and marketed nationwide as a “Garden of Eden just a ten-minute ride to Sacramento.” With a population at its height of over 16,000, it contained a thriving central business district centered along Del Paso Boulevard which, prior to the Interstate Freeway System, was Highway 40, the “Lincoln Highway,” and the primary roadway East between Sacramento and the Sierras; its own industrial employment base, payrolls from which at one time made the Del Paso Boulevard Bank of America “the second largest in the State for a district of its size;” and a booming real estate market of new, affordable housing. According to a long-time Del Paso Boulevard merchant, “When things were going well, you moved to North Sacramento.” Despite its viability as an independent city, the issue of consolidation with the City of Sacramento had been raised on and off throughout the decades, spurred on primarily by the desire to be included in Sacramento’s flood control system following a disastrous flooding of the Del Paso Boulevard area in 1928. A major turning point in the history of North Sacramento was the opening in 1955 of Highway 160, the North Sacramento Highway, ultimately referred to by locals as the North Sacramento Bypass. This freeway artery provided faster access to the Capitol City Freeway from the downtown area, but as a result diverted most of the automobile traffic from the Del Paso Boulevard corridor upon which the merchants relied for much of their business. In the 1950’s and 1960’s the City of Sacramento began to pursue an aggressive policy of annexation, incorporated numerous communities to the North, South, and East of the original City grid laid out in 1849. North Sacramento became partially encircled by the City limits when the Cal Expo and Northgate (1960), Natomas (1961), and portions of Del Paso Heights and Hagginwood (1963) areas were annexed during this period. See the City of Sacramento Development Services Department's Annexation History Map for an in-depth look at Sacramento's growth from 1849 to the present day. Despite voter rejection of a proposal for consolidation in 1963, the issue was again placed on the ballot in 1964, when it won a narrow victory. In August of 1964, the City of Sacramento acquired an additional 6.6 square miles of land and another 16,350 residents, and City of North Sacramento ceased to exist. In the decades following annexation, conditions deteriorated in North Sacramento to the point that, in 1992, an area once regarded as one of the most desirable neighborhoods in the region was declared an “Area of Urban Redevelopment” by the Sacramento Housing and Redevelopment Agency. According to the Sacramento Planning Commission, the North Sacramento district contains more than two-thirds of the vacant residential lots in the entire City of Sacramento. There has not been a single major grocery chain retailer in North Sacramento on over a decade. Attempts at creating an urban arts community along Del Paso Boulevard are stalling, as the thoroughfare’s reputation for poverty, crime and drugs has deterred wealthy potential visitors and caused the closure of recently-established galleries. This project will utilize spatial and statistical tract-level data acquired from the United States Census Bureau and other free, publicly-accessible sources, to perform an assessment, utilizing GIS mapping and analytical tools, of economic conditions in North Sacramento versus the City of Sacramento, both before and after annexation. | |
|
Background An internet review of literature reveals that there are numerous major university studies involving the creation of GIS data from historical United States Census information, primarily for each institution’s local region. Portland State University has produced an excellent website at http://www.upa.pdx.edu/IMS/currentprojects/TAH/Data/DT_Census.html providing downloads of demographic and economic attribute files for the Portland, Oregon region from 1940-present, but contains little explanation of methods used to produce the study. The Inter-University Consortium for Political and Social Research (ICPSR) at http://webapp.icpsr.umich.edu/cocoon/ICPSR-SERIES/00196.xml offers “Archive Study No. 2931 (Census Tract Data: Elizabeth Mullen Bogue File)” containing 1940-1970 Census attribute data for many major cities, including Sacramento, but access is limited to ICPSR users and member institutions. In addition, there are private statistical companies offering expensive, pre-packaged demographic and economic datasets for 1970-2000 for most major metropolitan regions. Two studies were of particular assistance for this project. The first, Sacramento State University’s “Evolving Ethnic Patterns in Sacramento” at http://webpages.csus.edu/~redatel/ involved a parallel study of Sacramento demographic information from 1950-2000 which provided decade-by-decade methodology used below. Additionally, the University of Texas Dallas published an ArcView class exercise at http://utdallas.edu/~briggs/poec5319/av9ex4.doc with detailed instructions on creating and editing shapefiles for historical Census tract maps not yet available in digital format. | |
|
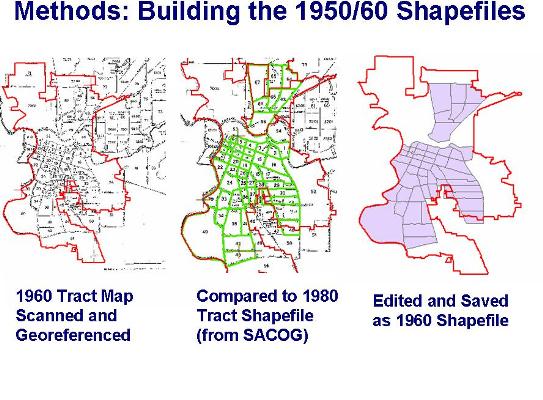
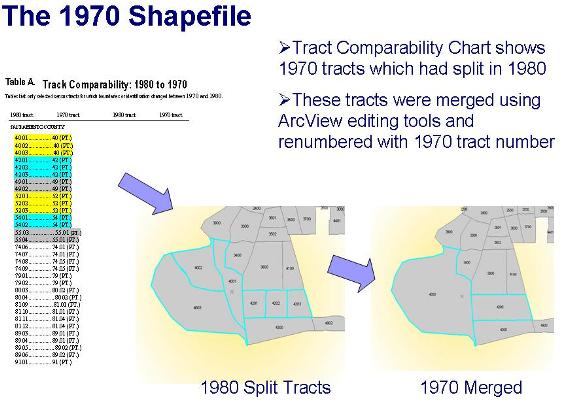
Methods Spatial Data The following shapefiles were created in order to generate a multi-layer map in ArcView containing spatial data for Census years 1950-2000: The Sacramento City 2000 Boundary: A County of Sacramento City Boundaries 2000 shapefile was acquired. From this, the City of Sacramento was selected and saved as a separate shapefile. This boundary was utilized for all georeferencing tasks of hard-copy maps, as well as to select City of Sacramento Census tracts from U.S. Census TIGER/Line downloads, which are available in County-level data sets only. The 1964 Annexation Area: The City Planning Commission’s Annexation History Map was scanned and georeferenced against the Sacramento City Limits 2000 boundary. The 1964 North Sacramento Annexation Area was drawn in ArcView edit mode and saved as a separate boundary shapefile. This shapefile served both as a visual reference in the final map and performed an important task during the analysis stage of the project. Prior to annexation, North Sacramento existed as a separate, easily-identified geographic entity. Following annexation, Census tracts for North Sacramento would be embedded within the Sacramento tract information. Utilizing ArcView’s “select by location” feature, this shapefile was used to pull North Sacramento attribute data from the entire Sacramento data set, allowing a quick “inside and outside” comparison of attributes by switching the selection in the attribute table. Sacramento County Census 2000: Utilized as a background for the final map, this shapefile was acquired from ESRI’s Census 2000 TIGER/Line Data Download website. Sacramento City Census 2000: The Sacramento City 2000 Boundary was utilized to select from the Sacramento County Census 2000 shapefile all tracts which had their center in the Sacramento City limits, and saved as a separate shapefile. Sacramento City Census 1990: This State-level Census tract shapefile was downloaded from an ESRI CD-Rom, and Sacramento City tracts were selected, and saved as a shapefile. Sacramento City Census 1980: A shapefile of 1980 Sacramento Census tracts was located and downloaded from the Sacramento Area Council of Government's (SACOG) Mapping Data website. Its attribute table contained Census tract number and total population fields only. Sacramento City Census 1970: Currently unavailable, this shapefile was created utilizing the Sacramento City Census 1980 shapefile and the Tract Comparability Chart provided in Census 1980 records (see slide below). This chart documents all tracts which have split between Census years. Once split tracts were located on the 1980 map, the tract polygons were merged using ArcView editing tools and renumbered with the 1970 tract numbers. This process was applied to five areas on the 1970 tract map; otherwise, there were no other changes between the 1970 and 1980 tract maps. Sacramento/North Sac Census 1960: The original paper 1960 map was obtained from the California State Library. This was scanned and georeferenced against the Sacramento City limits 2000 boundary. A near-perfect match occurred when the 1980 SACOG shapefile was laid over the scanned map (see slide below). The appropriate 1960 tracts were then selected from the 1980 dataset, renumbered (when necessary), and saved as a shapefile. Sacramento/North Sac Census 1950: Again, the paper map was obtained from the California State Library, scanned and georeferenced against the Sacramento City limits 2000 boundary. The newly-created 1960 tract map was laid over the scanned map and boundaries compared. Significant editing had to be done along the Northern and Eastern boundaries of the 1960 Sacramento City tracts, as well as the removal of numerous tracts not yet included in the 1950 data. When all acquired and created shapefiles were added into ArcView, it was discovered that not all datasets were in the same projection. The Sacramento City Boundary file and the 1980 Census tract file (which was used as the basis for creating the 1950, 1960 and 1970 shapefiles) were projected in NAD83 State Plane California II FIPS. A review of TIGER/Line metadata revealed that the 1990 and 2000 Census tract shapefiles, although containing the NAD83 coordinate datum, were unprojected; thus appearing in ArcView as Assumed Geographic projection, with an assumption of NAD27. This caused an apparent datum shift between the 1980 and 1990/2000 tract boundaries after “on the fly” projection in ArcView. This misalignment was corrected by applying a NAD83 projection to 1990 and 2000 shapefiles, reintroducing them into the map’s NAD83 State Plane II FIPS data frame, and then exporting and resaving the 1990 and 2000 shapefiles in the projection and coordinate system of the data frame. In this manner, all nine shapefiles were projected in NAD83 State Plane California II FIPS. Attribute Data The same availability limitations found with spatial data applied to tabular data – an abundance of ArcGIS-compatible economic information for 1990 and 2000, limited availability for 1970 and 1980 (other than through purchase or access to university studies), and virtually no data for 1950 and 1960 in digital format. As a result, an in anticipation of an enormous data-entry task, it was decided to limit the creation of attribute tables to the years 1950, 1960, 1990 and 2000. While omission of 1970 and 1980 from the study limits the ability to evaluate the effect of the 1964 annexation, the decades selected still provide an effective “before and after” comparison of the event. Attributes were selected from the earliest data set – the 1950 U.S. Census population, housing, and labor tables. After verification of their presence in all subsequent data sets, the following basic, “quality of life” economic parameters were selected: Total Population Median Household Income College Graduates In Population Over 25 Years Old Unemployment Median Home Value Median Rent Owner Occupancy Renter Occupancy Vacant Units Matching fields were created, named, and domains established in attribute tables for all four shapefiles. As the data for 1950 and 1960 were unavailable in digital format, the figures for these years were manually entered, tract-by-tract, into the attribute tables. The time involved in this laborious process was a critical element in the decision to exclude the 1970 and 1980 tabular data from this project. The vast amount of GIS-compatible data available for U.S. Census years 1990 and 2000 made population of the attribute tables for these years an exercise in locating the selected attributes within huge data sets, as well as a thorough lesson in numerous aspects of ArcView functionality. Most of the attributes for 1990 were joined to the attribute table from a CD-ROM of demographic and economic data produced by ESRI. The join was accomplished after modifying the Geographic Identifier field using SQL code. Attributes not included in the dataset were located and joined from American FactFinder, the process of which is explained below. 2000 attribute information was obtained entirely from American FactFinder, a website generated and maintained by the United States Census Bureau in conjunction with Census 2000, which provides a source for demographic and economic data to attach to U.S. Census TIGER/Line files. American FactFinder creates tables for a selected geographic area from drop-down menus of hundreds of Census 2000 data elements, which can then be exported as Excel documents and joined to ArcView shapefiles through the creation of an Open Database Connectivity (ODBC) connection in Windows, and then accessed through ArcCataog. Alternatively, the Excel document created in American Fact can be resaved as a .dbf file and then joined to an ArcView shapefile after modifying the Geographic Identifier field with SQL code. For more information on these procedures, see American FactFinder’s Creating Tables and Downloading Tables. | |
 | |
 | |
|
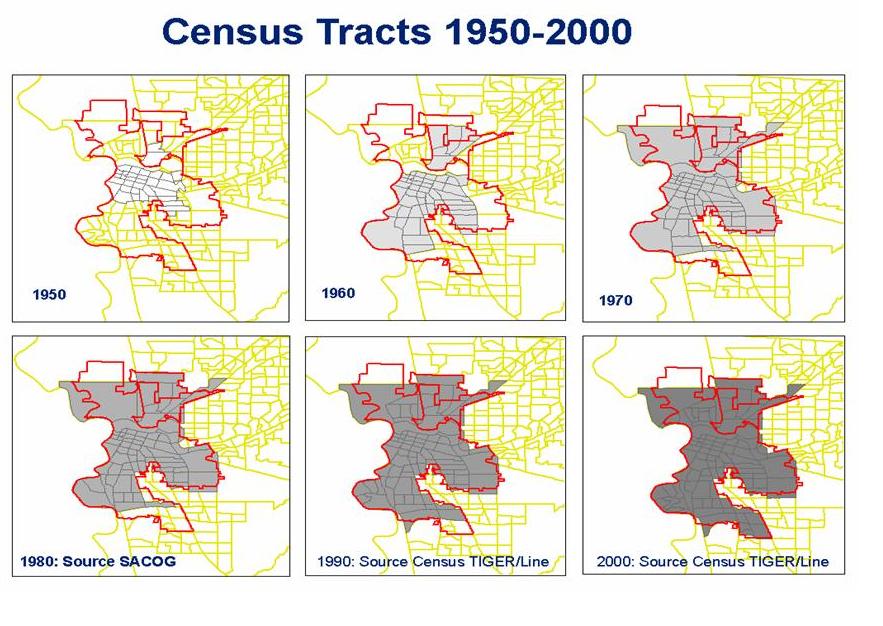
Results These methods produced an ArcGIS map reflecting United States Census Bureau tracts for North Sacramento and Sacramento for the years 1950 and 1960, and the consolidated City of Sacramento for 1970-2000. The attribute tables for 1950 and 1960 contain basic economic parameters which can be queried to compare values between the two cities prior to annexation. The 1990 and 2000 tract maps, similarly populated, can be queried utilizing the 1964 Annexation Area boundary and ArcView’s “select by location” function, to pull data from what was once North Sacramento, now contained within the City of Sacramento. | |
 | |
|
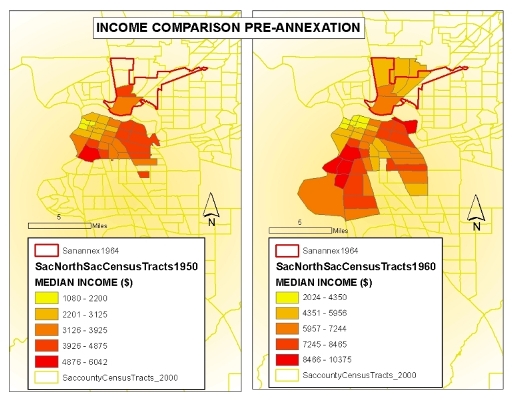
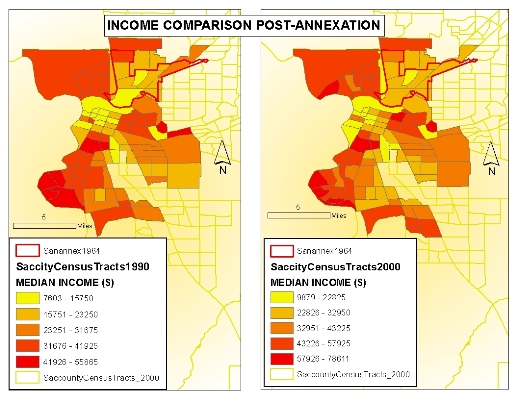
Analysis An analysis of the data acquired and created for this project confirms its initial hypothesis – that a once-affluent community has become one of the most economically undesirable areas of the City of Sacramento. The patterns reflected in the graduated color analysis of median household income below remain remarkably consistent when applied to median home value and owner occupancy data also obtained for this project. The maps also dramatically display the shift in wealth from the traditional City center to the outer suburban communities, which continues to this day. In 1950, the City of North Sacramento was a community of middle- and upper-middle-income residents, with low unemployment rates. Only the Land Park area in the City of Sacramento boasted a higher median income. Despite these income levels, home values remained moderate, resulting in home ownership levels among the highest in the region, with a very low vacancy rate. A surprisingly small percentage of college graduates (which maintained through all four decades) suggests that most North Sacramento residents derived their incomes from the small business and industrial employment that was prevalent along the Del Paso Boulevard corridor at that time. The 1960 data indicates that, while the Southern Census tract of North Sacramento containing the Del Paso Boulevard Central Business District maintained its relative position in relation to income, home value, home ownership and unemployment, the Northern tract dropped from upper-middle to middle levels in all four categories. The apparent continued viability of the Central Business District is surprising, considering that the 1960 figures should begin to reflect the impact of the opening of the North Sacramento Freeway, which diverted most vehicular traffic away from Del Paso Boulevard. The two decades following annexation were not kind to North Sacramento. A strikingly dramatic drop in median income, median home value and owner occupancy is reflected in the 1990 data. The 1964 Annexation Area in general, and the original Del Paso Boulevard Central Business District in particular, contain some of the lowest figures in these three values in all of Sacramento, with a marked increase in renter occupancy, vacant units, and unemployment. Clearly, the area’s designation in 1992 as an “Area of Urban Redevelopment” was warranted. Perhaps as a result of attention from City leaders, and the resultant influx of modest urban renewal projects, a slight rebound in median income occurs in 2000. Home buyers, attracted (as was this project’s author) by the district’s modest median home values, boosted owner occupancy into the moderate range, although vacancy rates and unemployment remain among the highest in Sacramento. Clearly, a great deal of work in the area of economic redevelopment remains to be done. . | |
 | |
 |
Conclusions It is difficult to view North Sacramento today and envision its heyday as the “Roseville of its Time.” Long-time residents are eager to share nostalgic stories of good, high-paying industrial jobs building military aircraft, parades on Del Paso Boulevard, childhood mornings at the Iceland Ice Rink, and then of their despair at the decline in the prosperity in this once-proud and now-troubled community. While a review of 1970 and 1980 data would have shed additional light on the subject, this project has attempted to document and graphically represent, using GIS technology, what anyone who lives in North Sacramento already knows: there has been an enormous drop in the quality of life there since being annexed by the City of Sacramento. The current decade brings a new era of proposed expansion and annexation for Sacramento, as it looks to expand its borders North and South to reap the benefits of revenue generated from new, luxury housing developments in the North Natomas and Elk Grove areas. It remains to be seen in this process whether other established, inner-city neighborhoods will, like North Sacramento, be left behind in the pursuit of the newer, larger, and more affluent City of Sacramento. |
|
References Fargo, Heather (Mayor), et al., 2005. "The Sacramento City General Plan, 2005, Reflecting City Council Amendments Through December, 2004". City of Sacramento. Graff, Fay, 1990. "A History of the North Sacramento School District". North Sacramento School District, pages 1-4, 9-10. Knight, Lara, 2000. "Final Report: Historical Development of Del Paso Boulevard." Sacramento Housing and Redevelopment Agency, pages 1-16. U.S. Bureau of the Census, “U.S. Census of Population and Housing, 1950. Census Tracts. Final Report". U.S. Government Printing Office, Washington, D.C., 1953. U.S. Bureau of the Census, “U.S. Census of Population and Housing, 1960. Census Tracts. Final Report". U.S. Government Printing Office, Washington, D.C., 1962. Web Pages American FactFinder, http://www.factfinder.census.gov, (November 2005). City of Sacramento.org, “City of Sacramento Annexation History Map”, http://www.cityofsacramento.org/dsd/maps/pdf/Annexation_History34X44.pdf, (October 2005). Datel, Professor Robin and Dougherty, Chris, Sacramento State University, “Evolving Ethnic Patterns in Sacramento”, http://webpages.csus.edu/~redatel/, (November 2005). ESRI, “Census 2000 Downloads”, http://www.esri.com/data/download/census2000_tigerline/index.html, (November 2005). Inter-University Consortium for Political and Social Research, “Census Tract Data, 1950: Elizabeth Mullen Bogue File,” http://www.icpsr.umich.edu/cocoon/ICPSR-STUDY/02931.xml, 1975, (November 2005). Sacramento Area Council of Governments (SACOG), Mapping http://www.sacog.org/mapping, (November 2005). Sacramento Council of Governments (SACOG), “Tracts 1980 Metadata”, http://www.sacog.org.mapping/metadata/descriptions/Tracts1980.html, November 2003, (November 2005). Sacramento History.org, “Illustrated Map of Sacramento and North Sacramento”, http://www.sacramentohistory.org/admin/photo/903_1697.pdf, (October 2005). Sacramento News and Review, www.newsreview.com/issues/sacto/2001-07-26/cover.asp, (October 2, 2005). State of California, Department of Finance, “1970-1980-1990-2000 Comparability File: General Guidelines”, http://www.dof.ca.gov, (November 2005). United States Census Bureau, “TIGER/Line Metadata”, http://www.census.gov/geo/www/timetadata/metadata.html, (November 2005). University of Texas, Dallas, “ArcView Exercise 4 – Census Tracts for Dallas,” http://utdallas.edu/~briggs/poec5319/av9ex4.doc, publ. 3/15/05, (November 2005). | |
|
Acknowledgments What began as a simple idea evolved into an enormous, complicated undertaking for an eager but sometimes overmatched GIS student. Many thanks to American River College instructor Paul Veisze for his assistance in unraveling the mysteries of map projections, as well as the lesson in persistence which led to the completion of this project. | |