|
EMILY SIEGEL Abstract Queries within ArcMap are a useful tool for resource monitoring. By using databases and computer software, monitoring becomes more efficient. This is especially necessary for environmental research because time and budgets are usually scarce. Using ArcMap not only saves time, but is usually a more accurate method of analyzing databases.
Introduction Due to the large number of ocean dischargers and small number of staff to regulate and monitor such discharges, more efficient methods need to be utilized. Because monitoring data is required by regional water boards from the dischargers, there is sufficient data about the discharges to create databases that can be used in ArcMap. Once layers are created from the data, queries can be used to identify points of interest. Interactive maps created in ArcMap can be useful for regulators, dischargers, and the general public. This process of data acquisition is still new for most people involved in the regulating and monitoring process, but is becoming ever-more utilized as its potential becomes more recognized.
Background The state of California contains more than 1,340 miles of coastline, and makes up nearly three-fourths of the Pacific coastline of the contiguous United States (WRCC 2006). There are about 1,658 ocean discharges in California, over 1,400 of these discharges are point sources (SCCWRP 2003). The state government closely regulates and monitors water dischargers, through state and regional water boards, to preserve marine life and water quality. Between 1973 and 1982, over 160 nations participated in The Third United Nations Conference on Law of the Sea (UNCLOS III). One of the issues covered during this conference was the boundaries of the exclusive economic zones (EEZ). The EEZ is defined as “is a seazone over which a state has special rights over the exploration and use of marine resources” and generally extends about 200 nautical miles from shore (wikipedia 2006). The internal, or state, waters are the portion of the ocean that each state within the United States has jurisdiction over, and this area extends 3 nautical miles from the state’s coastline. The PORTER-COLOGNE WATER QUALITY CONTROL ACT (CAL. WATER CODE, DIVISION 7) became effective in California on January 1, 2006. In §13170.2 the California Ocean Plan is outlined. It charges the state board with the responsibility of formulating and adopting a water quality control plan for ocean waters of the state, known as the California Ocean Plan. It states that the plan is to be reviewed at least every three years “to guarantee that the current standards are adequate and are not allowing degradation to indigenous marine species or posing a threat to human health” (SWRCB 2006). The FEDERAL WATER POLLUTION CONTROL ACT (33 U.S.C. § 1251 ET SEQ.) also became effective on January 1, 2006. Section 403 [33 U.S.C. 1343] outlines the ocean discharge criteria and the issuance of permit and waivers for dischargers. Permits are issued to dischargers that follow specific guidelines and are determined to not negatively impact water quality, marine life, and human health. The National Pollutant Discharge Elimination System (NPDES) program is a federal program, which has been delegated to the State of California for implementation. NPDES permits, also referred to as Waste Discharge Requirements, are issued to regulate the discharge of municipal wastewater or industrial process, cleaning, or cooling, wastewaters, commercial wastewater, treated groundwater from cleanup projects, or other wastes to surface waters only (SWRCB 2006). Areas of Special Biological Significance (ASBS) are a subset of State Water Quality Protection Areas (SWQPA) (PUBLIC RESOURCES CODE). 34 ASBS were designated in the 1970’s by the State Water Resources Control Board. They are regulated through the California Ocean Plan, which states: “Waste shall not be discharged to designated Areas of Special Biological Significance…” (SWRCB 2006). Six of the nine regional water quality control boards are located in coastal areas. These boards are in charge of monitoring dischargers within their regional boundaries. The regional boards collect monitoring data from the dischargers for review. The state water resources control board has collected large amounts of monitoring data from the regional boards, creating databases and files which may be used with GIS software (SWRCB 2006).
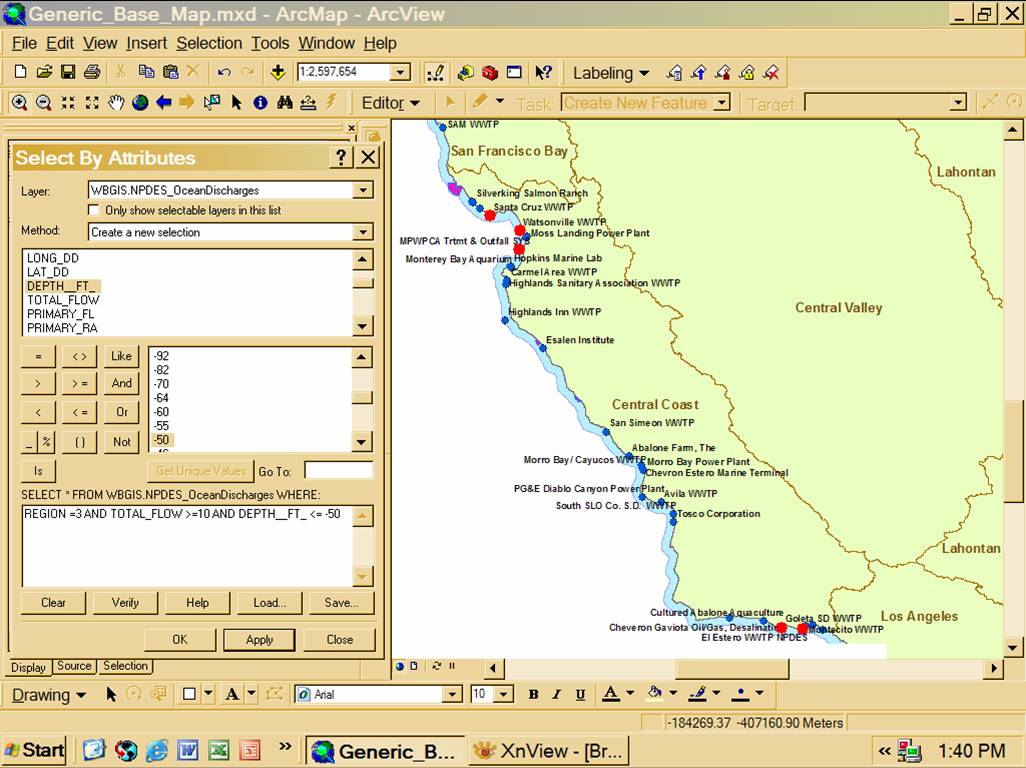
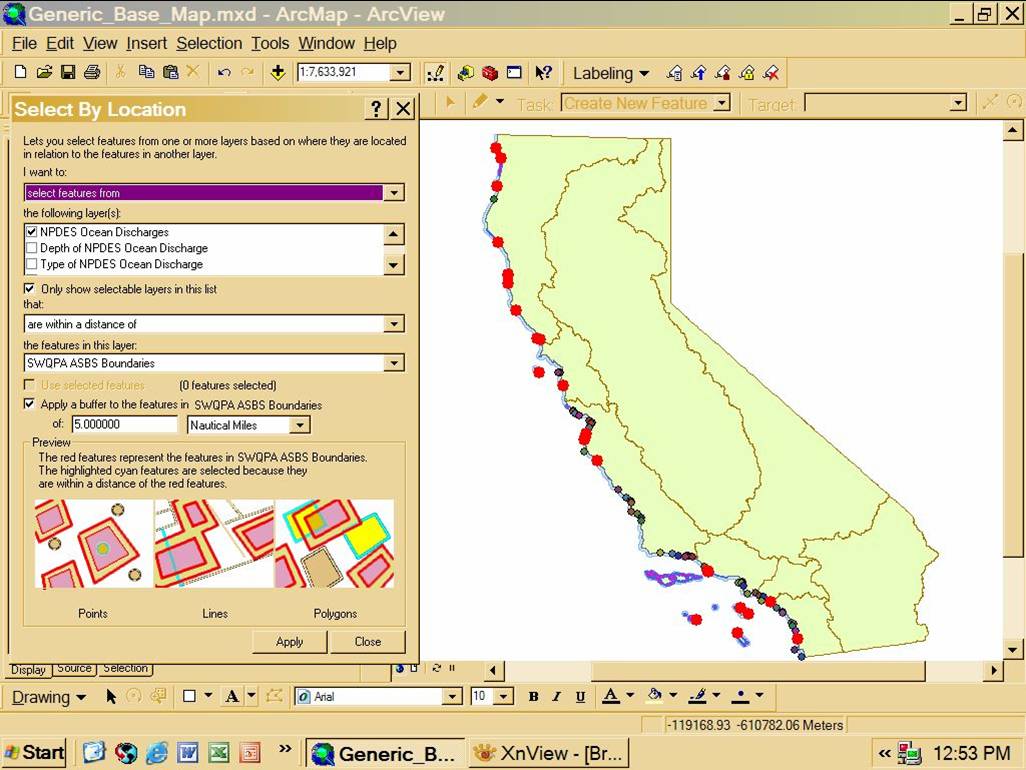
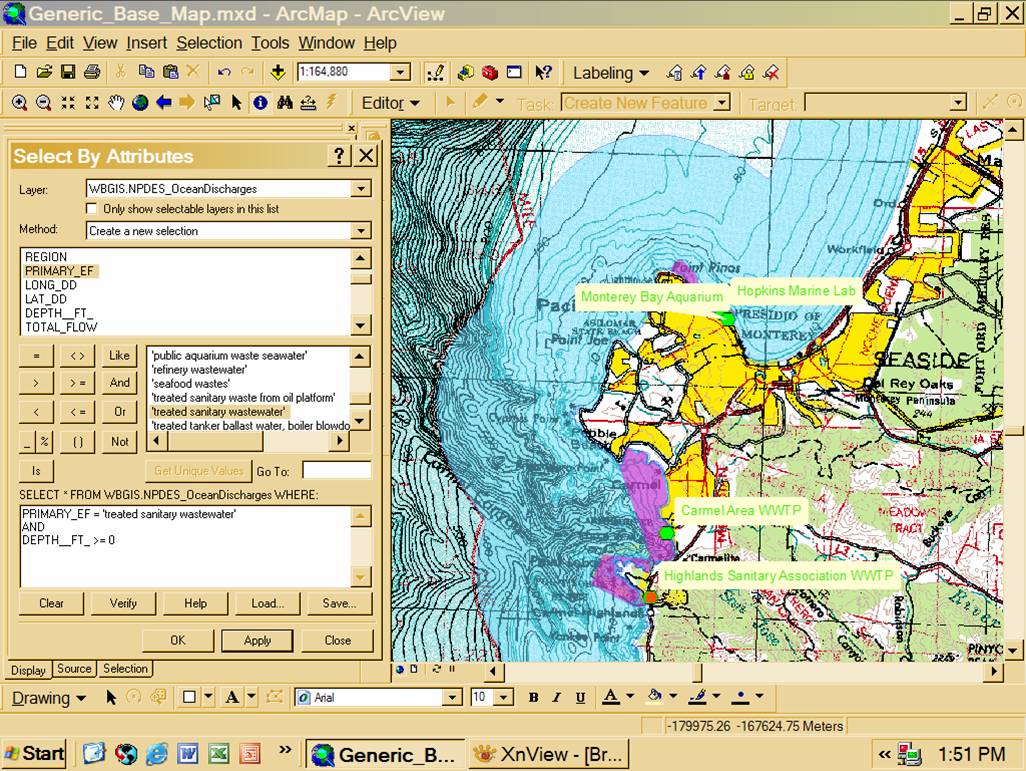
Methods Data and satellite imagery was collected from the archives of the State Water Resources Control Board’s division of Information Technology. Layers included satellite and topographic imagery, boundary areas, and ocean discharge points. Each point in the ocean discharge layer included multiple attributes, such as discharger name, geographic location of discharge, type of discharge, depth of discharge, and discharge flow. Using the acquired layers of information and ArcMap 9.1, several maps of the California coastline were created. ArcMap has the ability to make queries specified by the user. One such query is a ‘select by attribute’ query, where specific discharge points can be identified based on specified attributes. A ‘select by attribute’ query was created to identify discharges that were located within a specific region, flowed at a rate greater than or equal to 10 million gallons per day (MGD), and discharged at a depth of 50 feet or less (Figure 1). Another ‘select by attribute’ query was created to identify treated sanitary wastewater discharges occurring at the surface of the ocean. This second query identified a discharge that occurred within the Carmel ASBS (Figure 2). Another type of query is a ‘select by location’ query, where specific discharge points at specified locations can be identified. One such query was created to identify all discharges located at 5 nautical miles or less from an ASBS boundary (Figure 3).
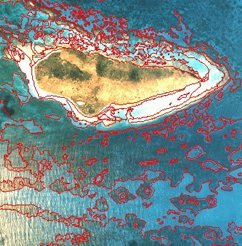
Figure 2. Attrubute-based query results. Query was created to identify treated sanitary wastewater discharges occurring at the surface of the ocean. Query identified a discharge that occurred within the Carmel ASBS.
Figure 3. Location-based query results. Query was created to identify all discharges located at 5nm or lessfrom an ASBS boundary.
Conclusion GIS software has an amazing ability to simplify data inquiries, if accurate data is obtained. With so many discharge locations within the state of California, using traditional methods of data inquiry is time consuming, expensive, and not necessarily accurate. Because traditional methods are much slower, it may take years to assess the situation at discharge points and implement proper monitoring. Creating queries in ArcMap can allow the user to accurately locate points of interest. This method of data acquisition can assist the regional and state water boards in their implementation and regulation of ocean dischargers. By using a more efficient method of data inquiry, such as ArcMap, those in charge of protecting our ocean resources are able to so more resourcefully, benefiting all life dependent on our ocean.
Discussion and More Information
More complex maps and models can be created for similar purposes, using other types of data and software. SCCOOS (Southern California Coastal Ocean Observing System) has and is doing intensive research in the southern California bight. They have collected multiple types of information using various methods to create maps and models of the ocean, furthering our understanding of currents, climate, and ecology. Go to SCCOOS's Homepage for more information NOAA (National Oceanic and Atmospheric Administration) has spent the past several years using satellite imagery, along with ground-truthing, to create benthic habitat maps of the U.S. coasts (Figure 4). Go to NOAA's Benthic Mapping Homepage for more information By incorporating more data and different types of data, a better understanding of our ocean, and the impacts we have on it, can be obtained. Most likely GIS will become used more to monitor our environment.
References ASBS Ocean Plan Exception Process, Pre-Exception monitoring FAQ’s (2006) csc.noaa.gov/benthic/data/data.htm PROHIBITION OF WASTE DISCHARGES INTO THE PACIFIC GROVE MARINE GARDENS AND HOPKINS MARINE LIFE REFUGE AREA OF SPECIAL BIOLOGICAL SIGNIFICANCE (SWRCB) sccoos.org STATE WATER RESOURCES CONTROL BOARD RESOLUTION NO. 2006 – 0013 (2006) swrcb.ca.gov/ciwqs/index.html CLICK HERE for more information from SWRCB's website! |