Title |
||
| Author |
||
| Abstract Global warming can result in sea level rise by melting ice sheets in Greenland and West Antarctica and can have far-reaching impact for infrastructure and transportation planners. Effects were modeled using ArcScene and provide realistic view of impact. Issues must be address now and near term to mitigate and prepare for potential land loss. |
||
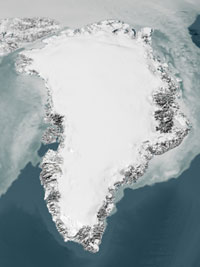
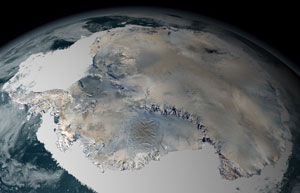
| Introduction In May this year, a documentary film, An Inconvenient Truth, was released predicting the possible impact of global warming that would have far reaching impact to the way we live. It projects serious consequences of global climate change from the human generated greenhouse gases in the near future if the continued use of carbon based sources of energy, resulting from the production of carbon dioxide (CO2), is not reduced or eliminated. ABC News followed up with a 20/20 news magazine special, called Seizing the Future: Seven Ways the World Could End and What We Can Do To Save It, on August 30th and selected global warming and climate changes as the most likely scenario that the world could end. Their focus was the impact and consequence caused by the melting of the ice sheets that cover Greenland and West Antarctica and is now retreating at an alarming rate. To illustrate the impact of total loss of the Greenland and Western Antarctic ice sheets, consequences of sea level rise, that can possibly engulf coast communities, will be explored using the city of San Francisco as a case study. What will sea level rise have on transportation and/or infrastructure? |
||
| Background |
||
|
||
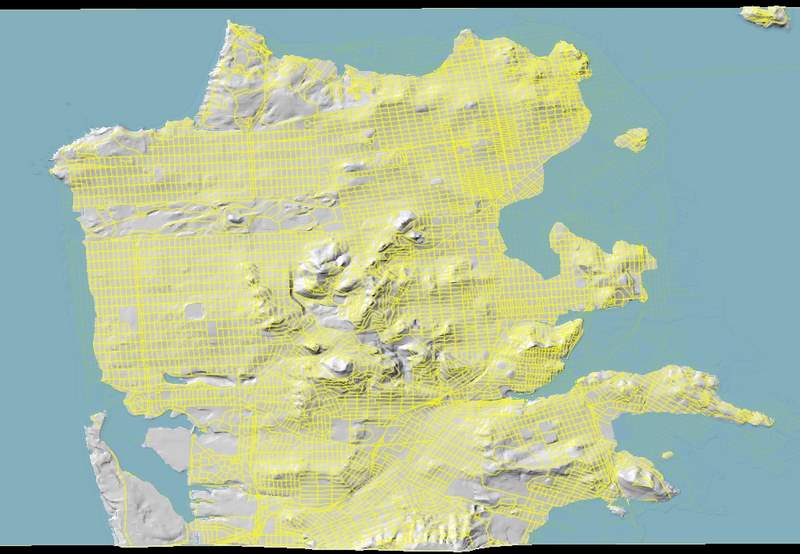
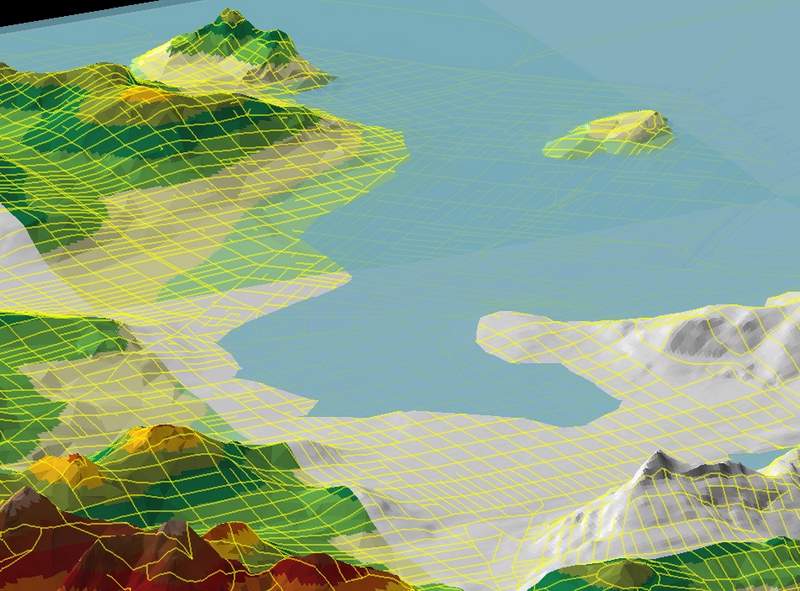
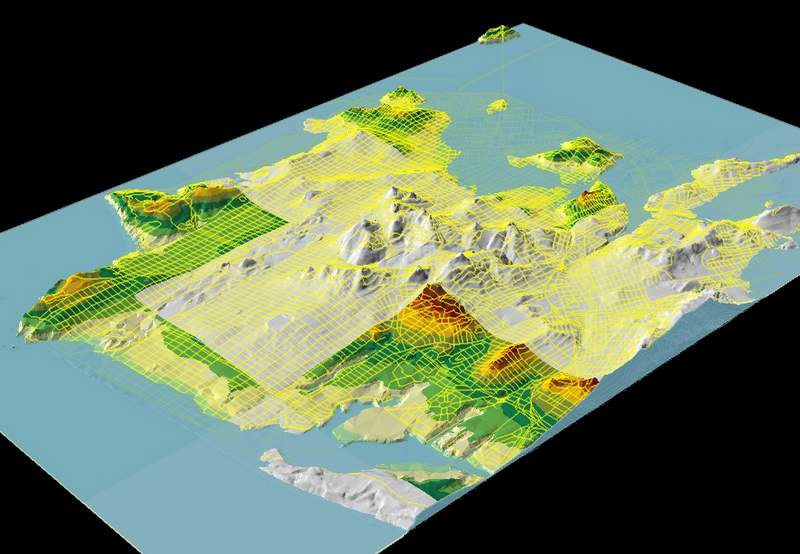
| Methods To determine the impact of sea level rise, Spatial 3D Analysis in ArcScene was used to model such a scenario. Complete loss of Greenland and West Antarctic Ice Sheet will account for a 12m rise. Digital Elevation Model (DEM), plane surface, and transportation shape files were added into the Table of Contents of ArcScene and used to performed the analysis. Plane surface represents sea level at 0m, and the height was varied to simulate sea level rise. Contour, hillshade and Triangulated Irregular Networks (TIN) surfaces were generated from the DEM using default settings to provide enhanced visualization of the actual surface representation of San Francisco. Symbology for the DEM was classified into 15 layers using Elevation #1 with break points at 10m and 20m through 280m at 20m intervals. Then the layers were stacked in the Table of Contents in the following order: contour, transportation, plane surface, DEM, hillshade, and TIN such that all above layers pointed to the TIN layer to provide height reference. Vertical exaggeration was rendered at 3.32x10⁻⁵, and transparency was set at 45% for contour and transportation layers. To demonstrate the effect of sea level rise, the plane surface layer height was disengaged from the TIN layer and set at 7m and 12m manually. The different heights illustrated the impact of the loss of the Greenland ice sheet and of both Greenland and West Antarctic ice sheets completely melted. Snapshots of the effects were taken from different elevations and angles, and were exported to graphic formats. |
||
Results
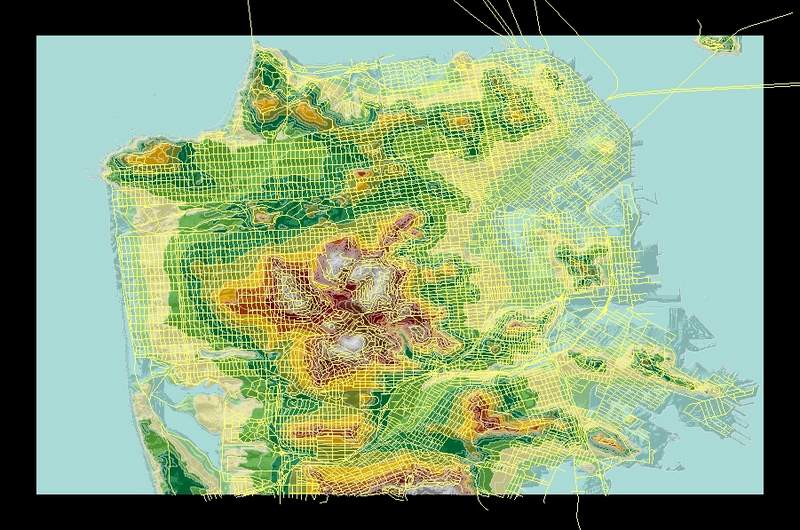
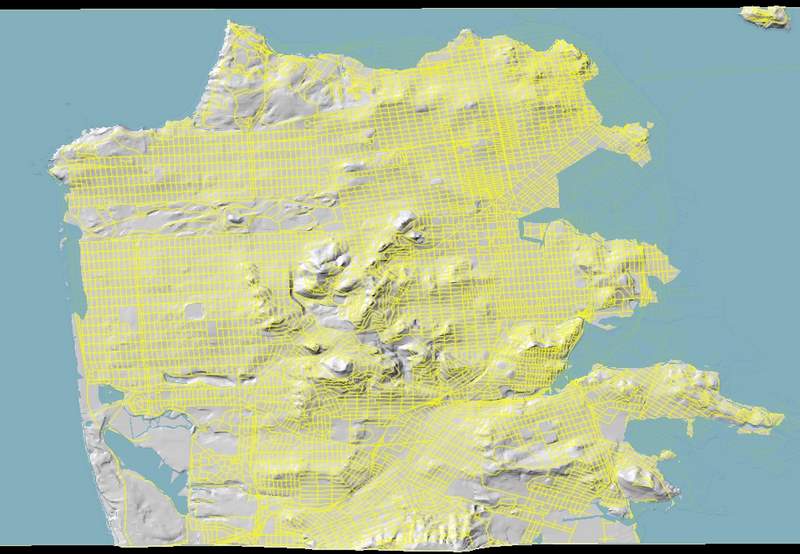
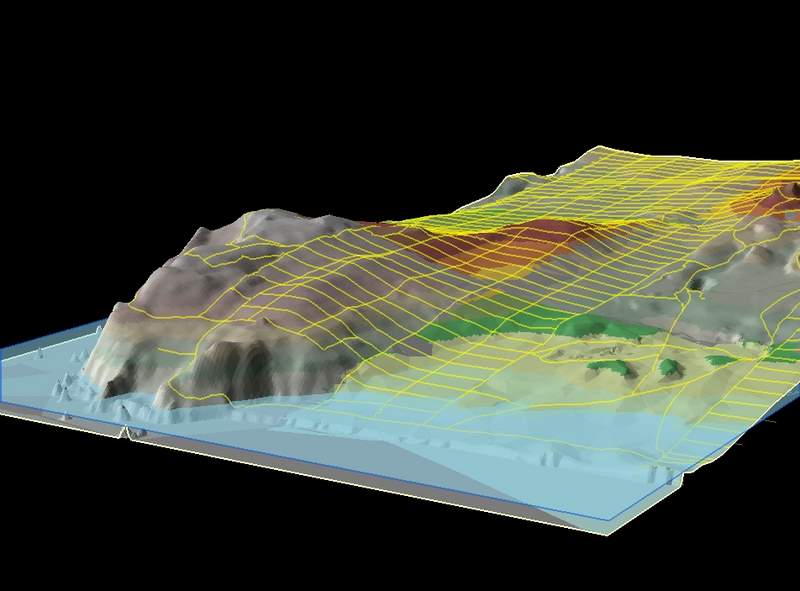
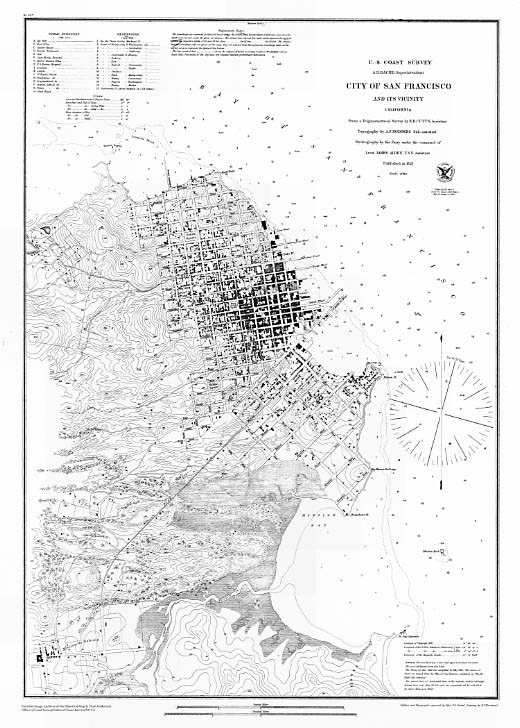
Actual data was generated from ArcScene, and the graphics files were exported to jpg format. San Francisco today is shown with elevation contours at 0, 10, and 20-280m at 20m intervals in Figure 3. 3D graphics from above and vantage points over San Francisco show effects of both 7m and 12m sea level rise in Figures 4 - 7. Ocean Beach on the western edge of the outer Richmond District is shown in detail at 12m sea level rise in Figure 8. A map of San Francisco in 1853 details the original downtown area outline in Figure 9. Data was downloaded from http://seamless.usgs.gov , which included DEM at 10m, NAD83, and 1:24K scale and Bureau of Transportation Studies (BTS) roads layer for the City and County of San Francisco. Shape files of the City and County of San Francisco were extacted from the downloaded files. Those data files were added in ArcScene. The DEM was processed into Hillshade, converted to TIN, and layered accordingly for 3D spatial analysis. This provided the best model and orientation to show the impact of sea level rise. |
||
| Figures |
||
|
||
|
||
|
||
|
||
|
||
|
||
|
||
| Analysis
Sea level increase would raise and change the groundwater table (Titus, 1990). Given that San Francisco’s storm and sewer system is along the beach and waterfront areas (Wastewater Enterprise, 2006), there would be increased cost to maintain habitability and functional use of the system since natural gravitation of systems would be lost and mechanical pumps would have to be installed to compensate if the sea could be held back first. Sustaining storm and sanitary sewer systems would be a challenge since those are below ground, and an endeavor to reroute is more difficult since treatment plants would be impacted by the sea and in the 12m rise zone. Downtown, parts of the Financial district, south of Market area, and Marina district would be submerged. Ironically, sea level rise could reclaim low-lying areas that have been filled in the last 150 years. Figure 9 shows San Francisco as it was in 1853 with much of the Downtown area part of the bay. Given that the Downtown and Financial districts are the business heart of the city, sea level rise would substantial economic impact and loss of jobs. This is apparent by the way transportation is currently setup to feed the workforce into those areas (MUNI, 2006). Access to the East Bay would be cutoff because BART Downtown stations are underwater as well as freeway on-ramps. Electricity is routed in the downtown area through underground vaults. There would be power to habitable areas around the flooded areas if the power grid is routed aboveground beforehand. Given that city has a grid road system, there is no issue or problem to retreat from rising water unless the area is an isolated hill on the east side of town. San Francisco's major thoroughfares run north-south and west-east in the interior of the city. Roads and streets along the periphery are scenic or tourist routes. Successful analysis was dependent on an intimate knowledge of how the city’s infrastructure and transportation system works. However, there are a number of drawbacks and/or limitations. Parcel maps of target area could not be obtained to determine impact and losses of real estate and land values. In addition, total surface area flooded by water could not calculated with ArcScene. ArcScene does not have ability to perform surface and volume calculation tasks without some manual calculations. Raws number can be obtained from Volume and Surface Area selection from Surface Analysis of 3D Analyst. Color loss was due to insufficient video card on-board RAM memory (hardware issue). Long lead time was required to determine the most suitable data source because finding the appropriate data source was more trial and error initially. Transportation road layer does not highlight major streets or thoroughfares. In addition, labeling those streets was not available. Vertical exaggeration was manually set by trial and error since the default values were producing unacceptable results. In addition, legend and scale insert option is not available in ArcScene. |
||
| Conclusion Remedy and mitigation of sea level rise problem is dependent on following Mr. Titus’ recommendations (Titus, 2002). Long term planning for infrastructure to mitigate impact to land loss claimed by the sea. Sea level rise will be gradual unless there is catastrophic and abrupt collapse of the ice sheets that would trigger a sudden sea level increase. |
||
| References BART. 2006. System Map [on-line]. Oakland, CA: San Francisco Bay Area Rapid Transit District; available from http://www.bart.gov/stations/map/systemMap.asp; Internet; accessed 16 December 2006. Bindschadler, R. A. 1998. What is Happening to the West Antarctic Ice Sheet? [on-line]. Washington D.C.: American Geophysical Union; available from http://www.agu.org/sci_soc/articles/bind.html; Internet; accessed 1 December 2006. Buis, Alan. 2002. NASA Study Finds Rapid Changes in Earth’s Polar Ice Sheets [on-line]. Pasadena, CA: Jet Propulsion Laboratory; available from http://www.jpl.nasa.gov/releases/2002/release_2002_168.html; Internet; accessed 29 November 2006. Cole, Stephen. 2006. Impact of Climate Warming on Polar Ice Sheets Confirmed [on-line]. Greenbelt, MD: NASA Goddard Space Flight Center; available from http://www.nasa.gov/vision/earth/environmental/ice_sheets_prt.htm; Internet; accessed 28 November 2006. Eilpern, Juliet. 2006. Antarctic Ice Sheet is Melting Rapidly [on-line]. Washington D.C.: The Washington Post; available from http://www.washingtonpost.com/wp-dyn/content/article/2006/03/02/AR2006030201712_pf.html; Internet; accessed 28 November 2006. Eilperin, Juliet. 2006. Greenland’s Melting Ice Sheet May Speed Rise in Sea Level [on-line]. Washington D.C.: The Washington Post; available from http://www.washingtonpost.com/wp-dyn/content/article/2006/08/10/AR2006081001557_pf.html; Internet; accessed 28 November 2006. Kay, Jane. 2006. If You Thought Last Week Was Hot…Higher temperatures, rising ocean, loss of snowpack forecast for state [on-line]. San Francisco, CA: San Francisco Chronicle; available from http://www.sfgate.com/cgi-bin/article.cgi?f=/c/a/2006/08/01/MNGDAK90EK1.DTL&hw=If+you+thought+last+week+was+hot&sn=002&sc=954; Internet; accessed 16 November 2006. McGuire, Bill. 2005. Issues in Risk Science 5: Dangerous Climate Change: rising sea-levels and ocean circulation changes [on-line]. London, United Kingdom: Benfield Hazard Research Centre; available from http://www.benfieldhrc.org/activities/issues5/dcc.htm; Internet; accessed 29 November 2006. MUNI. 2006. Downtown Map [on-line]. San Francisco, CA: San Francisco Municipal Railway; available from http://transit.511.org/providers/maps/SF_915200533330.gif; Internet; accessed 16 December 2006. MUNI. 2006. Market Street Map [on-line]. San Francisco, CA: San Francisco Municipal Railway; available from http://transit.511.org/providers/maps/SF_724200640635.gif; Internet; accessed 16 December 2006. MUNI. 2006. System Map [on-line]. San Francisco, CA: San Francisco Municipal Railway; available from http://transit.511.org/providers/maps/SF_915200524737.gif; Internet; accessed 16 December 2006.System Map Perlman, David. 2006. Oceans Rising Fast, New Studies Find Melting ice could raise levels up to 3 feet by 2100, scientists say [on-line]. San Francisco, CA: San Francisco Chronicle; available from http://www.sfgate.com/cgi-bin/article.cgi?f=/c/a/2006/03/24/MNG22HTITV1.DTL&hw=Oceans+Rising+Fast&sn=001&sc=1000; Internet; accessed 16 November 2006. Poore, Richard, 2000. Sea Level and Climate [on-line]. Reston VA: U.S. Geological Survey; available from http://pubs.usgs.gov/fs/fs2-00/; Internet; accessed 16 November 2006. Titus, James. 1990. Greenhouse Effect, Sea Level Rise, and Land Use [on-line]. Washington D.C.: U.S. Environmental Protection Agency; available from http://yosemite.epa.gov/OAR/globalwarming.nsf/UniqueKeyLookup/SHSU5BURAD/$File/landuse.pdf; Internet; accessed 28 November 2006. Titus, Jim. 2002. Does Sea Level Rise Matter to Transportation Along the Atlantic Coast? [on-line]. Washington D.C.: U.S. Department of Transportation; available from http://climate.dot.gov/workshop1002/titus.pdf; Internet; accessed 16 November 2006. Wastewater Enterprise. 2006. Wastewater System Map [on-line]. San Francisco, CA: San Francisco Public Utilities Commission; available from http://sfwater.org/detail.cfm/MC_ID/14/MSC_ID/117/C_ID/3101; Internet; accessed 13 December 2006. Wikipedia. 2006. An Inconvenient Truth [on-line]. St. Petersburg, FL: Wikipedia, the free encyclopedia; available from http://en.wikipedia.org/wiki/An_Inconvenient_Truth; Internet; accessed 12 October 2006. Wikipedia. 2006. Effects of global warming [on-line]. St. Petersburg, FL: Wikipedia, the free encyclopedia; available from http://en.wikipedia.org/wiki/Effects_of_global_warming; Internet; accessed 12 October 2006. Wikipedia. 2006. Ice sheet [on-line]. St.
Petersburg, FL: Wikipedia, the free encyclopedia; available from
http://en.wikipedia.org/wiki/Ice_sheet;
Internet; accessed 12 October 2006. |