| Title Target Obesity - Examining Obesity Trends Using GIS |
|
|
Author Michael Ziyambi American River College, Geography 350: Data Acquisition in GIS; Fall 2006 Email: mziyambi@sbcglobal.net |
|
|
Abstract This project seeks to investigate the existence of geospatial trends when considering certain influencing factors, physical fitness and level of caloric intake, in terms of their contribution to the rates of obesity in the United States. Although many maps exist showing the distribution of obesity on a national level, many do not isolate individual influential factors in order to examine their geographic effect on obesity. By making the assumption that the number of fitness centers in a state can represent the general level of fitness for the state, and also that the number of fast food centers represents the states' level of caloric intake, data can be collected and symbolized in a mapping environment in order to see whether any trends exist linking these factors to obesity rates. Based on these and other assumptions, the symbolized maps obtained in this way show a correlation between the obesity ranking of each state, and its level of physical activity and caloric intake. Although these factors definitely have a geographic distribution in terms of their effect on obesity, the actual effects are subjective since any number of factors or combinations of factors may have an un-quantifiable effect on obesity as well. | |
|
Introduction For the purposes of this project, a limited number of factors will be considered. Do fitness levels and caloric intake have any effect on obesity? In order to answer this question, data will be collected to compare fitness levels and caloric intake levels on a nation-wide level. The data trends will be cross-referenced with state obesity rankings in order to determine if there is any correlation. For the purposes of this project, the number of fitness centers in each state was used as a measure of the level of fitness, and the number of fast food centers in each state as a measure of the caloric intake. |
|
|
Background According to the National Center for Health Statistics, 66.3% of adults aged 20 and older are either overweight or obese, and 32% of all adults in this age range are obese. Troubling numbers also exist in the younger age groups, with 17% of adolescents aged 12-19 being obese, and 17% of children aged 6-11 being obese. Although no specific research was found that attempts to isolate caloric intake and physical fitness in order to see their individual effects on obesity in a geographic environment, the Center for Disease Control and Prevention (CDC) has long been involved in showing geographic patterns and trends associated with obesity in the United States. The maps produced by the CDC showing national trends in 1991, 1995 and 2004, however, take into account the actual distribution of obesity on a national level broken down by state. The data used to prepare these maps therefore encompasses all factors affecting obesity and also their combinations. | |
|
Methods The two factors under consideration were investigated separately and not in combination. It was assumed for this project that the higher the number of fitness centers in each state, the more exercise conscious the 'state' was, resulting in lower obesity rates. It was also assumed that the higher the number of fast food centers per state, the higher the caloric intake of the 'state', resulting in higher obesity rates. To check for correlation between fitness and obesity, data was collected on the number of fitness centers in each state. This was achieved simply by doing a search online using Yellow Pages for fitness centers, with the search parameter being one state at a time. This was repeated until data for all 50 states had been collected. This same method of data collection was employed to investigate the other parameter, caloric intake. A search was done for each state on YellowPages.com for fast food restaurants, and the number of returned results was recorded for all 50 states. A sample of this data is shown in Table 1. |
|
Other data utilized for this project was a shapefile consisting of state spatial data. This shapefile was downloaded from the Geospatial Onestop data portal. Population data for the year 2000 was also downloaded from the U.S. Census Bureau website. The data collected on numbers of fast food centers and fitness centers were appended to this table, and the table then joined to the states shapefile within the ArcGIS environment. The main assumption made concerning the data collected on fast food centers and fitness centers was that the number of businesses not registered with YellowPages.com would not significantly alter any of the general trends observed once the map data was symbolized. |
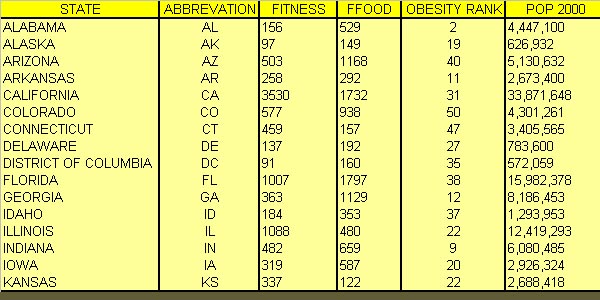 Table 1. |
|
Figure 1. shows the state data for the population normalized by the number of fitness centers and symbolized using the graduated colors scheme within ArcGIS as well as the Natural Breaks method for creating class breaks. Each state is also labeled with its name abbreviation and its national obesity rank, where '1' is the most obese and '50' is the least obese. This normalization gives the number of people that have to 'share' each fitness center. States where these numbers are low therefore have more fitness centers available to more of the population, resulting in a higher fitness level and a lower obesity ranking. Figure 1. generally shows this trend to indeed be the case, as states with lower obesity rankings also have higher numbers of fitness centers available to more of the population. |
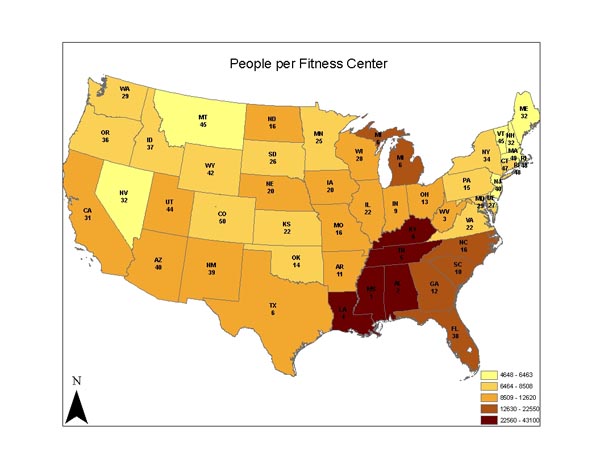 Figure 1. |
Figure 2. shows the state data for the population normalized by the number of fast food centers in each state and symbolized using the graduated colors scheme within ArcGIS. The Natural Breaks method is again used for creating class breaks. This normalization gives the number of people that have to 'share' each fast food center. States where these numbers are low therefore have more fast food centers available to more of the population, resulting in a higher average caloric intake and therefore a higher obesity ranking. Figure 2. does not generally exhibit this trend, as states with a lower obesity rank also seem to have higher numbers of fast food centers available to more of the population. In this instance, it would seem that there are other factors influencing the results that have not been included as variables in this project. |
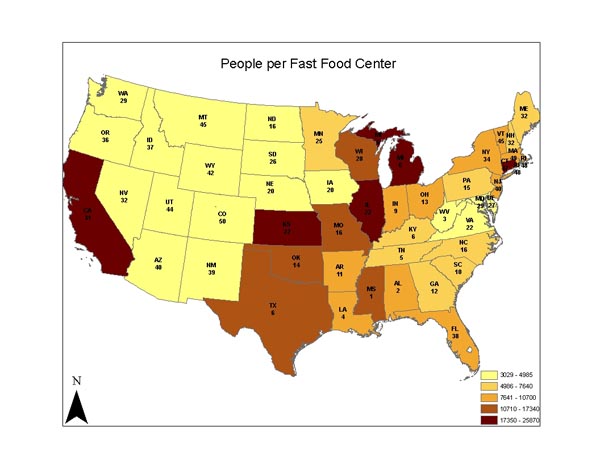 Figure 2. |
 |
Analysis The results of the map symbolization show that there is indeed a trend when it comes to fitness, and a less obvious trend when considering caloric intake, in terms of their effect on obesity rates. The general trend shown in Figure 1. is that more physical activity results in less obesity. This is true for most states, although some states do not quite follow this trend. For instance, Florida has a low national obesity rank of 38, but also has a high number of people sharing fitness centers within the state. This would suggest that Florida should have a higher obesity ranking than it does. Figure 2. shows almost the opposite of what was expected, as there is also a trend when considering the effect of caloric intake on obesity which seems to show that higher caloric intake reduces rates of obesity. As can be seen from the map, in states where the number of people sharing fast food centers is higher, meaning that there are less fast food centers for the population to share, the national obesity rank is higher. The opposite of this should be true. Again a few states stand out. The map show that Texas and Michigan have a very high number of people sharing fast food centers and should therefore have a much low obesity rank. However, this is not the case. It is apparent from the first map above that the biggest problem with obesity is indeed in the south, and includes Mississippi, Alabama, Louisiana, Tennessee and Kentucky. A larger scale investigation was done using the fitness factor within these high risk states. |
Investigating these states further by isolating them and then using the Natural Breaks method of classification within ArcGIS, resulted in Figure 3. This map makes it clear that Mississippi, when considering fitness, deserves its high rank on the obesity scale, as it clearly has a significantly larger amount of people sharing fitness centers than the other four states. No significant pattern emerged when considering these five states and the number of people sharing fast food centers. |
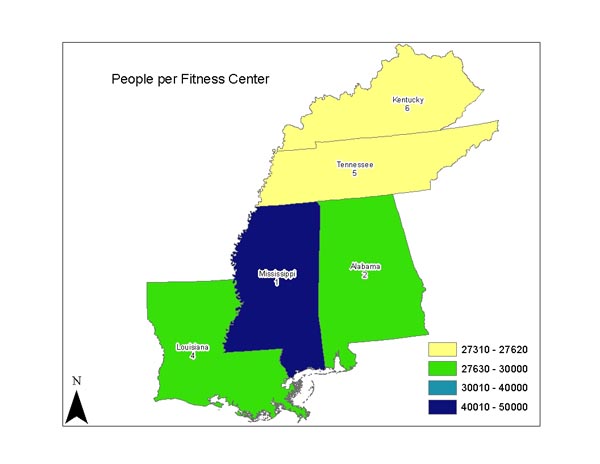 Figure 3. |
|
Conclusions The two factors affecting obesity in this project, amount of physical activity and caloric intake, were considered in isolation. So although the results show trends that seem to corroborate the idea that physical exercise and caloric intake are indeed instrumental in determining the rates of obesity in the United States, the trend involving caloric intake was not conclusive. A number of other factors in any number of combinations could have affected these results, and would need to also be considered. Such factors could include genetic heritage, fruit and vegetable intake specifically, climate, geographic location/ make-up, commute time and even plastic surgery. The incorporation of these factors and interpretation of results when considering them is subjective and difficult to quantify. Their continued analysis in conjunction with the effects that they have on obesity will, however, help in the fight against obesity, enabling authorities to know more about what causes it and how to prevent it. | |
|
References
| |