| Title Reducing Response Times in American Canyon | |
|
Author James Bryant American River College, Geography 350: Data Acquisition in GIS; Spring 2007 | |
|
Abstract The purpose of this paper was to examine the reason that some of the incident response times in The American Canyon Fire District are over five minutes and to offer possible solutions for reducing those response times. | |
|
Introduction I work for the American Canyon Fire Department in Napa County. I have been studying GIS for a little over a year and until this point I have been unable to apply what I have learned in a meaningful way to my job. One of our goals at the Fire Department is to meet the National Fire Protection Associations’ standard of keeping emergency response times at five minutes or less on 90 percent of the responses. With that goal in mind I decided to use GIS to try and analyze which emergency responses were over five minutes and then determine why those responses were longer than other responses. I will accomplish this research by first gathering data from the incident reporting system we use to store all our incident reports. This will include the location of the call, the date and time the call was dispatched, the response time for the call, the type of call, and which unit responded to the call. Once I have compiled the data I will then use Microsoft Excel to convert the data to dbase format. Next I will import the data into ArcView and use it to analyze the responses. My final goal will be to use the results from the analysis to find methods for improving emergency response times in American Canyon. | |
|
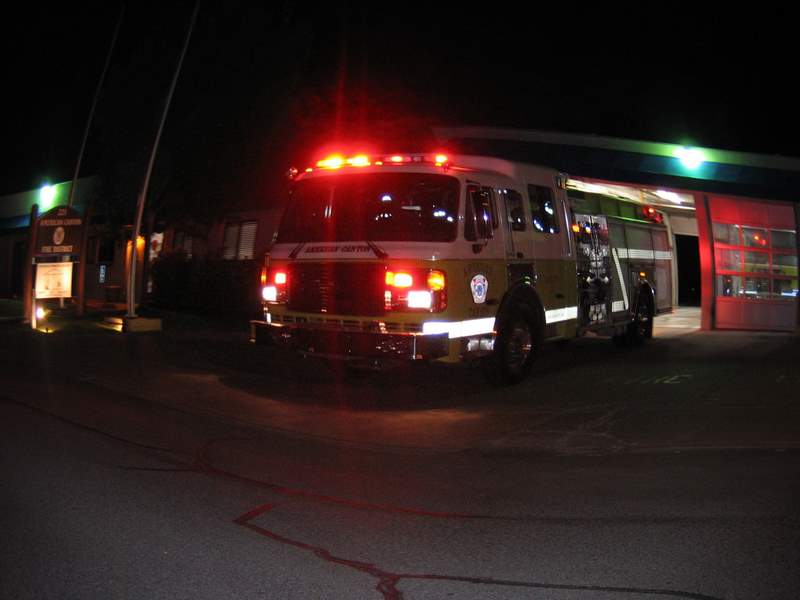
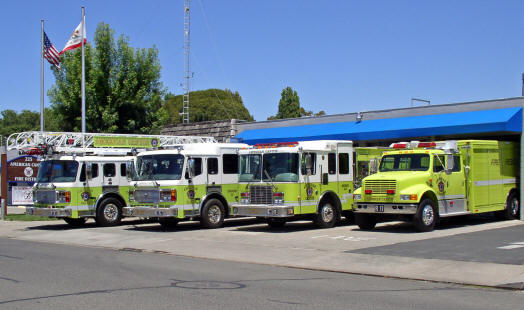
Background The American Canyon Fire Department was created in 1957 and is located at the south end of Napa County. From 1957 to 1993 growth in the Fire District was slow due to Napa County growth restrictions. In 1993 the City of American Canyon was voted into existence, and change began to occur. Since the formation of the City of American Canyon the residential, industrial, and commercial occupancies have doubled. For the Fire District this has caused an increase of emergency calls from approximately 850 calls a year to over 1200 calls per year. Although staffing also increased from 13 line personnel to 17, the District is still only able to provide one fully staffed Engine Company all the time. With population and building growth showing no signs of slowing down in the future planning has to be done to insure that the citizens of American Canyon maintained the high level of fire protection in the future as they have had in the past. It is obvious that at some point staffing will need to be increased so that two fully staffed engine companies will be available to respond to multiple emergency calls. To determine at what point the second engine company will be required the District will examine how well it is able to meet national fire protection standards for urban areas. One of the most critical standards is that of maintaining response times below five minutes. | |
|
|
|
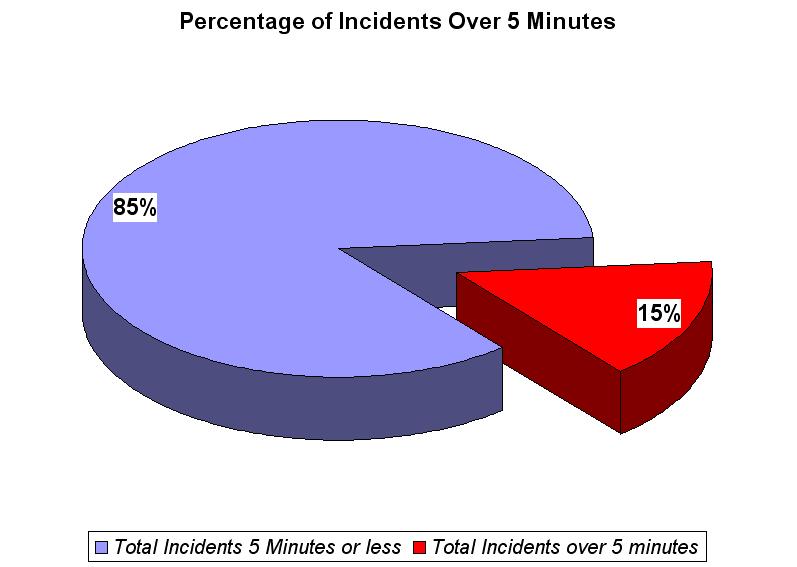
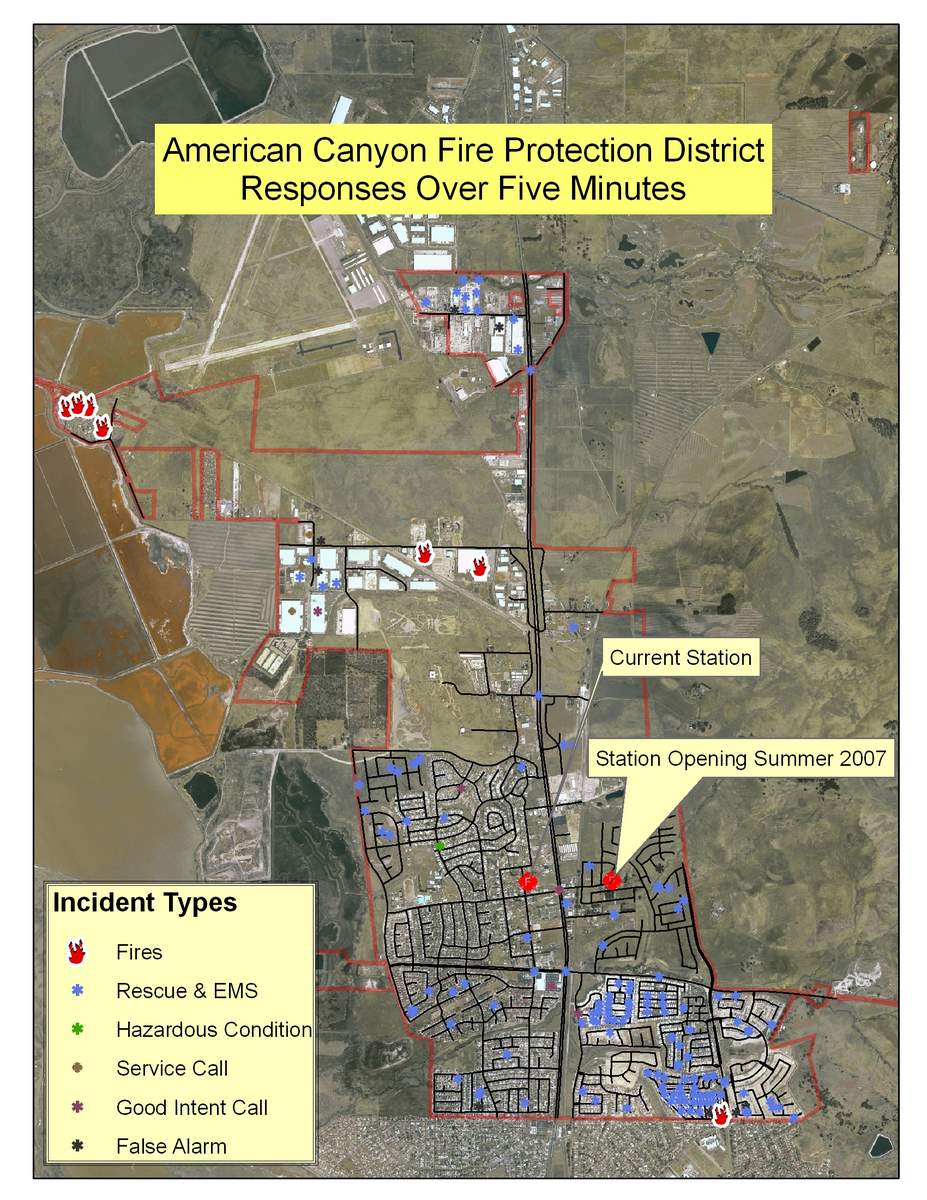
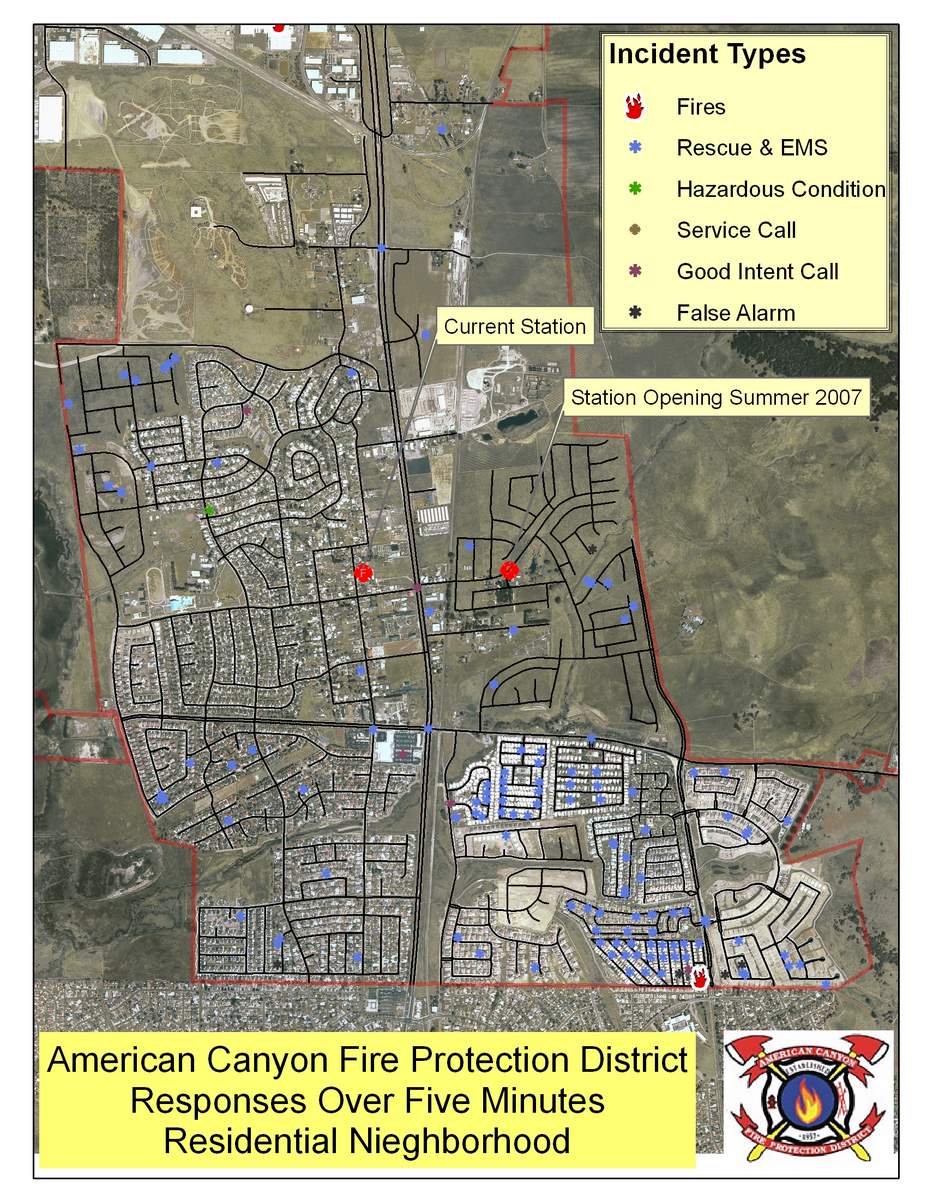
Methods My first step was to extract the data for emergency calls from April 1, 2006 to March 31, 2007 from the incident management system 4D. This is a data management system used by the District to record incidents for the past five years. There were two issues I encountered with what I thought should have been a simple exercise. 1. The 4D data management system was created on a Macintosh system and converted to Windows. This meant that exporting data was not as simple as going to the File menu and clicking on export. When this was attempted I ended up with a text file was not recognized by any Windows based program. You may be asking yourself “Why didn’t I just call technical support for 4D?” 2. The Fire District discontinued the technical support for 4D because it was too expensive and they were planning on replacing it in the near future with a new system. To overcome these issues I used the same method I used when playing video games. I would try every conceivable solution until I became convinced it was impossible to get the data out of the system in a usable format, and I would give up. A week or two later I would go back and try again with the belief that there must be a way I just have not found it yet. After several months I finally discovered that if I went to the File menu and selected Destination and then selected Disk File I could then generate a report that could be saved as a comma delimited text file. Now it was just the simple matter of loading the text file into Excel, converting it to a dbase file, geocoding it in ArcView, and finally analyzing the data. Importing the data into Excel was easily done, but once I looked at the data in a spreadsheet I became aware of another problem. In order to geocode an address in ArcView it would have to be in the format of: Street Number_Street Name_Street Type. The problem was that even though 4D had separate fields for Street Number, Name, and Type the data was not always entered correctly. For instance addresses on American Canyon Road were entered over 25 different ways due to space numbers from mobile home parks being added to the street name, or abbreviations used such as AmCan Rd. This was corrected by using the auto filter in Excel to group the similar entries and then use Find and Replace to correct them. Once I had completed correcting the known errors in the data in Excel I saved the spreadsheet as a dbase file and loaded it into ArcView so that I could geocode it. For a reference layer I used an address point shape file I had downloaded from the Napa County GIS website. These posed two problems because some of the addresses in Napa County’s shape file were incomplete or inaccurate, and over 200 of the incidents were not at specific addresses. For example a vehicle accident might be near or at an intersection. Of the 1246 incidents only 80 % of them matched the address shape file. This problem was corrected after geocoding by creating a separate shape point file and creating new points with the incident number as the primary key. The location of each point was determined by using a hand written log book, the actual written report, or searching the data base for the incident and retrieving more data. Finally when the new shape file was complete it was joined to the existing shape file, and the fields were copied in the attribute table using the calculate values tool. Then the old unmatched records were deleted, and the join was removed. The result was a shape file that had a specific point for every incident the Fire District responded to between April 1, 2006 and March 31, 2007. The next step was to identify which calls incidents had response times longer than five minutes and then determine why they were over five minutes. I first eliminated all the incidents that occurred outside of our District boundary. This reduced the number of incidents down to 1098. I then selected only the incidents that had a response time over five minutes. This reduced the number of incidents down to 215, or 19% of the total incidents within the Fire District. The next step was to determine how many of the 215 incidents were legitimate emergency responses. Not every incident that we are dispatched to and are required to create a report on is code three responses. For instance, if some one just needed help getting up because they had fallen but sustained no injury, we would respond code 2 with no lights or sirens. When it was decided that we needed a record of all our responses that were greater than five minutes, and that data may not be retrievable from the 4D data management system I created a new data base. The new data base was initiated on April 1, 2006, and was titled Run Reports. The data for Run Reports was gathered by another firefighter from written reports that are filled out for each incident. The Run Reports data base tracked pertinent information for the incident including the reason for the delay and additional comments. At this point I should have been able to link the table from Run Reports to the information loaded in ArcView and I would know why any incident with a response time over five minutes occurred. Unfortunately the Run Reports data base only had 184 records, and the table created in ArcView had 215 records. To complicate things even more when I joined the two tables together in ArcView the resulting table only had 175 records. Also compounding the problem was the fact that the reason given for the delay in the Run Reports data base was often “unknown” or “other” with no explanation. The first step in resolving these problems was to compare the original Run Report data with the newly created table of 175 records. I determined that nine records had response times of five minutes or less, and deleted these records. I then created an Excel spreadsheet with the 175 records from the new table and the 40 records from the ArcView table that were never entered in the Run Reports data base. What resulted was a spreadsheet with a total of 215 records of incidents that had a response time of over five minutes and were within the Fire District. Using this spreadsheet I was able to determine which incidents were legitimate emergency calls and which were not. I did this in two ways. First I removed any incident that gave a reason for a code 2 response or delay, such as a response to a law enforcement incident where we were directed to stage away from the scene until the police determined it was safe. The second method was by making assumptions for the delay based on data in the incident report. Theses assumptions were as follows: • Any incident located on the east side of Highway 29or north of Napa Junction Road that occurred between 0700 and 1000, or between 1500 and 1800 would be delayed due to traffic. • There are three addresses in American Canyon with known abusers of the 911 system. It would not be prudent for an engine company to risk lives of other people by responding to these locations with excessive speed. • Any incident dispatched between 2200 and 0700 was determined a night call. By making these assumptions and removing known code 2 responses I had reduced the list of delayed responses of actual emergency incidents down to 167. This equates to 15% of the total incidents. At this point I knew how many and what percentage of incidents had delayed responses and why they were delayed. The Fire District will be replacing its current fire house at 225 James Road with a new fire station at 911 East Donaldson Way in the summer of 2007. At the same time East Donaldson Way will be opened up as a new route for crossing Highway 29 and the railroad tracks that run parallel to it. The final step in the analysis of the data was to determine what affect these changes would have on response times. I first determined that the two geographical areas that would be affected would be the residential areas on the east and west sides of the Highway. Given the close proximity of the fire stations I believe that any response time to the west side of Highway 29 would increase no more than one minute. Conversely the new stations location allows the ability to avoid the Highway and major intersections and would reduce response times to the west side by at least two minutes probably closer to three minutes. With these two assumptions in mind I determined that the delayed incidents would increase on the west side by 54, and would be reduced on the east side by 75. The affect of the new station and travel route would be a reduction from 167 incidents to 146. This would equate to a 13% reduction in delayed incidents equal to 2% of total incidents. | |

|
|
|
Results • 50 Night calls.
• 45 Due to distance.
• 22 Due to traffic or road construction.
• 16 Unknown reasons.
• 15 Due to error in dispatch.
• 11 Due to back to back calls, unavailable units to respond, or inadequate staffing.
• 4 Initially unable to locate the incident
• 3 Radio problems
• 1 Weather
The opening of a new fire station at 911 East Donaldson Way along with access across Highway 29 and the railroad tracks that run parallel to it will reduce delayed incident response times by 13%.
The sources for this data were the 4D Data Management System, Run Reports Database created on Microsoft Access 2003, written incident response sheets, and the American Canyon Fire Department station log book. These sources were utilized because they were the only resources available with pertinent data. Also used to analyze and determine conclusions of data were ArcView 9.1 and Microsoft Excel. ArcView 9.1 was used so that the data could be geographically analyzed. Microsoft Excel was used because it provided the most efficient way to compare and edit the data. Both ArcView 9.1 and Microsoft Excel provided the best result for visual illustration of the analysis.
. | |
 |
|
|
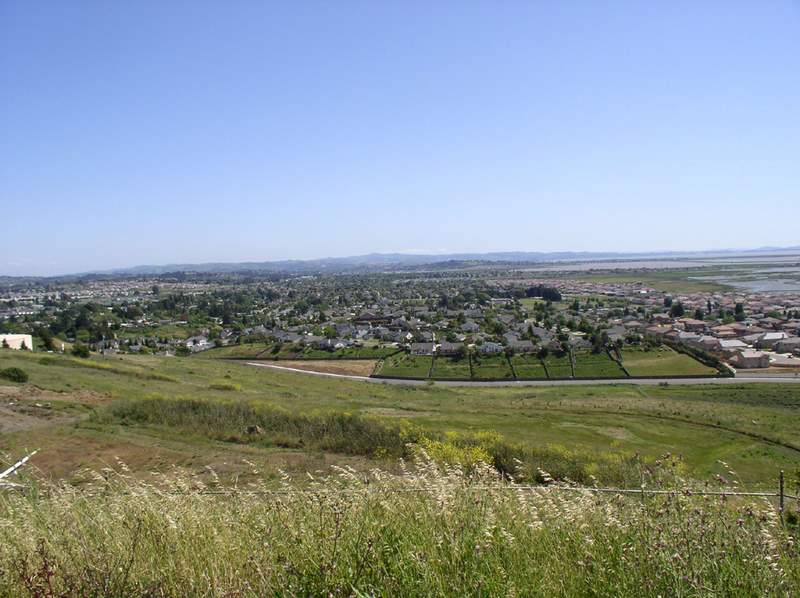
Maps of Study Area | |
  |
|
|
Analysis Although each of the 167 incidents were given one reason for the delay it is obvious that a single delayed response may be caused by multiple reasons. For instance an incident delayed due to distance may have also encountered traffic problems. It should also be realized that the person recording the reason for the delay may have put the first selection that they found to exist as the only reason. An example would be the night calls where all the reports were done either in the middle of the night or the following day when the recording person had little or no sleep. For many of the incidents there was not a recorded reason, so a reason was given at a later date by a person who did not respond to the incident. In these instances the reason was based on assumptions explained earlier in the method section. It may also be assumed that of the 16 incidents with unknown reasons for delay probably fell into one of the other categories or had some unique reason for their delay, but the reason was omitted from the report due to human error. It should be understood that a certain unknown degree of error is inevitable when assumptions are used in place of facts. Keeping all this in mind I feel that the research done was reasonably accurate and effective for its purpose of determining why responses were delayed. | |
|
Conclusions By far the greatest difficulty in this research was obtaining valid data regarding the location of the incident and the cause for the delayed response. To eliminate these problems there needs to be three changes. The first is that I will gather the information on a monthly basis thereby using a smaller more recent set of data and allowing for a more accurate result. The second change would be to replace our current 4D data management system with one that allows for additional data such as reason for delays to be easily entered into the system. This new system should also be capable of adding pick list for common street names and auto complete tools to allow for greater accuracy in data entry. The final change should be a training session for people completing reports to illustrate the correct method of entering data as well as instilling an understanding of the importance of proper data entry.The final goal of this research was to use the results from the analysis to find methods for improving emergency response times in American Canyon. It has already been demonstrated that the addition of a new fire station and travel route will reduce the number of delayed responses down to 13% of total incidents. It is also apparent that any time a response includes travel on Highway 29 during commute times the response times are higher. Therefore I believe this research illustrates that the best solution to reducing response times would be establishing two engine companies stationed on opposite sides of Highway 29. To confirm this belief more research should be completed with up to date data that accounts for the increase in population and traffic in American Canyon. Also to increase accuracy of the analysis ArcGIS Network Analyst should be used to help determine response routes and future fire station locations. | |
|
References
References indicated in text. | |