| Title Trail Mapping with GPS and ArcScene | |
|
Author Matthew T. Eister American River College, Geography 350: Data Acquisition in GIS; Spring 2007 Contact Information: mattheweister@fs.fed.us | |
|
Abstract This project created a 3D model of a portion of the Pacific Crest Trail near Donner Summit. The idea was sculpted after a Mt. Whitney 3D model that is displayed on the Inyo National Forest web site. Data was collected and interfaced with ArcMap and ArcScene to create a finished product. Below are the steps to manipulate the data into more a useable map. | |
|
Introduction This is a data acquisition project for the purpose of collecting data to produce a 3 dimensional map of a favorite section of the Pacific Crest Trail near Donner Summit. Small detailed trail maps are often unavailable or unobtainable; therefore one must create their own maps with today’s technology and tools. An example of what I am trying to recreate can be see on the Inyo National Forest web site depicting Mt. Whitney in a 3D model. | |
|
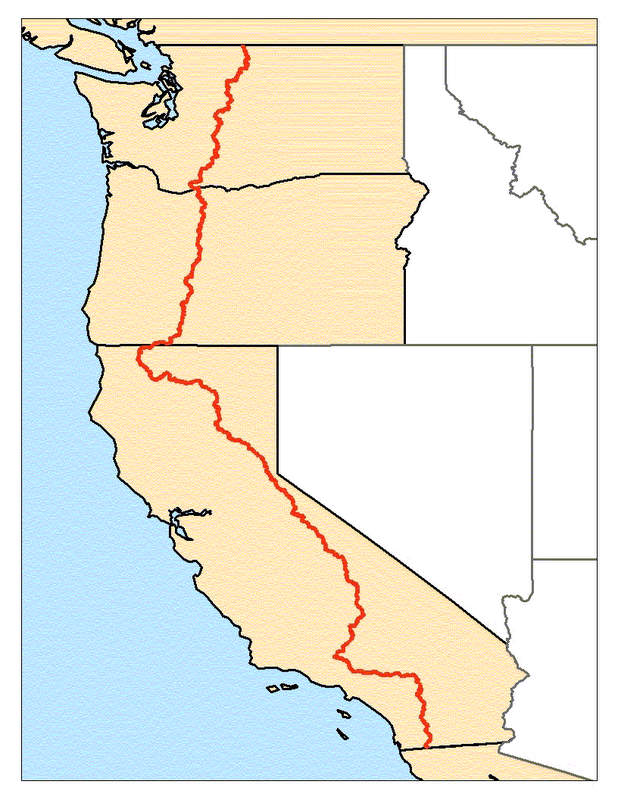
Background The Pacific Crest Trail extends from Mexico to Canada and is bisected my major highways and roads. It's at these intersections where the average backpacker or hiker enjoys this epic trail. The trail is usually hiked in sections or short day trips, however there are a few crazy individuals that hike the entire length of the trail. The Castle Peak section of the trail is a short hike beginning at Donner Summit (Boreal Ski Area) and heading due north. Within two miles form the trail head you will reach a fork in the trail. Left takes you to the Peter Grubb Hut and right continues up the ridge along the PCT from which one can summit Castle Peak. The trail is very popular year round. I have hiked to the peak in the summer months and have also backcountry skied to the Peak and the Peter Grubb Hut in blizzards. | |
| Here is a map of the PCT in its entirety: The Pacific Crest Trail Association has a wealth of information pertaining to the trail and conditions. Pacific Crest Trail Association . |
|
|
Methods There were three steps to this project: data acquisition, data processing, and analysis/diplay. | |
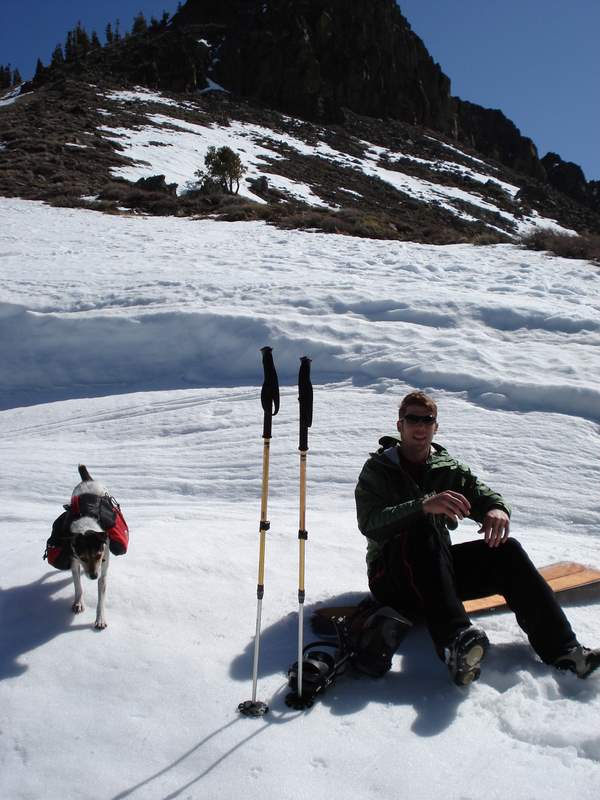
| Data acquisition was performed using a Garmin GPS 76S. GPS points were taken at a equal distance intervals set at 50ft. Skis and a Slitboard(hybrid snowboard-touring skies) were the mode of transportation. Gear was hauled via a custom snow sled and overnight accommodations were hand dug into the snow bank. Pictures were taken with a Sony Cyber-shot 6.0 mega pixel digital camera. Data processing was a bit trickier. I started with uploading the gps points into ArcMap and collecting data from the Tahoe National Forest. Since I work for the Eldorado National Forest, data was very easy to obtain. Layers included highways, contours, Pacific Crest Trail and 1 meter color imagery from our in-house server. Originally I intended to use 10 meter DEM quads but had difficult time getting the quads to mosaic or merge together. There were huge gaps between the quads, and when setting the base heights to z values, which created nulls or no data values for the gaps. The next step was to generate the contours to 3D. This process was performed by using the 3D analysis dropdown menu. A TIN was then created from the 3D contours. This gives a very rastorized display but is easier to interpret than the contour lines. After all the data was manipulated in ArcMap, which included clipping the highways and PCT to a specified extent, all data was opened in an ArcScene document. This is where the magic happens! The base heights for the trail and highway layers are set or obtained from the TIN. At this point you can change the vertical exaggeration which stretches the z value. The last data to be implimentated was the 1 meter imagery which is draped over the TIN. The final portion of this project was to create a display image that depicted the gps trail. |
|
|
Results The following section contains the
presentation of actual data, 3D maps and displays for the final product. The first map is the final product
of the project. One can clearly see the winter gps trail (Yellow) and the summer PCT routes (purple). Elevation
gain and loss can also be determined. The following maps are self explanatory and depict the steps taken to create
this 3D model. 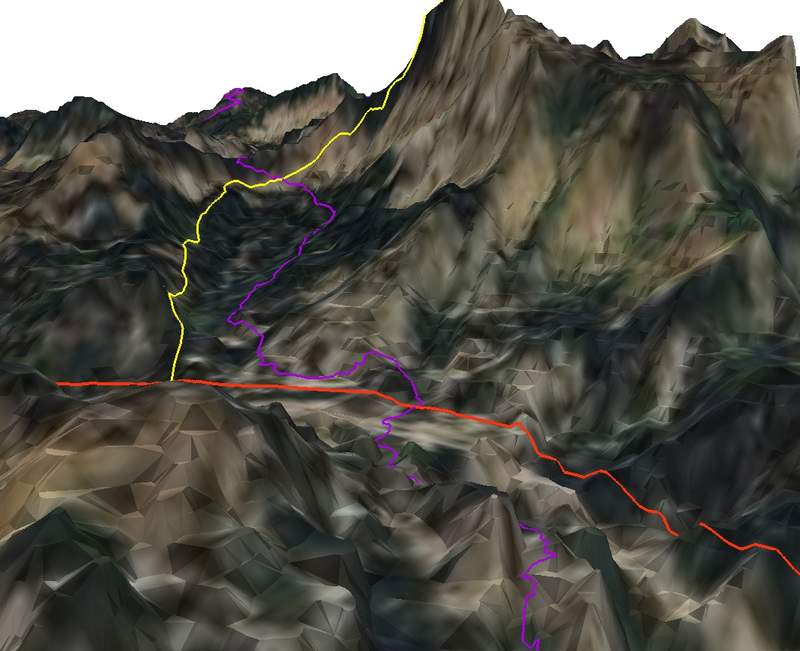
| |
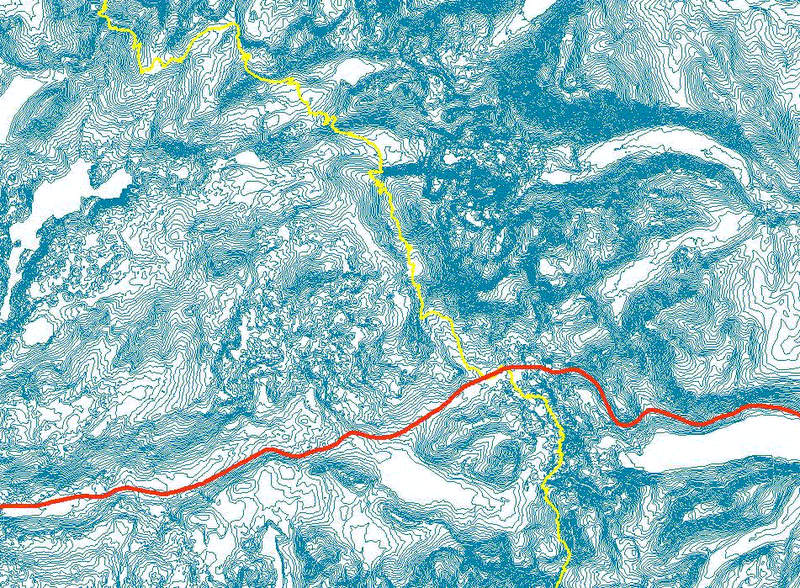 | Add the data for Highways, Pacific Crest Trail and the contours. |
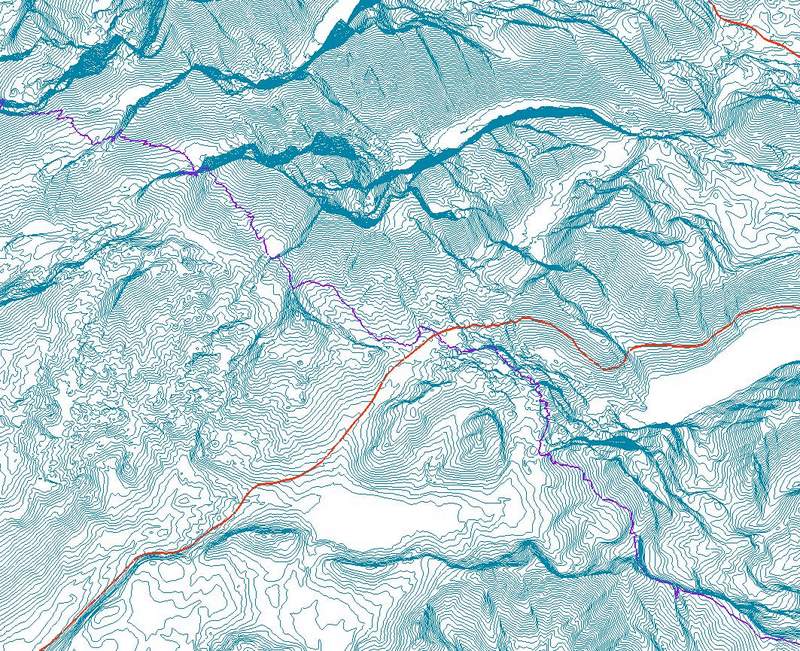 | In 3D Analyst, convert the contour features to 3D. |
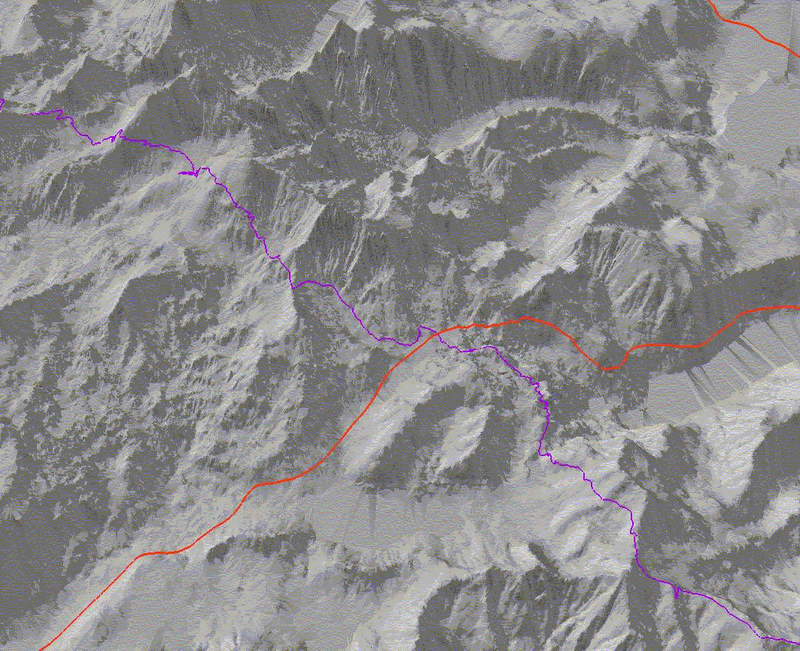 | Create TIN from contour features. |
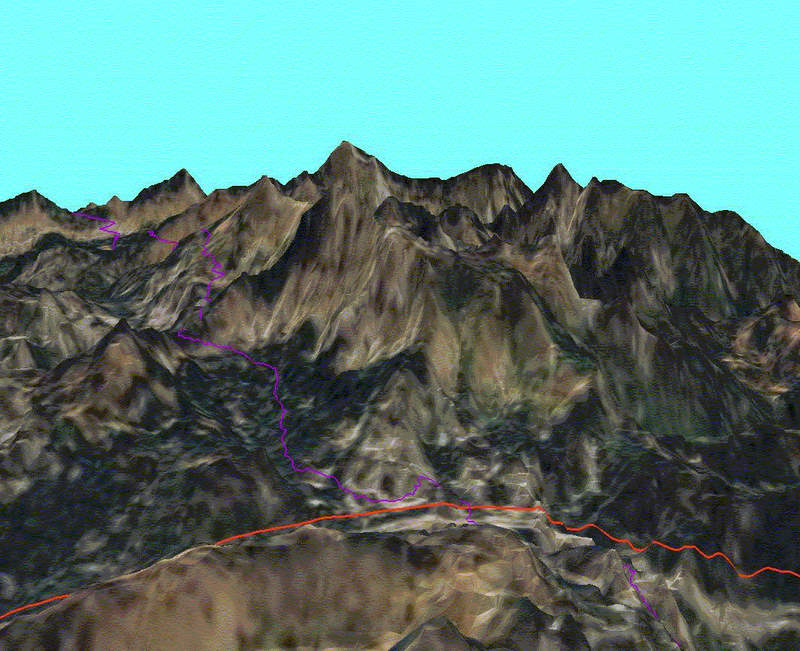 | Drape Imagery over TIN. |
|
Analysis Overall I am quite pleased with the results from this project. The
best part was being outside and exploring one of my favorite trails. The gps data was easy to merge within the
ArcMap/ArcScene environments. The most difficult part was manipulating the contour data and displaying a 3D model.
I had originally downloaded several DEM quads that the imagery was going to drape over, however I could not get
the 4 DEM's to mosaic or merge together smoothly. There were gaps between the quads and simply did not work for
the project. With the exception of the gaps, they would have produced a cleaner more detailed model than that of
the TIN. | |
|
Conclusions The original problem of not having detailed maps of specific areas
was solved in this project. The section of trail I chose was small and the reason for keeping the project size
manageable. 3D trail maps in the future will likely be much longer and need to be in separate sub-projects
sections. They will especially be helpful in less than ideal conditions such as during a snow storm. | |
|
References Booth, Bob 2000. Using ArcGIS 3D Analyst. GIS by ESRI. Inyo National Forest web site, 2007 MT. Whitney Trail Inyo National Forest Pacific Crest Trail web site, 2007 Pacific Crest Trail Association | |