![]()
![]() GIS
and Forestry
GIS
and Forestry![]()
![]()
![]()
Contents
![]()

This papers is intended to show the GIS methods used in data collection and analysis for an understory thining project on the Eldorado National Forest. ![]()
The U.S. Forest Service is responsible for the management of forest harvesting, grazing leases, recreational areas, wildlife habitat, mining activities as well as protecting endangered species. This paper will be focusing on the use of GIS in understory thining projects on the Eldorado National Forest. Throughout the Forest Service, as well as state and private forestry, GIS is a crucial tool for inventory, analysis, planning and implementation of timber management. From its conception begining GIS was developed to manage and inventory natural resources. (DeMers) With the development of handheld GPS units and user friendly software, GIS is going to the field.
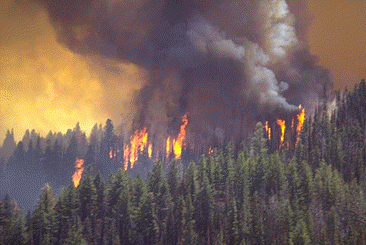
Historicaly the timber stands of the Eldorado sustained fires on a fire regime of low intensity, high frequency approxiemtly every 5 to 25 years. (Keeley and Stephenson)(McKelevey) Fire Suppresion efforts throughout the years have prevented these natural fires from occuring. Understory fuels, such as small trees and brush, have grown to become a large source of fuel. This overloading of understory vegetation fuels the stand replacing fires we have today. By Removing these fuels we can prevent catastrophic fires and provide a timber product to the public.
Before Treatment


After Treatment


 OR
OR
![]()
![]()
![]()
![]()
![]()
![]()
Delineating Treatment Areas
The initial step in determining where a thinning is to occur is to first evaluate areas of need. Wildland Urban Interface areas, known as WUI’s, are number one priority for under-story thinning in order to protect our communities. The next priority goes to areas that lie outside of the WUI. Strategically Placed Land Area Treatment (SPLATs) use computer fuel and fire modeling to determine areas that can be treated in order to protect additional resources, both natural and human, as well as to provide addition buffer to the WUIs. Prescriptions of treatment are derived from stand data to determine the best method for removing fuel to generate desired results, while working under the guidance of the Sierra Nevada Framework.
Modeling such as the BEHAVE program works in a non-spatially software environment to predict fire behavior. Utilizing inputs of fire fuel type, topography data, weather data, and initial fuel moisture data, BEHAVE calculates fire behavior and fire characteristics for a given area. Linked with the software program FIRE! predictions gain a spatial attribute in GIS (Weinstein et all). Click here to view FIRE! Simualtion Growth Diagram
Prescription Modeling
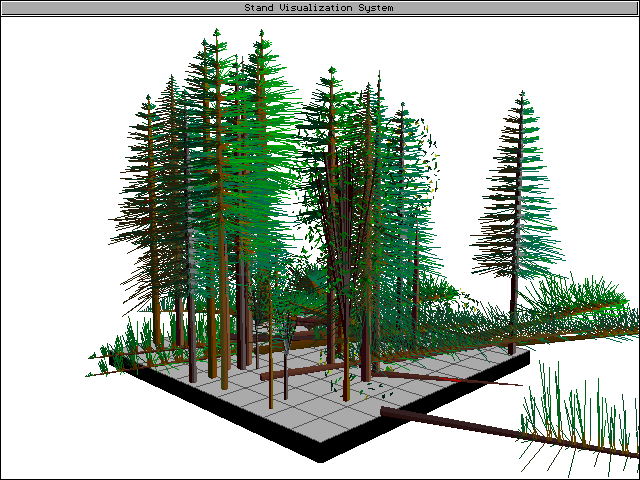
 Fuel modeling relies on information measured into the field being inputted into the Stand Visualization System (SVS) and when combined with Forest Vegetation Simulator (FVS) prescriptions can be visualized from initial stand quality, to marking, harvesting/mastication, and finaly with a control burn. Mortality rates can also be calculated, inputted, as well as the condition of the stand viewed 10, 20, 100 years or more out to the future. SVS and FVS have been found to be both effective in their predictions as well as in presenting forest management approaches, concepts, and prescriptions to the public (Roth and Finley). According to Skip Campbell, Spatial Solutions Consultant for CH2M Hill, private companyies are now interfacing this type of viewer into Google Earth viewers. Click FVS logo to link to Forest Service webpage where you download both FVS and SVS shareware programs.
![]()

![]()

![]()
![]()
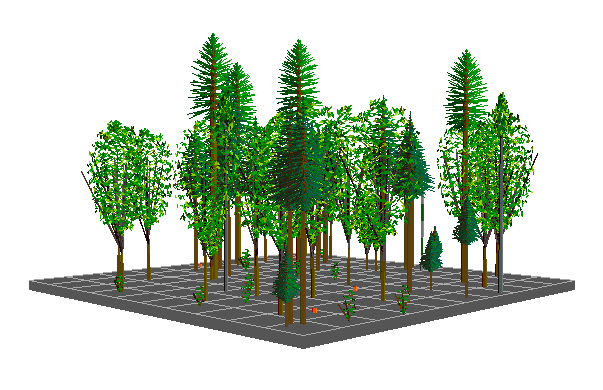
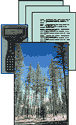
Data is first gathered in the field with a Field Data Recorder (FDR). These are often "ruggedized" Personal Data Recorders of various makes and models(first image). The data is then transferred over into the SVS system to calculated stand dynamics and tree graphics(2nd image). A prescription is applied and a marking (cut trees) can be visualized (3rd image). This information is opened up in FVS and visualized with tree and stand graphics. Results viewed though the one-acre 3-D viewer(final images).
Sale Area Layout
After determining the general local of the treatment area the specific units are identified. This involves studying of aerial photography, satellite imagery, past data collected, and field data collection. Satellite imagery, especially the 2005 one-meter resolution, has become an invaluable tool. Timber types, previously treated areas, brush fields, and roads can all be distinguished on this new data.
Creating Units
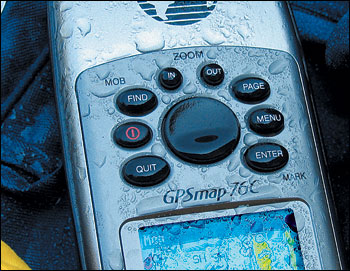
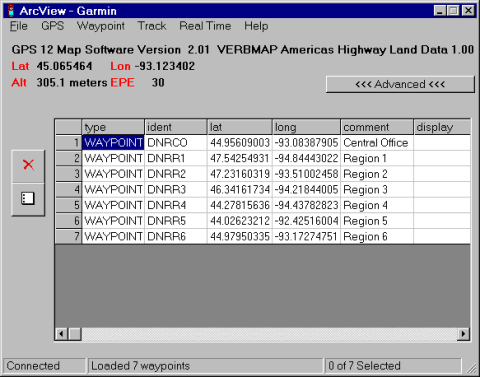
Units are generally individual timber stands within the sale area. The perimeter of the units are delineated by walked out and collecting X, Y points with a GPS. Through trial and error we’ve determined that the consumer grade Garmin GPS provides us reasonable results for the level of accuracy, and precision needed. Additionally the Garmin functions fairly well under dense canopy of wooded areas (Wing and Eklund) and is much more simple and user-friendly then professional grade equipment.
The X, Y points are then referenced and converted into a point shape file using DNRGarmin software from the University of Minnesota.

Data is then imported into ERSI’s ArcMap software. Points are then digitized in editing mode to create a polyline.
![]()
![]()

![]()

![]()

![]()

From this we can calculate area using the XtoolsPro extension for ERSI's ArcMap.
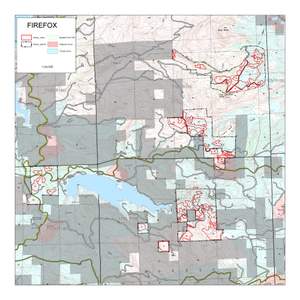
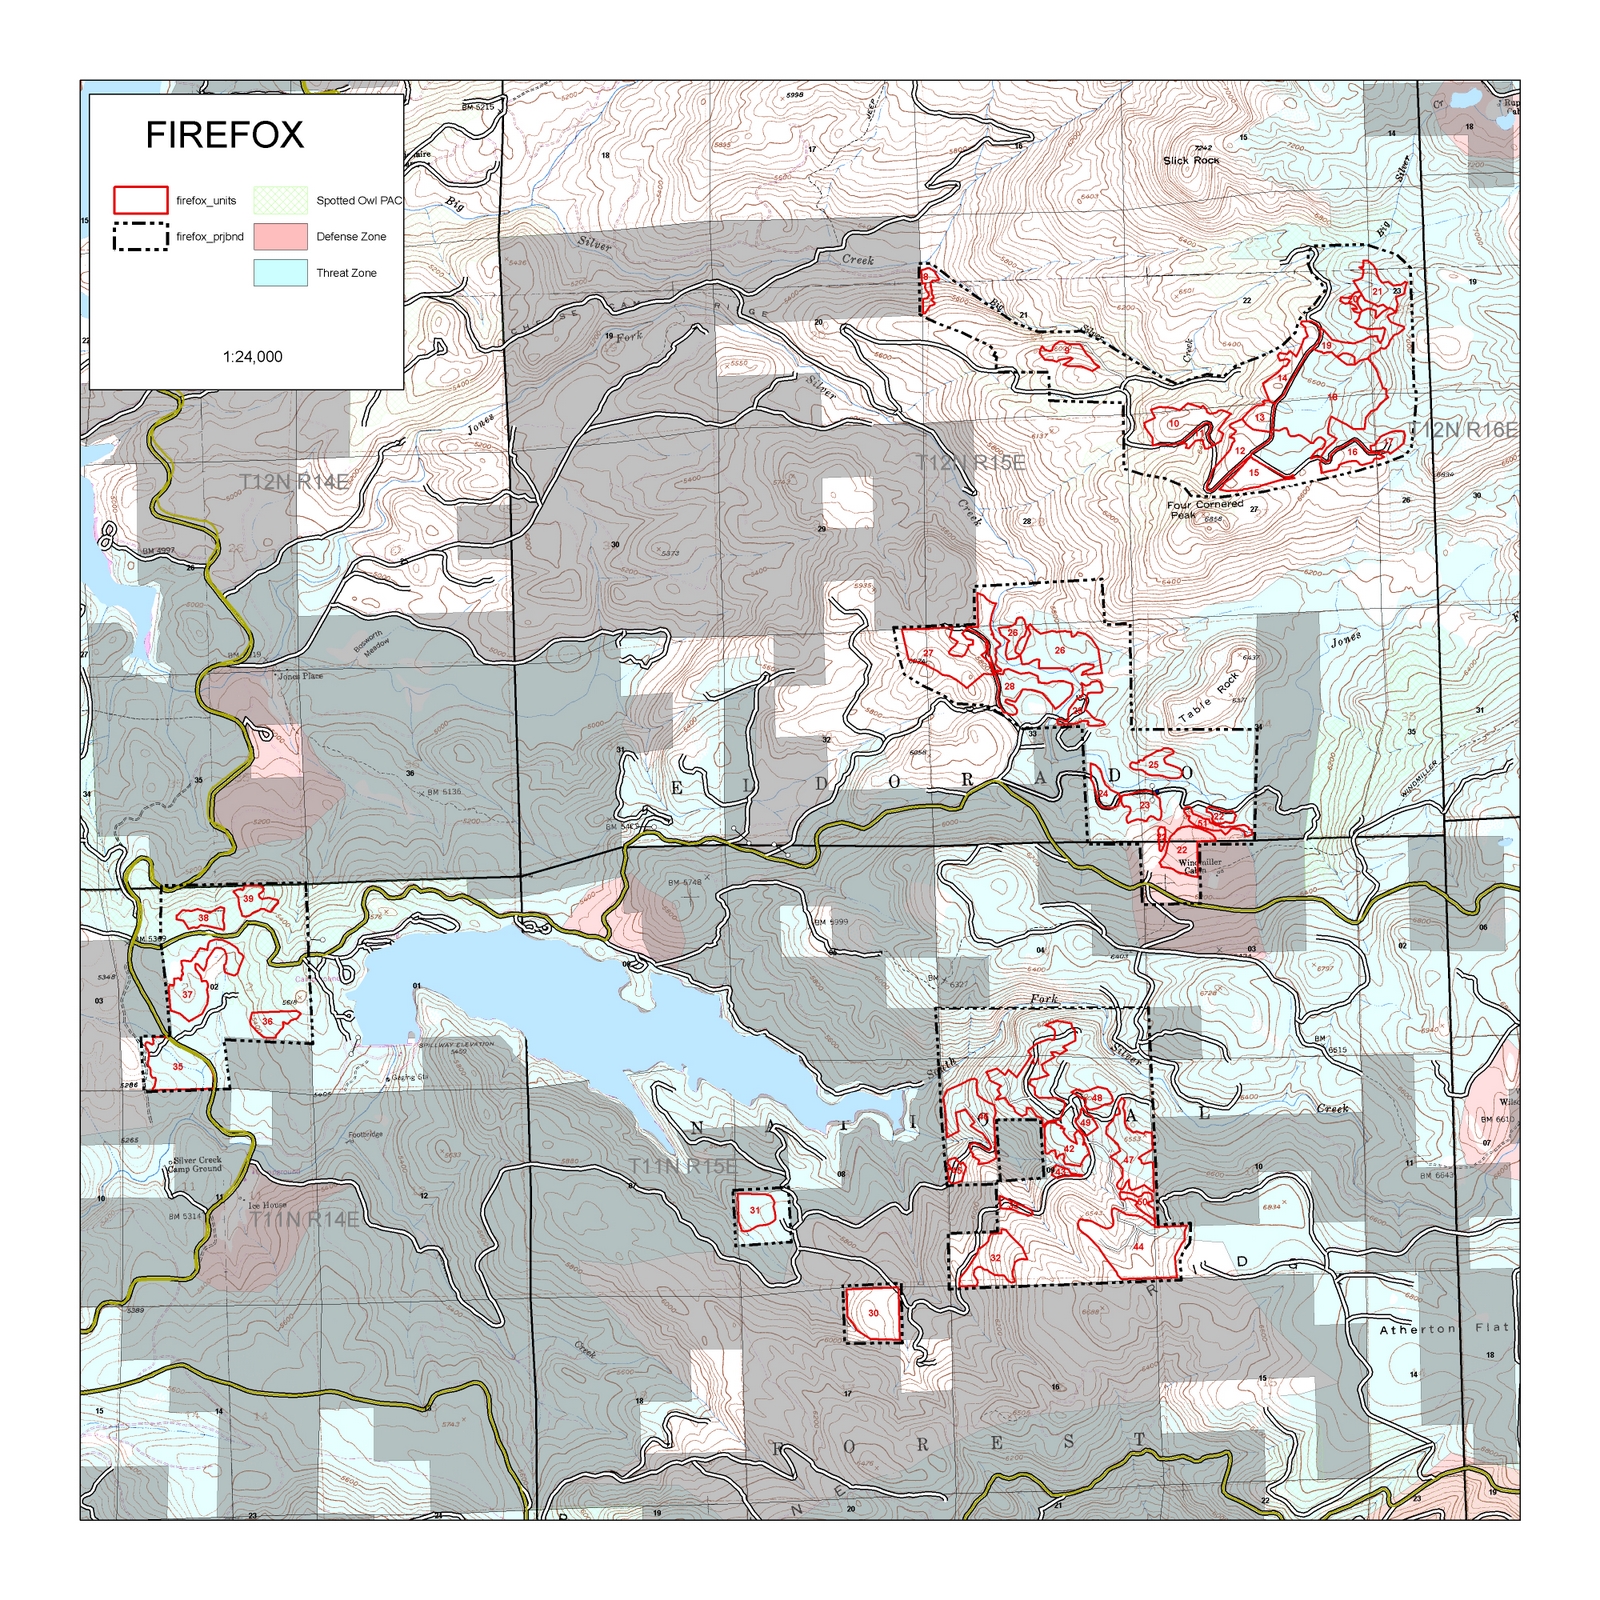
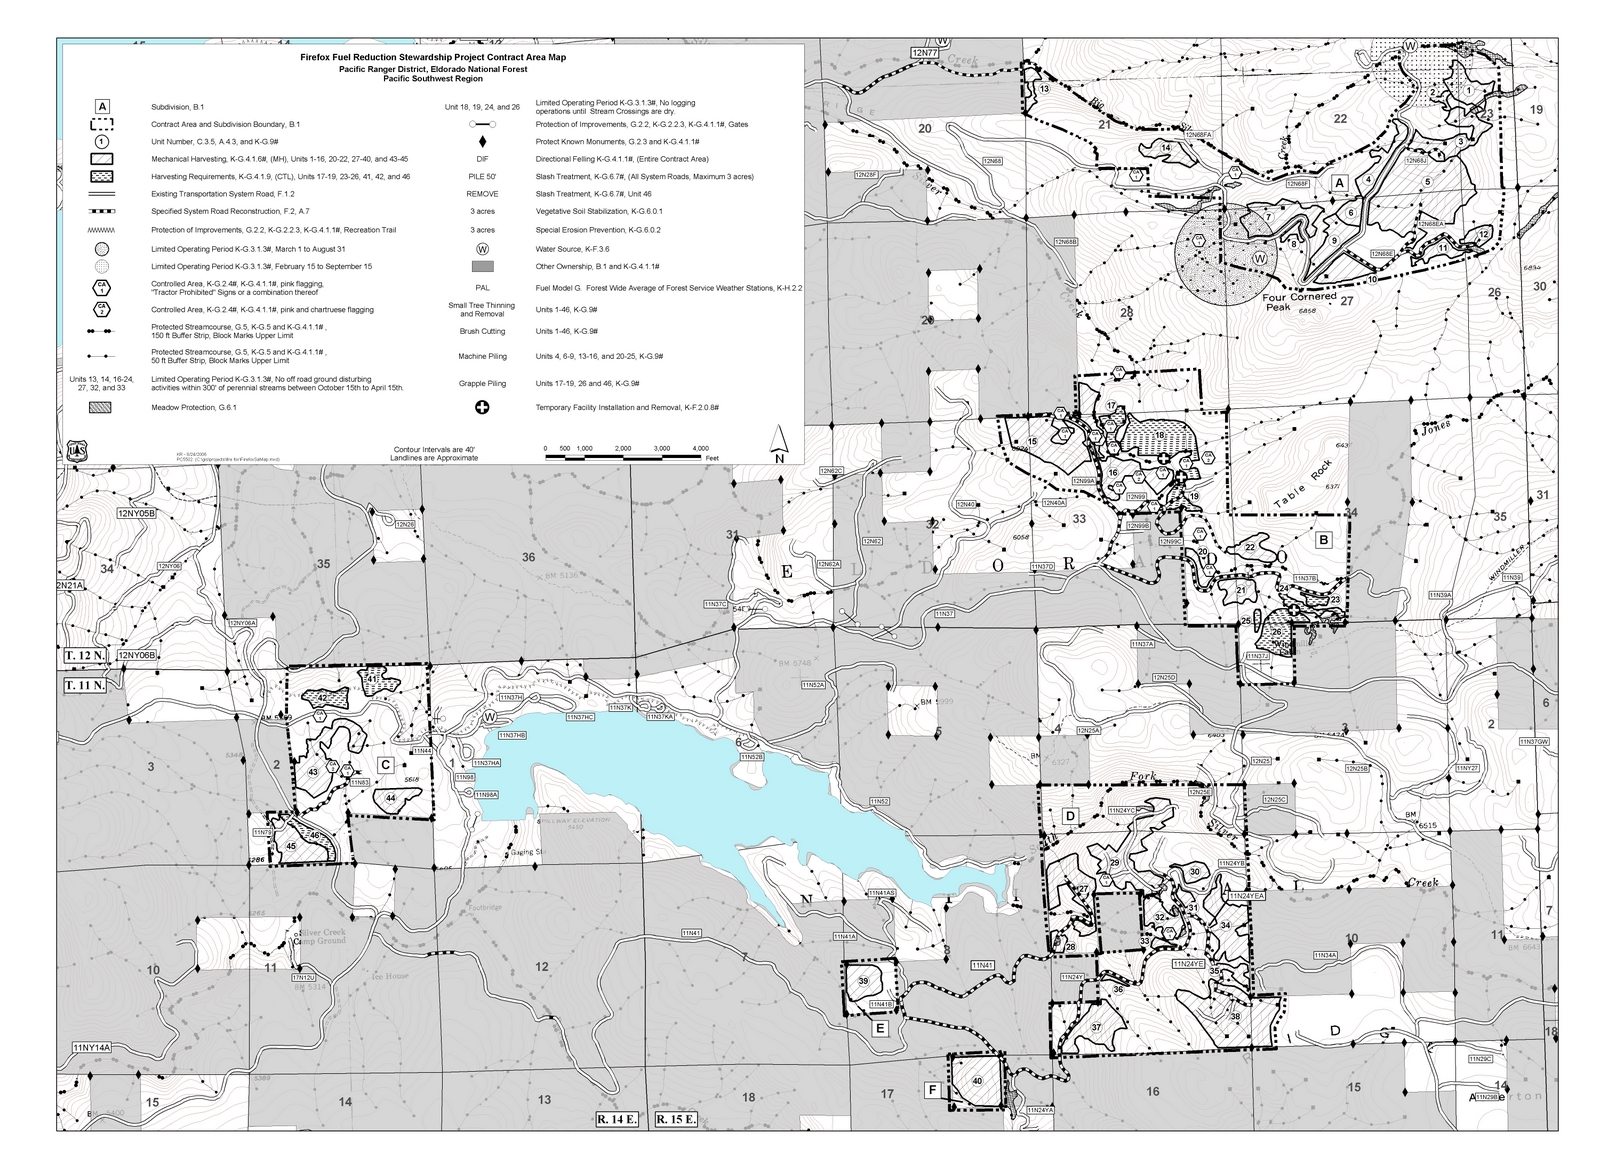
Units are then placed on a map with contours, graphical features, roads, and stand data. These maps are used to guide staff working within those areas. Specialists review the data to make sure there are no negative effects on other resources. Mitigations are adjusted for both on the ground and then corrected in the data sets as necessary.
Trees that are to be cut, by the prescription, are then marked and recorded. A statistical number of trees are measure to calculate volume of merchantable timber that will be cut out of the unit. The project area is put up for bid. The highest bidder purchase the timber based on a set price per ton of material being removed. The sale, being the project area and a collection of units, is then contractual agreed upon. The focal document in that contact is the map created from the sale area units. Here are examples of both a sale planning map and a sale contract map

![]()
The many forms of data being inputted into various Forest Service programs often do cause some confusion due the large amount of raw data and an often missing communication between our field data recorders and the staff inputting, or even designing the programs. I foresee a reduction in the large number of programs used to accomplish the give task of timber management. This alone would simplify the amount of training and expertise required to run any of these programs, as opposed to a half dozen currently existing programs
This project showed the GIS used on a regular basis on the Eldorado National Forest to accomplish timber sales. Understory thinning fuels reduction projects are important to the local community for fire protection and economic support of local jobs. To have the opportunity to provide these benefits and manage a timber stand to better ecological (and historical) condition is ideal. Without GIS this would not be possible.
![]()
 Forestry demands of today can only be met with the technological aid of GIS. The ability to put the ‘where’ on the land in an analytical, calculated method that we can show to the public in a comprehensive manor yet again shows the value of GIS. Protection of our local communities while managing for the natural resources and being able to support a community and industry through timber products are fine lines to walk; but it is the Forest Service’s Mandate.
This example only shows a small slice of these processes and the data that goes into this process. The data sets the Forest Service uses are numerous, bountiful, often confusing, and well very large. I feel this technology enables Forest Service to do a better, more accountable, job for the people we serve and the land we manage. Hopefully the future holds technologies that will enable me to get in the woods more.
![]()
![]() Cram, Douglas S., Baker, Terrell T., and Boren, Jon C. (February 2006) Wildland Fire Effects in Silviculturally Treated vs. Untreated Stands of New Mexico and Arizona, USDA Forest Service Rocky Mountain Research Station.
Cram, Douglas S., Baker, Terrell T., and Boren, Jon C. (February 2006) Wildland Fire Effects in Silviculturally Treated vs. Untreated Stands of New Mexico and Arizona, USDA Forest Service Rocky Mountain Research Station.
![]() DeMers, Michael N. (2005) Fundamentals of Geographic Information Systems, Third Edition, John Wiley & Sons, Inc.
DeMers, Michael N. (2005) Fundamentals of Geographic Information Systems, Third Edition, John Wiley & Sons, Inc.
![]() Keeley, Jon E. and Stephenson, Nathan L. (2000) Restoring Natural Fire Regimes to the Sierra
Nevada in an Era of Global Change USDA Forest Service Proceedings RMRS-P-15-VOL-5, pp.255 - pp.265
Keeley, Jon E. and Stephenson, Nathan L. (2000) Restoring Natural Fire Regimes to the Sierra
Nevada in an Era of Global Change USDA Forest Service Proceedings RMRS-P-15-VOL-5, pp.255 - pp.265
![]() McKelvey, Kevin S.; Skinner, Carl N.; Chang, Chi-ru; Et-man, Don C.; Husari, Susan J.; Parsons, David J.; van Wagtendonk, Jan W.; Weathersoon, C. Philip; (1996) Sierra Nevada Ecosystem Project: Final report to Congress; An Overview of Fire in the Sierra Nevada, Volume II Chp 37 pp.1033 - pp.1040
McKelvey, Kevin S.; Skinner, Carl N.; Chang, Chi-ru; Et-man, Don C.; Husari, Susan J.; Parsons, David J.; van Wagtendonk, Jan W.; Weathersoon, C. Philip; (1996) Sierra Nevada Ecosystem Project: Final report to Congress; An Overview of Fire in the Sierra Nevada, Volume II Chp 37 pp.1033 - pp.1040
![]() Roth, Paul and Finley, J.C.(January/February 2007) Visualize Your Forest- Using Forest Simulation Software to Communicate Forest Management Concepts to Private Forestland Owners, Journal of Forestry, pp.15-19.
Roth, Paul and Finley, J.C.(January/February 2007) Visualize Your Forest- Using Forest Simulation Software to Communicate Forest Management Concepts to Private Forestland Owners, Journal of Forestry, pp.15-19.
![]() Wing, Michael G. and Eklund, Aaron (January/February 2007) Performance Comparison of a Low-Cost Mapping Grade Global Positioning System (GPS) Receiver and Consumer Grade GPS Receiver under Dense Forest Canopy, Journal of Forestry, pp.9-14.
Wing, Michael G. and Eklund, Aaron (January/February 2007) Performance Comparison of a Low-Cost Mapping Grade Global Positioning System (GPS) Receiver and Consumer Grade GPS Receiver under Dense Forest Canopy, Journal of Forestry, pp.9-14.
![]() Weinstein, D., Green, K., Campbell, J., Finney, M., (1997,
May). Fire Growth Modeling in an Integrated GIS
Online: http://gis2.esri.com/library/userconf/proc95/to100/p092.html
Weinstein, D., Green, K., Campbell, J., Finney, M., (1997,
May). Fire Growth Modeling in an Integrated GIS
Online: http://gis2.esri.com/library/userconf/proc95/to100/p092.html
![]()
Created By David Ilse
With alot of copy/paste
May 14, 2007![]()