| Title More Liquor Stores = More Crime? | |
|
Author Chris Pair American River College, Geography 350: Data Acquisition in GIS; Spring 2007 | |
|
Abstract More Liquor Stores = More Crime?
Is it the abundance of available liquor sales in an area what makes it more susceptible to a higher crime rate?
A resident of a neighborhood believes this is the problem in her area as it compares to another close by neighborhood. Her statement piqued my interest and not being that familiar with these neighborhoods, I wanted to see if there was any validity to her statement. Defining areas of study, delineating alcohol outlets and locations of crime will be the approach to prepare some visual data that can be used in this analysis and help to corroborate any conclusions. | |
|
Introduction As an Assistant Planner for the Sacramento Regional Transit District, I am required to get involved with the energy and feel of different communities served by Regional Transit bus lines and light rail. I attend neighborhood meetings, participate in community outreach and sometimes visit neighborhoods throughout the Sacramento region. These visits and orientations help me to understand the needs and restraints unique to each setting as they might pertain to particular transit needs for that area. On one visit to a neighborhood known as Oak Park, one of the residents made a statement that piqued my interest. She said “If Oak Park didn’t have so many liquor stores, there wouldn’t be so much crime. You don’t see this much crime right next store in Land Park.” Not being that familiar with these two neighborhoods, except, of course for the “known reputation” of each, I wanted to see if there was any validity to her statement. Is it the abundance of available liquor sales in an area what makes it more susceptible to a higher crime rate? By zeroing in on these two neighborhoods and finding out crime rate and numbers of liquor vendors in each area, I hope to find a conclusion that will help determine the validity of this Oak Park resident’s statement. | |
|
Background The relationship between the number of alcohol retailers and violent crime has been well documented. Studies show that an over abundance of liquor stores in a community lead to higher rates of alcohol-related collisions, underage drinking, domestic violence and other crime.
| |
For many years, alcohol related problems have been viewed as the result of individual behavior. After several years of new research, there is now strong evidence showing that the negative consequences of alcohol use are influenced by environmental factors. Foremost among these factors is alcohol-outlet density (Institute for Public Strategies, 2004). Studies show that there are direct correlations between alcohol availability and increases in drunken driving, sexual assualt, crime and violence, underage drinking, health problems and economic decline. |

|
|
Methods In order to begin my research, I first needed to define my areas of study. Criteria for my study areas involved the following:
-two areas that were similar in size -Land Park west of Highway 99 -Oak Park east of Highway 99 -and both areas should include a major street,(Broadway for Land Park and Stockton Boulevard for Oak Park). Looking at local street maps, I had a general idea of what my areas of study should look like. | |
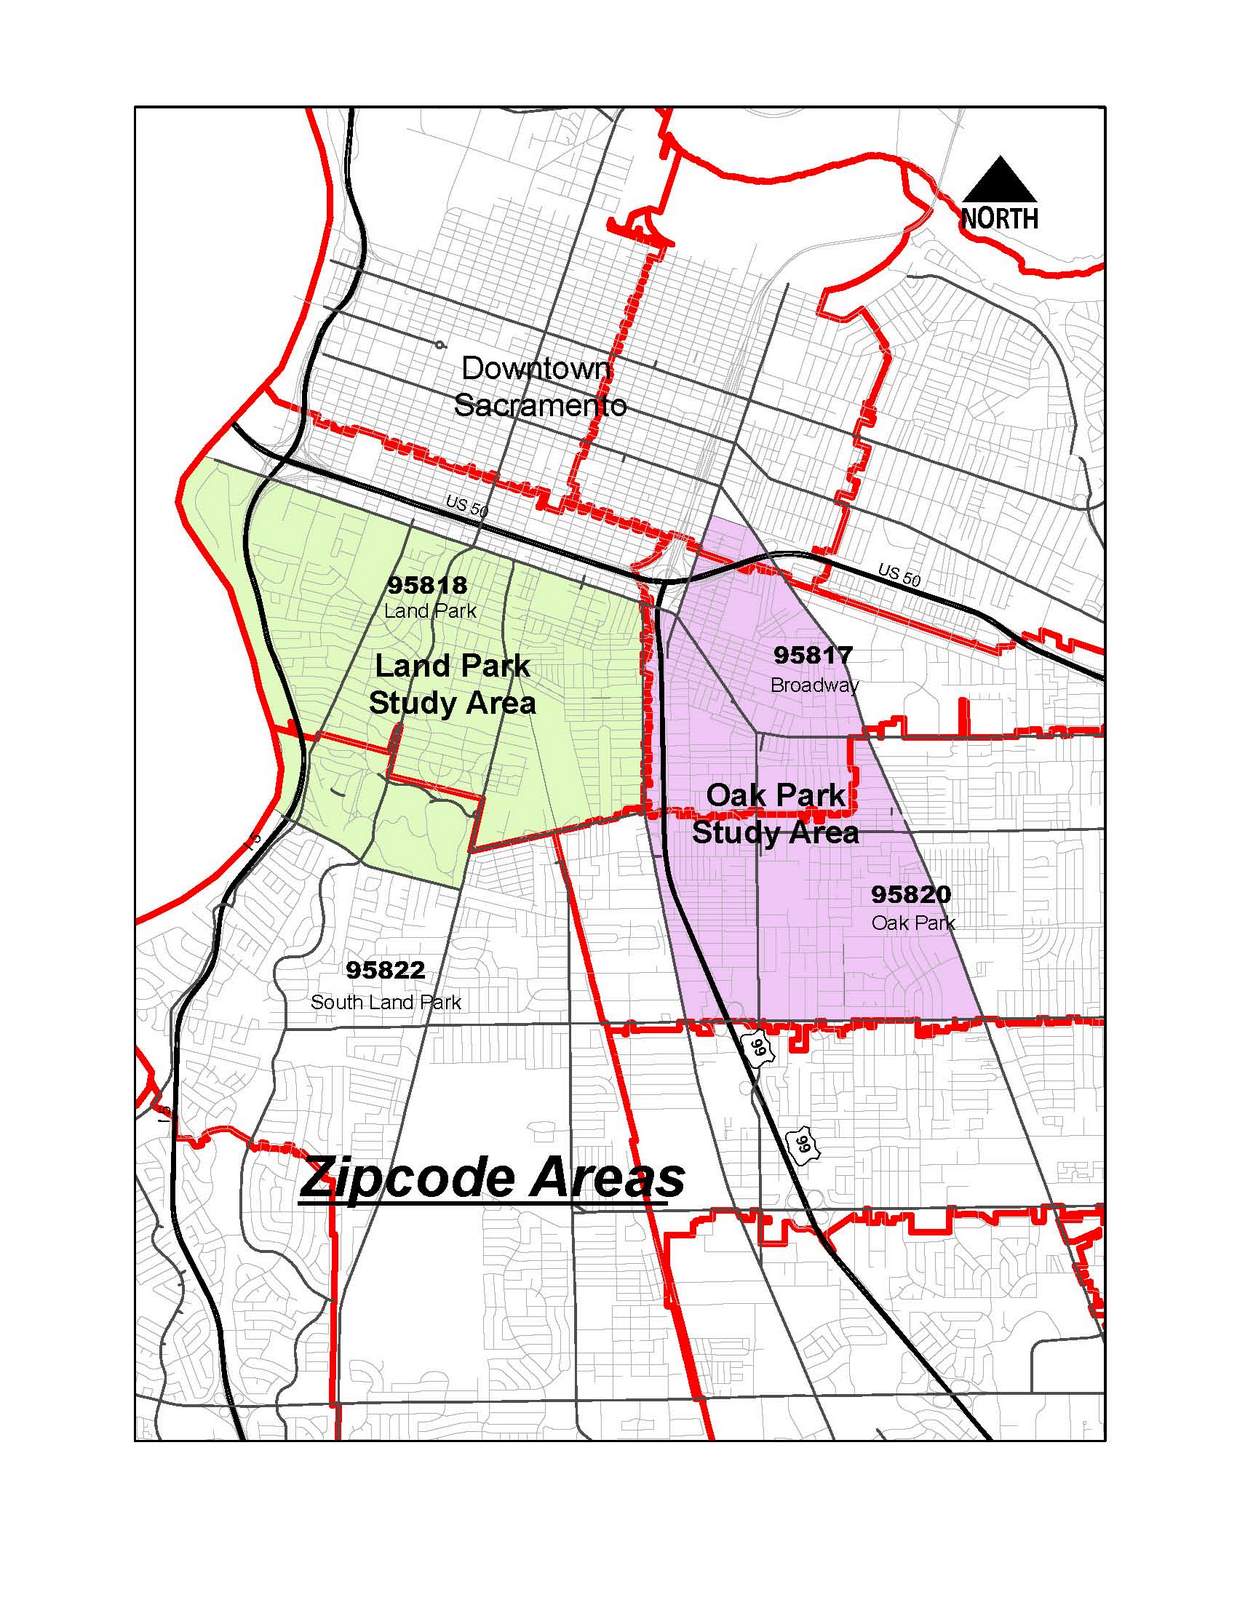
| When I looked at the Zipcode areas listed under Oak Park and Land Park, the areas covered by zipcode areas were more broad than the areas I had in mind for my study and in some cases didn’t have all the area I needed. | |
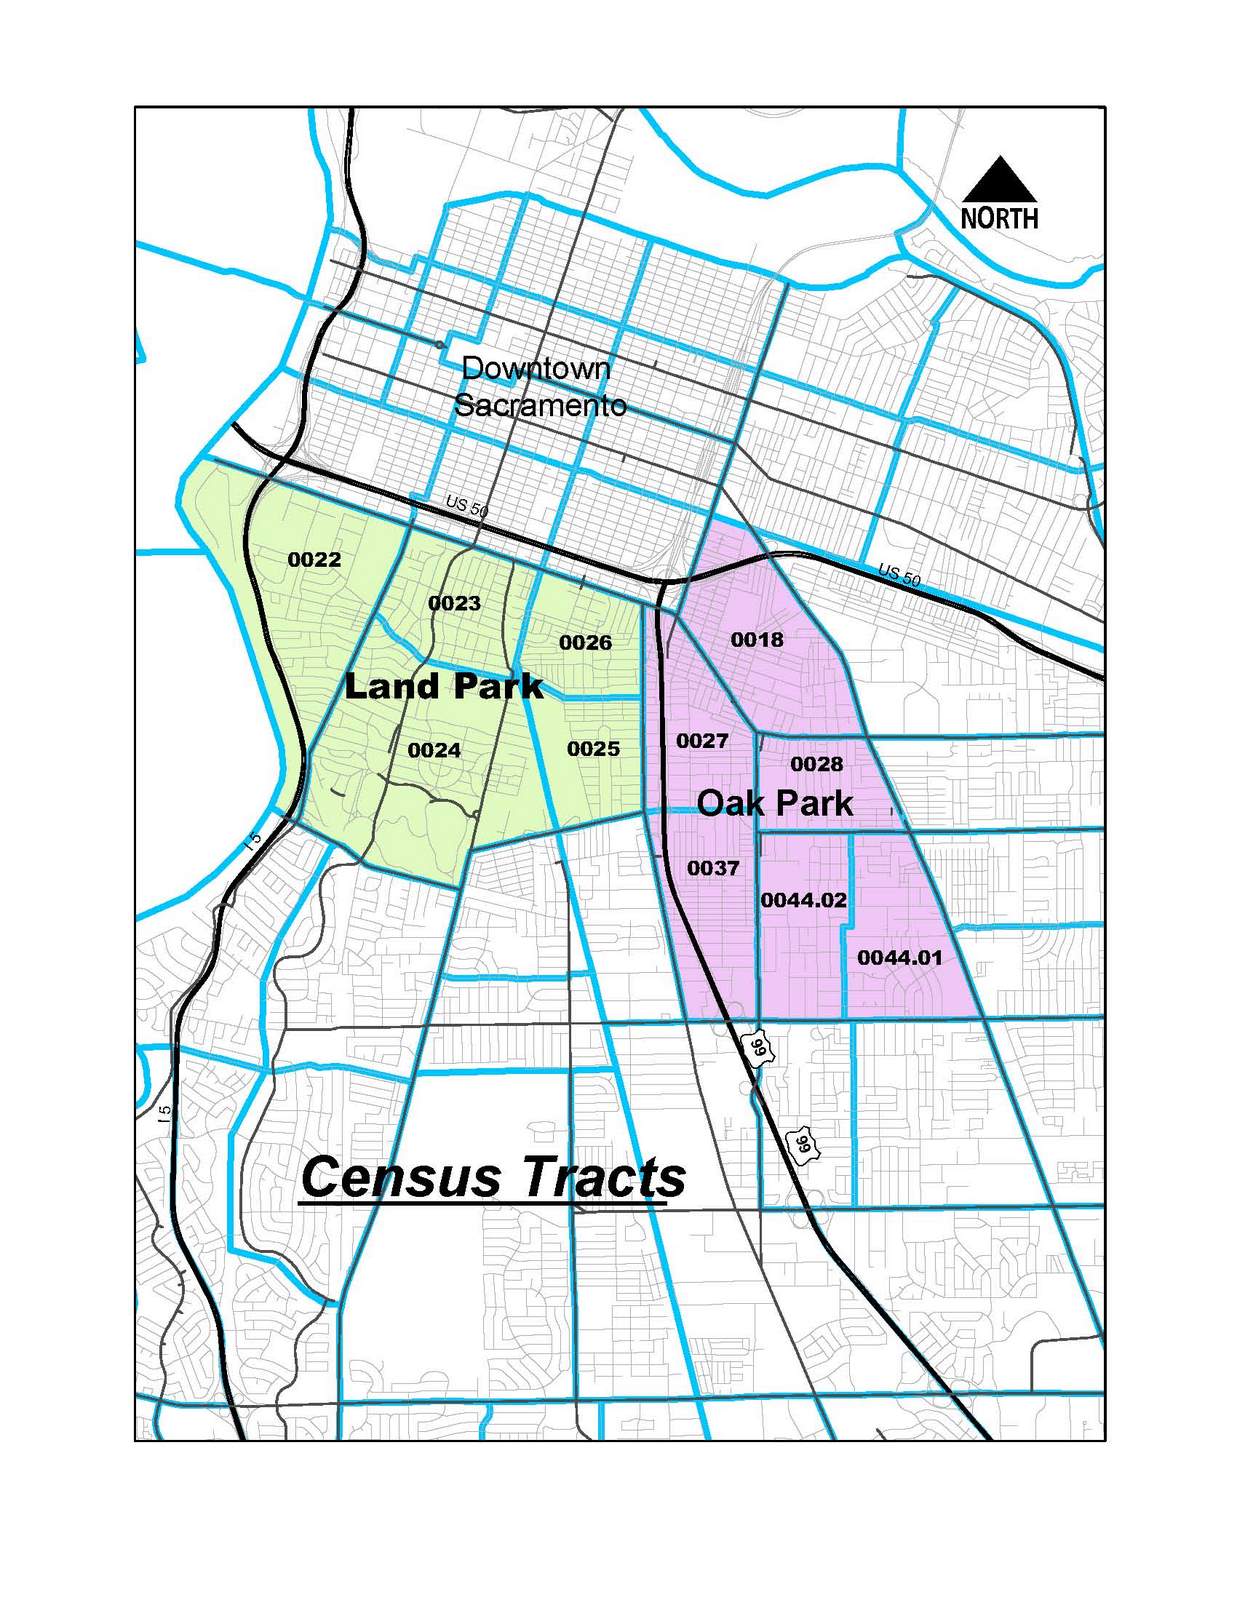
| I then looked at Census block data to see if I could use that information to more closely resemble the areas I wanted to use for my research. By combining several census tracts for each area, I was able to create two areas of study that fit the above mentioned criteria. |
|
Next, I needed to record all the stores/outlets that sell liquor in each of these study areas. By searching for current retail sales licenses on the website for Alcoholic Beverage Control, I was able to get a list of outlets and addresses. These addresses were geocoded and used in my exhibit maps. |
| The final piece of information needed was the data related to crime in these areas. On the City of Sacramento Police Department website, there are crime mapping capabilities available that not only display a map, but will also give you the date of a crime occurrence and a police report number. With this web site, you are also able to download database files that contain police report numbers, occurrence dates of crimes and addresses of crime scenes. By matching up the police report numbers off of the maps with the report numbers in the database, I could get addresses for the crime locations and could then geocode this information into my exhibit maps for visual comparison. |

|
|
Results My results can be seen in the Crime Locations exhibit below. The two study areas were not as close in size as I had envisioned. The Oak Park study area was a slightly bigger region at 1973 acres. The Land Park study area was only 1272 acres. | |
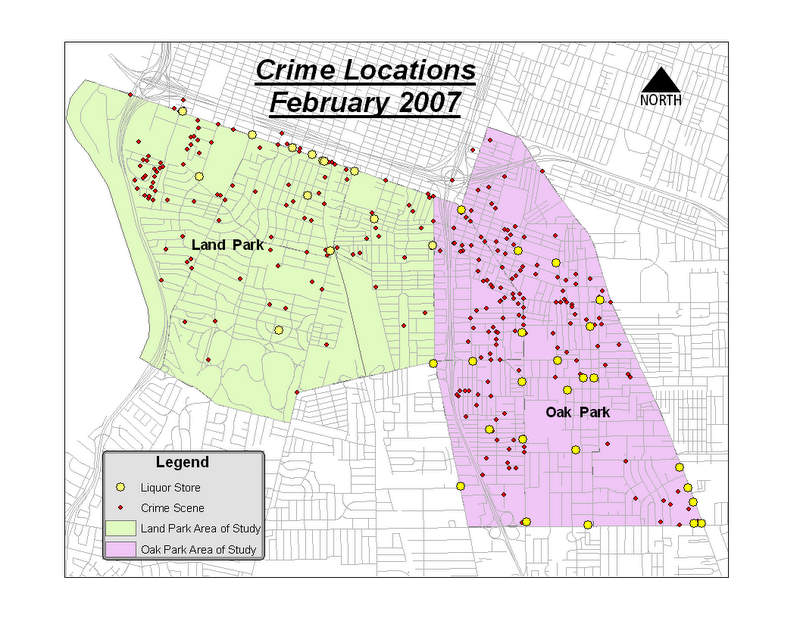 |
There are 25 liquor outlets in the Oak Park study area and only 13 liquor outlets in the Land Park study area. This averages out to one liquor store/outlet for every 79 acres in the Oak Park study area and one liquor store/outlet for every 98 acres in the Land Park study area. In the month of February 2007, the random month I chose to view, my Oak park study area reported 184 crimes while the Land Park area reported 132 crimes. The surprising result was that the Land Park study area showed more crimes per liquor outlet (10 occurrences / outlet) than did the Oak Park study area (7 occurrences / outlet). Both study areas average about 10 crimes per acre. |
 |
Also when viewing the map, it appears that the locations of the crimes don't necessarily seem to congregate near the liquor outlets with any real consistency. I then added a 1/4 mile buffer around all the liquor outlets to see if this created any obvious patterns. In the Oak Park study area, most of the crime locations do seem to fall within the 1/4 mile buffer zone. But most of the alcohol outlets are within 1/4 mile of the next, so buffer coverage is pretty blanketed over most of the study area. However, in the Land Park study area, a lot of the crime locations are still outside the 1/4 mile buffer zone. |
|
Analysis Overall, I believe the methods used were successful in giving me a fairly accurate picture of what is happening in those two neighborhoods with respect to reported crimes. The most tedious item to complete this task was selecting the individual police report numbers out of the large database of information for each of my individual areas. Also, there is a portion of the Oak Park study area that does not fall within the City of Sacramento boundaries. Crime reporting for that small area, which is in the County of Sacramento, is not included in this document. Another area that I had problems with was the geocoding task. Straight geocoding through my ArcMap program only gave me partial results. I opted to use a free, online service that provided me with x,y coordinates and gave me results for almost all addresses entered. | |
|
Conclusions In conclusion, it appears that both the neighborhoods of my study had similar incidences of crime. But the crimes in Land Park were not within a measureable distance from the alcohol outlets to have any real relationship indicating that the outlet facilitated the crime. I believe that the Oak Park resident who believes crime rates are high in her neighborhood because of so many liquor stores is making a correct assumption about her area. It has been proven that the relationship between alcohol related crimes and outlet density is "statistically significant, regardless of socioeconomic or other demographic factors" (Institute for Public Strategies, 2004), and I think my report tends to follow that theory in that there are approximately twice as many liquor outlets in Oak Park as there are in Land Park with more opportunity for these types of alcohol-related behavior to exist. Next step for Oak Park or any neighborhood is to eliminate or at least not encourage more of these types of outlets so that crime related to this particular problem can be reduced. | |
|
References www.batchgeocode.com. City of Sacramento Police Department, www.sacpd.org. Department of Alcoholic Beverage Control, www.abc.ca.gov. Institute for Public Strategies, June 2004. Research Summary. Evaluating the Impact of Outlet Density on Crime. Sacramento Regional Transit Shapefiles for Census data, Zipcode data and background mapping. | |