| Title Sudden Oak Death: Can We Predict the Spread? | |||||||||||||||||||||||||
|
Author Darla Rice American River College, Geography 350: Data Acquisition in GIS; Spring 2007 darlagrice@hotmail.com | |||||||||||||||||||||||||
|
Abstract Sudden Oak Death (SOD) has spread at an alarming rate since its discovery in the 1990s, killing over a million oak trees in California and Oregon. Intense research has lead to an ever increasing understanding of Phytophthora ramorum, the pathogen responsible for the disease. Still, there is much to learn about the ecological and historical factors involved in SOD transmission and establishment. Because of the rapid spreading of SOD and the discovery of transmission from nursery stock to wild forest lands, there has been an urgent need for the development of nationwide models predicting areas at risk for SOD. For this paper, I examined three SOD risk models: NAPPFAST, Kelly Combination and Bioclimatic Regression. Each incorporates climate data as input variables. Some use vegetation data, but in all cases vegetation classification for available data is not detailed enough to provide relevant host information for accurate prediction. Each model's development team had difficulty acquiring data with a high enough resolution. Although each model has limitations, they can be valuable tools for monitoring forests, leading to early detection of SOD as well as the ability in implement protective measures prior to transmission and establishment. | |||||||||||||||||||||||||
|
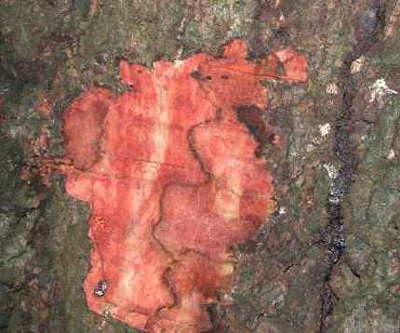
Introduction Sudden Oak Death (SOD) is a disease affecting the central and north coasts of California and Oregon, as well the east coast of the United States and parts of Europe. It was only discovered in the mid-1990s. The pathogen responsible for the disease, a fungus called Phytophthora ramorum, was discovered in the year 2000. Since its discovery, the disease has killed over a million California oak trees, most notably coast live oak (Quercus agrifolia), tanoak (Lithocarpus densiflorus) and black oak (Quercus kelloggii). It has been determined that over 40 plant genera (100 species) world wide are hosts to P. ramorum (Rizzo, Garbelotto, and Hansen, 2005). To add to the threat of the potential spreading of the disease is a connection found between infected plants in forested lands and host plants found in nurseries, which are shipped around the world. The threat of an epidemic has spurred research and motivated communities and government agencies into action to manage and eliminate the spread of the disease. Not only is there urgency to research ways to eradicate Sudden Oak Death and to develop practical, environmentally sound management practices upon discovery of the disease, but there is also a need to develop models which will allow us to predict the likely spread of the Sudden Oak Death. In this paper, I will discuss environmental and ecological criteria which may be considered when creating a predictive model for the spread of SOD. I will also evaluate the use of those criteria (or lack thereof) in existing models and hence their potential effectiveness and accruacy. | |||||||||||||||||||||||||
|
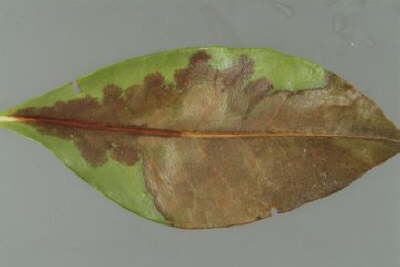
Background There are two types of hosts to P. ramorum, canker and foliar. Canker hosts are trees in the family Fagaceae such as oaks and tanoaks (Rizzo, Garbelotto, Hansen, 2005) which develop bleeding cankers that generally cause mortality. Foliar hosts of the fungus exhibit symptoms of foliar and twig infection, but rarely die from the fungus. The presence of foliar hosts appears to be critical to the spread of the pathogen to oaks and tanoaks (Rizzo, Garbelotto, Hansen, 2005). In fact, the pathogen was most likely introduced to California’s forests through contaminated nursery plants (Swiecki and Bernhardt, 2006). The California Oak Mortality Task Force website (www.suddenoakdeath.org) provides an updated list of hosts and associated plants. |
 | ||||||||||||||||||||||||
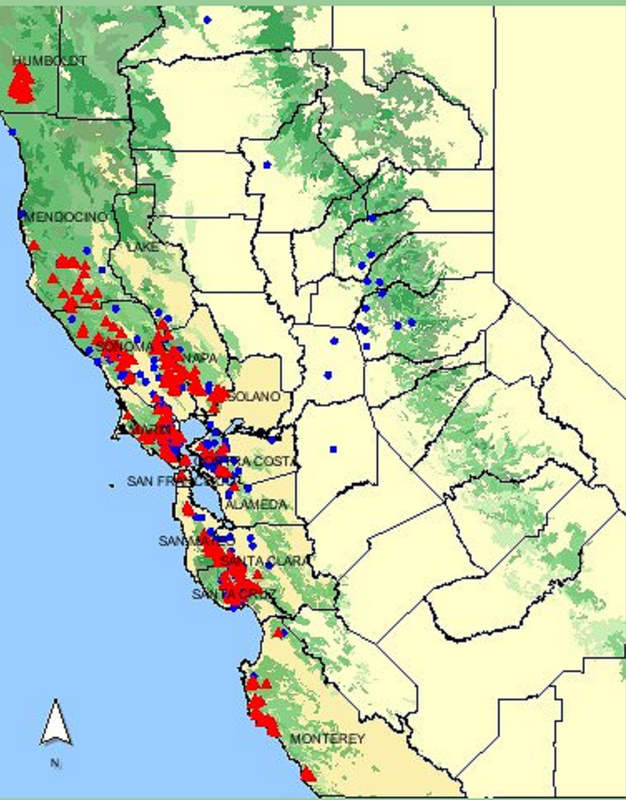
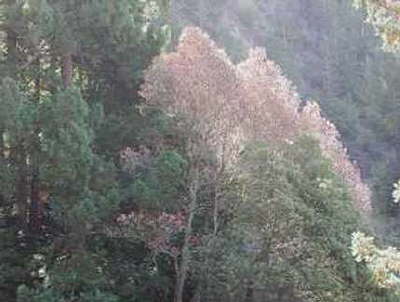
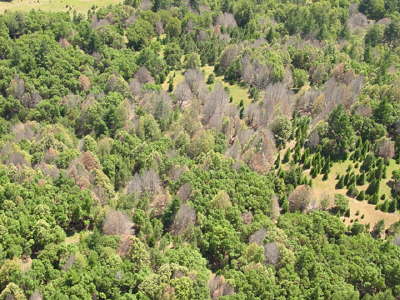
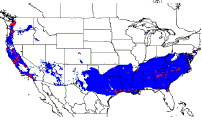
Different methods of detecting and monitoring Sudden Oak Death are being employed by researchers and government agencies nationwide. These methods include, but are not limited to, aerial photography and remote sensing, baiting and filtration, molecular diagnostics, web-based databases, public interaction and mobilization, and ground surveys of case-control studies. Aerial photography and remote sensing work especially well for detecting SOD because the crowns of SOD infected trees rapidly turn brown and stand out among other trees in the landscape. Infrared imagery can also detect healthy versus ailing vegetation, making it a valuable tool. One web-based database, run through UC Berkeley's Geospatial Imaging and Informatics Facility, is called OakMapper. This online, interactive database uses ESRI's ArcIMS software. Not only can the user navigate, select and query for sites of SOD infection throughout the state, she or he can also submit sites of suspected SOD infection. In this way, the public becomes involved and acts as researchers' eyes for early detection. Locations of officially confirmed SOD infected plants or trees and those of symptomatic trees submitted via OakMapper that have not yet been officially confirmed exist as separate layers. This can be seen in the figure to the right in which red triangles indicate tested and confirmed cases of SOD, while blue dots indicate user submissions of potential SOD sites. |
 | ||||||||||||||||||||||||
|
Methods I began this paper with the intention of creating a rudimentary model for SOD prediction. However, I was unable to find data for use in a GIS. Instead of attempting to create my own model, I decided to compare and analyze national SOD risk models currently in use. With this in mind, I researched factors which may affect the transmission and establishment of P. ramorum. I also examined some of the SOD models predicting areas at risk for P. ramorum infection that have been developed in the last few years. |
 | ||||||||||||||||||||||||
 |
 | ||||||||||||||||||||||||
|
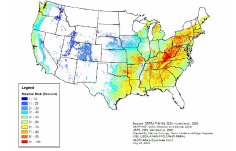
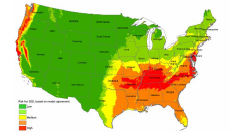
Results Research, case-control studies and monitoring have provided greater understanding of host susceptibility to P. ramorum, as well as the reproduction and transmission of the pathogen. Some of the factors thought to influence transmission are rainfall, leaf wetness, wind, temperature, stem water potential, landcover (especially the presence of California Bay laurel, Douglas-fir and Coast Redwood), human and animal disturbances, and the distribution of infected nursery plants. Case-control studies performed by Swiecki and Bernhardt for the past 5 years have revealed that the pathogen acts differently in coast live oak than it does in tanoak, with different susceptibilities, inoculation rates and tree death rates (Swiecki and Bernhardt, 2006). In addition, there appears to be a strong connection between the presence of the foliar host California Bay laurel (Umbellularia californica) and infected canker hosts, suggesting that Bay laurel is a conduit for transmission. There is also evidence suggesting that transmission may be influenced by not only the amount of rainfall and mild temperatures in one year, but by rainy years in succession (Swiecki and Bernhardt, 2006). Temperatures and rainfall may also affect the dormancy of the pathogen. Keeping these factors in mind, I examined three of the SOD risk models that have been developed. The first model I examined was NAPPFAST (NCSU APHIS Plant Pest Forecasting System), which is a web-based database that links national climate and geographical data for biological modeling (Magarey et al., 2007). Climate data used is both observed and derived. The observed data includes average daily temperatures recorded over the last 30 years and employs cold temperature exclusion (excludes areas at which annual extreme minimum temperatures are too cold for spore survival). Derived data includes daily total leaf wetness hours and soil temperature. These climate input variables are used in combination with USFS 1991 vegetation types (hardwood and hardwood/conifer mixed forest density) as forest cover base data at 10 km spatial resolution. (Magarey et al., 2007). Another risk model in use is the Bioclimatic Regression model of Natural Resources Canada. Climatic variables used include annual mean temperature, mean diurnal range, annual temperature range, the maximum, minimum, and mean temperatures of the warmest and coldest periods and precipitation of the warmest and coldest quarter (McKenney et al., 2005). Spatial resolution for data used is 10 km. This model uses presence/absence data of SOD confirmations, whereas NAPPFAST does not. The last model I examined was a combination of five different models developed by Maggi Kelly et al. at UC Berkeley. The five models used were Rule-based, Logistic Regression, Classification and Regression Trees, Genetic Algorithm, and Support Vector Machines (Kelly et al., 2005). Briefly described, rule-based models do not use statistical inference, but rather research data and expert input to determine the importance of variables (Meentemeyer et al., 2004). Logistic regression models are powerful tools for modeling ecological niches and rely on the dependent variable being binary (Kelly et al., 2005). Classification and regression trees are used to predict continuous dependent variables and categorical predictor variables (StatSoft Electronic Textbook, 2003). Genetic Algorithms use principles of evolution for predicting the distribution of a species (Kelly et al., 2005). Support Vector Machines "are a new generation of learning algorithms that can perform binary classification (pattern recognition) and real valued function approximation (regression estimation)" (Kelly et al., 2005, p. 2). For all models, input climate variables included precipitation total, frost days and average minimum and maximum temperatures (Kelly et al., 2005). Nationwide host data initially used was from several different sources (see table below). According to Kelly et al. (2005), while the 1992 National Land Cover Data had high spatial resolution, it was not detailed enough to provide relevant vegetation classification. The USGS tree range maps were more detailed, but had insufficient resolution. Because detailed vegetation maps were not available for all parts of the US, the vegetation data was essentially not useful for modeling (Kelly et al., 2005). All of the models except the rule-based used presence/absence data. Presence data consisted of 169 SOD confirmations from California and Oregon. Absence data was derived from counties (and bordering counties) which did not contain SOD confirmations (Kelly et al., 2005). Therefore, absence data does not necessarily reflect the absence of SOD. Because each model type has its strengths and weaknesses, a combination of the agreement of the five was thought to produce the most useful risk map (Kelly et al., 2005). | |||||||||||||||||||||||||
|
Figures and Maps The table and risk models below are less detailed and less inclusive versions of the ones produced by Magarey et al. (2005) in reference to the models discussed above. | |||||||||||||||||||||||||
|
|||||||||||||||||||||||||
 |
 |
||||||||||||||||||||||||
 |
Top Left: CPHST NAPPFAST Lethal Cold Exclusion (Magarey et al., 2005) Top Right: UC Berkeley Kelly Combination (Kelly et al., 2005) Left: Natural Resources Canada (Mckenney et al., 2003) | ||||||||||||||||||||||||
|
Analysis All of the models examined tend to agree about the high risk of SOD to the North-West coastal region and the Appalachian Mountains, as well as the low risk to much of the Great Plains. Differences emerge when predicting risk for California, parts of the Southeast and Midwest (McKenney et al., 2005). Each of the models examined has limitations, in many cases the same limitations, due to the complexity of factors affecting P. ramorum transmission and establishment. Researchers developing the Kelly models and the NAPPFAST model had difficulty finding vegetation data with adequate spatial resolution. This lack of high resolution data and the lack of detailed vegetation classification throughout the country impedes researchers' ability to accurately map the risk of SOD transmission, which is highly influenced by the presence of plants and trees which are either foliar or canker hosts. For example, the discovery of an association of bay laurel with SOD transmission is of almost no value without geographic reference or detailed vegetation classification. The Bioclimatic Regression model does not use vegetation data at all, only climate data, which would certainly affect its ability to predict risk. Models which use presence/absence data of SOD confirmations (Bioclimatic Regression, Kelly Logistic Regression, Kelly Classification and Regression Trees, Kelly Genetic Algorithm, and Kelly Supprot Vector Machines) tend to predict a more limited distribution of at risk areas (McKenney et al., 2005). The determination of absence data, being derived from a lack of confirmations, can also be problematic, as it is not an indication of true absence of SOD from an area. (Kelly et al., 2005). There is also clear evidence of SOD transmission from nursery stock to wild forests in close proximity to nurseries. Ideally, a model would be able to incorporate nursery stock commerce and trade route information.Another issue affecting model accuracy is the short amount of time researchers have had to study SOD and P. ramorum since their relative discoveries. Currently, nationwide SOD presence data is almost exclusively limited to California and Oregon (not including nursery stock detection in various places around the country). Although inferences can be made nationally based on similar vegetation types and climate variables, researchers' inability to validate their models, combined with our emerging awareness that factors surrounding P. ramorum transmission may be complex, throws model predictions for certain areas of the country into doubt. Limited spatial and temporal resolution of data creates models with a limited use for day-to-day forecasting, modeling or management (Magarey et al., 2007). Certainly, the limited amount of time we have had to study the disease inhibits researchers' understanding of how rainfall, temperature, specific host mixes, human and animal disturbances and a variety of other possbily unknown factors in a myriad of combinations may affect dormancy, inoculation, transmission and establishment of P. ramorum. | |||||||||||||||||||||||||
|
Conclusions Ultimately, the best way to utilize available models is to use several in combination to find agreement risk areas between them (McKenney et al., 2005). Although nationwide SOD risk models have limitations and must utilize course resolution data and vegetation classifications that offer insufficient host relevancy, they still offer valuable information which may be used to detect and monitor the spread of P. ramorum. Climate data is still a valuable predictor. These risk models can help government agencies with forest management and with implementation of protective measures to possibly safeguard against P. ramorum transmission. As more SOD occurrences are confirmed, models will become more easily validated. As more data is gathered using research methods such as case-control studies, remote sensing and molecular testing, and as more data becomes GIS compatible, its availablility to models will only make them better and more accurate predictors of SOD risk. |
|||||||||||||||||||||||||
|
References Kelly, M., Shaari, D., Guo, Q., Liu, D., 2005.Modeling Risk for SOD Nationwide: What are the Effects of Model Choice on Risk Prediction?.USDA Forest Service Gen. Tech. Rep. PSW-GTR-196 Magarey, R.D., Fowler, G.A. and Borchert, D.M., Sutton, T.B., Colunga-Garcia, M., Simpson, J.A., 2007. NAPPFAST: An Internet System for the Weather-Based Mapping of Plant Pathogens. Plant Disease. 91(4):336-345. McKenney, D.W., Hopkin, A.A, Campbell, K.L., Mackey, B.G., and Footit, R., 2003. Opportunities for Improved Risk Assessments of Exotic Species in Canada Using Bioclimatic Modeling. Environmental Monitoring and Assessment. 88(1-3):445-461. McKenney, D.W., Meentemeyer, R., 2005. Informal Comparative Review of Phytophthora ramorum Models. USDA Animal and Plant Health Inspection Service Meentemeyer, R., Rizzo, D., Mark, W., and Lotz, E., 2004.Mapping the Risk Establishment and Spread of Sudden Oak Death In California. Forest Ecology and Management, 200(1-3):195-214. Rizzo, D.M., Garbelotto, M., Hansen, E.M., 2005.Phytophthora ramorum: Integrative Research and Management of an Emerging Pathogen in California and Oregon. Annual Review of Phytopathology. 43-309-335. Seiecki, T.J., Bernhardt, E., 2006.Phytophthora ramorum Canker (Sudden Oak Death) in Coast Live Oak and Tanoak, 2000 - 2005: Factors Affecting Disease Risk, Disease Progression, and Failure Potential, 2005-2006 Contract Year Annual Report. Phytosphere Research Project No. 2002-0803. | |||||||||||||||||||||||||