Distribution of the Chinook Salmon in the Central Valley
|
|
Author
Marcia Scavone-Tansey
American River College,
Geography 350: Data Acquisition in GIS; Spring 2007
Contact Information: California Department of Fish and Game, (916) 327-3935
|
|
Abstract
Chinook salmon is a very important fish that occurs in California, Washington, Oregon, and Idaho (in the USA). In the time of the colonizers, there was an abundance of Chinook in California. Today, however, there is a shortage of this fish. Winter-run Chinook salmon is state and federally listed as an endangered species, and the Spring-run Chinook is state and federally listed as a threatened species. The ability to spawn in small tributaries and headwaters makes them particularly vulnerable to the effects of natural resource extraction, development, and agriculture. This research has the intent to map where are the places that we still can find Chinook and where are the Passage Assessment Database (DFG) using the ArcGIS maps. |
|
Introduction
Chinook salmon, also called king salmon, is the most important salmon to both sport and commercial fishermen. Its formidable size and content of protein makes them a truly precious fish. However, Chinook salmon have experienced dramatic declines in abundance during the past several decades as a result of human-induced and natural factors. The California Department of Fish and Game's (CDFG) role is to manage all fish and wildlife and to provide maintenance of habitat on which animals depend to ensure their survival. In this paper, I will analyze data from NOAA/California Department of Fish and Game to find out where is the passage blockage of the critical habitat of Chinook salmon in the Central Valley. |
|
Background
There are 5 species of salmon native of North America: Chinook, Coho, Pink, Chum, and Sockeye. As all salmonids, the Chinook salmon requires cool and cold water, and spawns in fresh water in California. Some salmons are anadromous, which means that they spend the adult phase of their life cycles in the salt water. However, they move up streams and rivers to spawn (Moyle and Cech, 2003). Chinook salmon migrate within a few months or may wait until they are yearlings. The food of the juveniles is insects and their larvae, and young fish. In the ocean, they eat plankton such as krill, copepods, amphipods, and crab larvae, squid and fish.
Salmon population is declining. The complexity of the salmon species life history and the ecosystem in which they reside is very extensive; therefore, it is difficult to precisely quantify the contribution of any particular factor. However, it is only possible to highlight factors which have significantly affected the status of a particular species:
Water storage, withdrawal, conveyance, and diversions for agriculture, flood control, domestic, natural resource use and extraction leading to habitat modification, introduction of non-native species, degraded and altered riverine and estuarine habitats and modification of habitat and hydropower purposes have greatly reduced or eliminated historically accessible habitat and/or resulted in direct entrainment mortality of juvenile salmonids. Modification of natural flow regimes have resulted in increased water temperatures, changes in fish community structures, depleted flows necessary for migration, spawning, rearing, flushing of sediments from spawning gravels, gravel recruitment and transport of large woody debris. Physical features of dams, such as turbines and sluiceways, have resulted in increased mortality of both adults and juvenile salmonids. Attempts to mitigate adverse impacts of these structures have to date met with limited success (National Oceanic Atmospheric Administration, 2007a).
Historically, there are 4 seasonal runs in the Sacramento-San Joaquin Basin, about a million strong throughout the year: the Spring-run, the Fall-run, the Late-fall run, and the Winter run.
Central Valley Winter-run Salmon is state and federally listed as endangered species, and Spring-run is in the state and federally listed as a threatened species. In this paper, I will analyze data from the California Department of Fish and Game to find out what are the distribution and the critical habitat of Chinook salmon.
|
 Central Valley Spring-run is in the Federal listed as a threatened species since June of 2005 and designated as Critical
Habitat Status since September of 2005. It is also listed as a Threatened Species by the California Endangered Species Act since February of 1999 (California Natural
Diversity Database, 2006). In this paper, I will analyze data from the California Department of Fish and Game to find out what is the distribution and the critical
habitat of Chinook salmon. Central Valley Spring-run is in the Federal listed as a threatened species since June of 2005 and designated as Critical
Habitat Status since September of 2005. It is also listed as a Threatened Species by the California Endangered Species Act since February of 1999 (California Natural
Diversity Database, 2006). In this paper, I will analyze data from the California Department of Fish and Game to find out what is the distribution and the critical
habitat of Chinook salmon.
|
|
Methods
The 2 maps showed in this paper are composition of many different maps.
For the first map was “Runs of Chinook Salmon in California”. I used the county data from 1997 from the California Spatial Information Library's (CaSIL) web site. This vector data was created using an Equal California Albers projection with a NAD 27 datum. Next, I used the the Chinook Lines. Chinook lines map was done by the Pacific States Marine Fisheries Commission, the Department of Fish and Game, and the National Marine Fisheries Services in July of 2004. This map portrait the Chinook abundance in the Central Valley, and has geographic coordinate system GCS NAD 83. The next overlay was the ESU map projection is Albers Conical Equal AreaNAD 1983 California Teale Albers, the geographic coordinate system is GCS North American 1983 and the datum NAD 83. The DEM for California was taking from the Biogeographic Data Branch library (Department of Fish and Game), and the cell size is 400m ArcSec.
For the second map, I also used the county data from 1997 from the California Spatial Information Library's (CaSIL) web site. The data sets for Chinook Critical Habitat from the Central Valley are from Biogeography Information and Observation Systems, Biogeography Data Branch, California Department of Fish and Game. This particular data set was found at the National Marine Fisheries Services (NOAA Fisheries). The projected coordinates are was originally set to an Albers Conical Equal Area projection and NAD 83 datumCalifornia Teale Albers NAD 83, the geographic coordinate system was G. TheCS North American 1983 and the datum was NAD 83. The Passage Assessment Database was taken from DFG and has the geographic coordinate system GCS North American 1983. The DEM for California was taking from the Biogeographic Data Branch library (Department of Fish and Game), and the cell size is 400m ArcSec.
|
Fig. 1 - This figure shows the map of the runs of Chinook Salmon throught California. |
|
|
Results
In our first map (Map 1 - “Runs of Chinook Salmon in California”) was symbolized using Fall, Fall (Late Run), Mixed, Spring, Winter, N/A , and Unknown runs. The result was that ESU includes all naturally spawned populations of spring-run Chinook salmon in the Sacramento River and its tributaries in California, including the Feather River, as well as the Feather River Hatchery spring-run Chinook program. The Sierra Nevada stream populations are represented by the Feather River and the Yuba River populations. The main data in this second map was classified using the following attributes:
COMMENTS - Comments deemed necessary during the creation of the event table;
EVENTID - This is the unique identifier for each stream segment designated by the SWR biologists;
ESU - Signifies in which ESU the segment is located;
BASIN - Basins were determined by the SWR biologists by identifying the ultimate stream/river that flows into the ocean or bay;
STREAM_ - The name of the stream the segment is located in according to CDFG routed hydrography layer;
HAB_UTIL - Species utilization of the stream segment by life stage (Adult or Juvenile) and usage (spawning, rearing, non-natal rearing, holding, migration;
SPWNUTIL - Species utilization of spawning habitat: 'Yes', 'No', 'Probable, undocumented';
QUALSPWN - Quality of the Spawning Habitat in the stream segment: Good, Fair, Poor, or Unknown (Unk);
MIGRAUTIL - Species utilization of migration habitat: 'Yes', 'No', 'Probable', 'Probable, undocumented';
QUALMIGRA - Quality of the Migration Habitat in the stream segment: 'Consistent, good', 'Consistent, fair', 'Periodic , good', 'Periodic, fair', 'Periodic, poor', 'Not Suitable';
ADLTHLDUTI - Species utilization of Adult Holding habitat: 'Yes', 'No';
QUALHOLD - Quality of the Adult Holding Habitat in the stream segment: 'Consistent, good', 'Consistent, fair', 'Periodic, fair', 'Periodic, poor', 'Not Suitable';
NATALUTIL - Species utilization of natal rearing habitat: 'Yes', 'No', 'Probable, undocumented';
QUALNATAL - Quality of the Natal Habitat in the stream segment: 'Consistent, good', 'Consistent, fair', 'Periodic, good', 'Periodic, fair', 'Periodic, poor', 'Not Suitable';
NON_NATALU - Species utilization of non-natal rearing habitat: 'Yes', 'No', 'Probable, undocumented', 'Not applicable';
QUALNON_NA - Quality of the Non-natal Habitat in the stream segment.
Below is an example of the first four attributes used, with only 10 of the 109 records used in this analysis:
|
| COMMENTS |
BASIN |
STREAM |
HAB_UTIL |
| North Delta |
Sacramento/San Joaquin River Delta
|
North Delta
|
Adult migration. Juvenile rearing, migration
|
| Bear Creek |
Sacramento River
|
Bear Creek
|
Non-natal rearing
|
| Battle Creek |
Sacramento River
|
North Battle Creek
|
Adult spawning, holding, migration. Juvenile rearing, migration.
| |
Table 1 - This table shows a sample of the data. The meaning of the attributes are explained in the text.
|
|
Figures and Maps
|
|
|
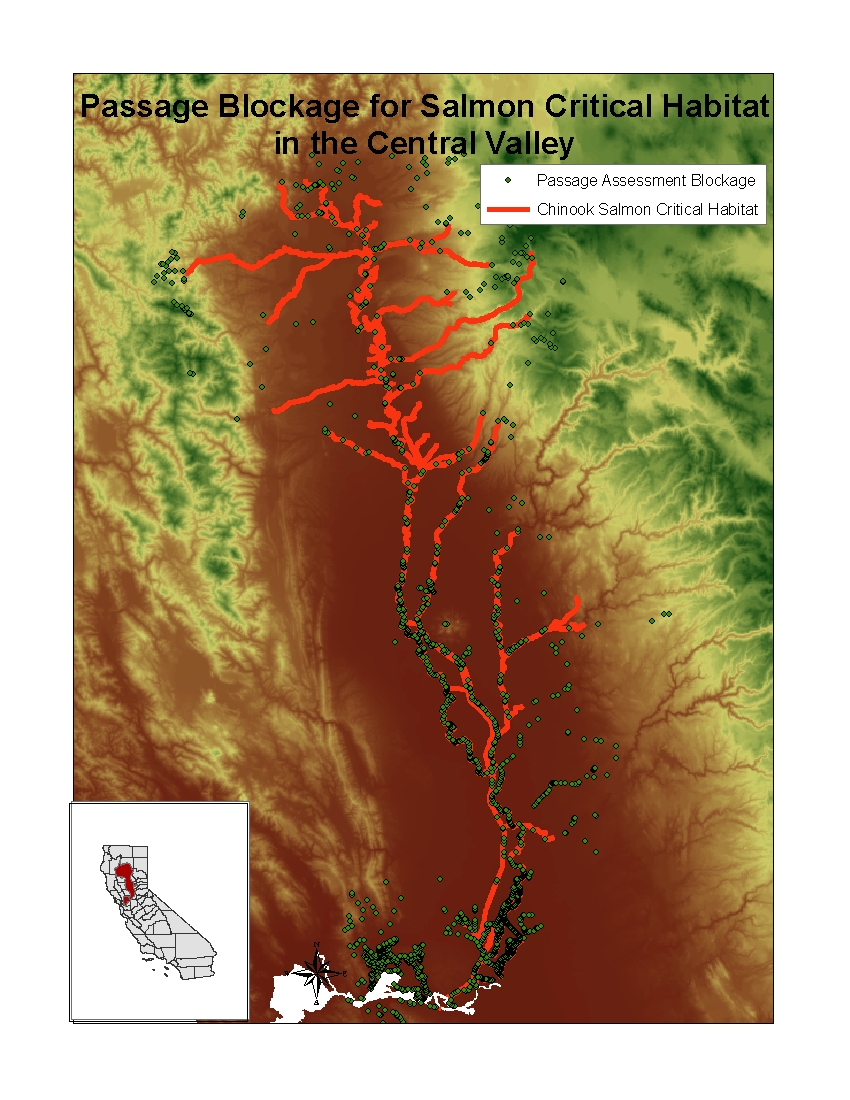
Fig. 2 - This figure shows a map of the barriers for Chinook Salmon in the Central Valley. |
|
Analysis
The Chinook salmon distribution was analyzed as overlaid among NOAA distribution, Calfish distribution, and NOAA critical habitat for Chinook Salmon in the Central Valley. One of the biggest challenges of the whole project was finding data that showed the specific Chinook habitat and the specific spring run. It was found in the Biogeographic Information and Observation System (BIOS) at the Department of Fish and Game.
The purposes were determining the total distribution of Chinook salmon, and determine the suitability of the Chinook in the Central Valley. After much thought and exploring on web sites, Chinook distribution shapefiles from DFG and the Casil were used. After adding them to the other existing ArcMap layers, these data sets did show a dramatic view of the distribution of the spring-run. These data represent the stream segments identified as critical habitat by the National Marine Fisheries Service and National Oceanic Atmospheric Administration Fisheries.
The linework for this layer is based on the California Department of Fish and Game (CDFG) and Pacific States Marine Fisheries Commission (PSMFC) 1:100,000 scale streams based on routed hydrography. Biologists divided the routed hydrography into stream segments using the best available information to represent local Chinook distribution and habitat. As a result, each segment has its own unique identifier and related presence and habitat information.
The dataset from Chinook salmon was defined by NOAA Fisheries under their Endangered Species Act status reviews. The ESU boundaries were compiled by the GIS group from various sources based on written descriptions in National Marine Fisheries Service (NMFS) status reviews. Boundaries were modified based on migration blockages and known fish distribution.
The CalFish Abundance Database contains data including adult abundance population estimates, actual fish and/or carcass counts, counts of fish collected at dams, weirs, or traps, and redd counts. This CalFish Abundance Database shapefile was generated from fully routed 1:100,000 hydrography. These features generally represent abundance counts resulting from stream surveys. The linear features in this layer typically represent the location for which abundance data records apply. This would be the reach or length of stream surveyed, or the stream sections for which a given population estimate applies. In some cases the actual stream section surveyed was not specified and linear features represent the entire stream. In many cases there are multiple datasets associated with the same length of stream, and so, linear features overlap. Please view the associated datasets for detail regarding specific features.
This Chinook shapefile is a component of the CalFish Abundance Database. Linear and point features in the database depict the data collection sites associated with fisheries information that is currently contained in the CalFish Abundance Database.
|
|
Conclusions
The salmonids distribution is a fraction of the historical ecoregional footprint were before. Chinook salmon, particularly, is the largest from the Salmonid family, has the hability to spawn in small tributaries and headwaters that are particularly vulnerable to the effects of the natural resource extraction (Augerot and Foley, 2005).
Mortality of chinook salmon in the early life stages is usually high due to natural predation and human induced changes in habitat, such as siltation, high water temperatures, low oxygen conditions, loss of stream cover and reductions in river flow (Pacific States Marine Fisheries Commission, 2007). These impacts are primarily caused by poor forestry practices, dams, and water diversions. Estuaries and their associated wetlands provide vital nursery areas for the Chinook prior to its departure to the open ocean. Wetlands not only help buffer the estuary from silt and pollutants, but also provide important feeding and hiding areas. The draining and filling of wetlands and the pollution of the estuary from industrial discharges and run-off, negatively impact Chinook salmon.
Future steps to preserve the spring-run Chinook population include remove hydropower dams and water diversions on the natal tributaries, since they reduce or eliminate instream flows during spring-run migration periods, leading to predation by non-native species and excessively high water temperatures, and loss of fish attributed to unscreened or inadequately screened water diversions in migratory corridors. Removal of dams could be beneficial to salmon. The ones that remain could put ladders and screens. Habitat restoration, screens, flow and temperature monitoring, and improvement of fish passages could improve the population of spring-run and other Chinook runs.
|
|
References
Augerot, Xanthippe and Foley, Dana N. (2005). Atlas of Pacific Salmon, Berkeley and Los Angeles, University of California Press.
California Department of Forestry and Fire Protection - Fire Resource Assessment Program. (2004 Jan. 22) County Boundaries (1:24000). The California Spatial Information Library. Retrieved April 15, 2007 from http://archive.ucdavis.edu/casil/geopolitical/counties
California Natural Diversity Database, Department of Fish and Game, Biogeographic Data Branch, “State and Federally Listed Endangered and Threatened Animals of California”, October 2006; available from http://www.dfg.ca.gov/bdb/pdfs/TEAnimals.pdf; Internet; accessed 15 April 2007.
Fry, Donald. (2003). Anadromous Fishes of California, State of California, The Resources Agency, Department of Fish and Game.
Haynes, Eric. (2005 Dec. 02) Chinook Abundance - Linear Features [ds 181]. California Department of Fish and Game, Biogeographic Information and Observation Systems (BIOS). Retrieved in April 20, 2007 from http://bios.dfg.ca.gov
Koller, Martina. (2006 Oct. 03) California Fish Passage Assessment Database [ds 69]. California Department of Fish and Game, Biogeographic Information and Observation Systems (BIOS). Retrieved in April 20, 2007 from http://bios.dfg.ca.gov
Moyle, Peter. (2005) Inland Fishes of California. Berkeley and Los Angeles, University of California Press.
Moyle, Peter and Cech, Joseph. (2003). Fishes: An Introduction to Ichthyology. 5th edition, Benjamin Cumming.
National Marine Fishery Services (NOAA Fisheries). (2005 June). Chinook Critical Habitat, NOAA - Central Valley [ds125]. California Department of Fish and Game, Biogeographic Information and Observation Systems (BIOS). Retrieved in April 20, 2007 from http://bios.dfg.ca.gov
National Oceanic and Atmospheric Administration, National Marine Fishery Services, “Central Valley Spring-run Chinook Salmon ESU (Oncorhynchus tshawytscha)” ; available from http://swr.nmfs.noaa.gov/recovery/Chinook_CVSR.htm; Internet; accessed 20 April 2007a.
National Oceanic and Atmospheric Administration, National Marine Fishery Services, “Chinook Salmon (Oncorhynchus tshawytscha)”; available from http://www.nmfs.noaa.gov/pr/species/fish/chinooksalmon.htm; Internet; accessed 20 April 2007b.
Pacific States Marine Fisheries Commission; “Chinook Salmon”, available from http://www.psmfc.org/habitat/edu_chinook_facts.html; Internet; accessed 15 April 2007.
Rogers, Ron. (2006 Aug. 10). Chinook Salmon ESU [ds 216]. California Department of Fish and Game, Biogeographic Information and Observation Systems (BIOS). Retrieved in April 20, 2007 from http://bios.dfg.ca.gov
|